


The Broadening Formation is a recurring pattern in technical analysis that helps traders understand price behavior under specific market conditions. This pattern often appears when the market absorbs liquidity and lacks a clear direction.
What is the Broadening Formation?
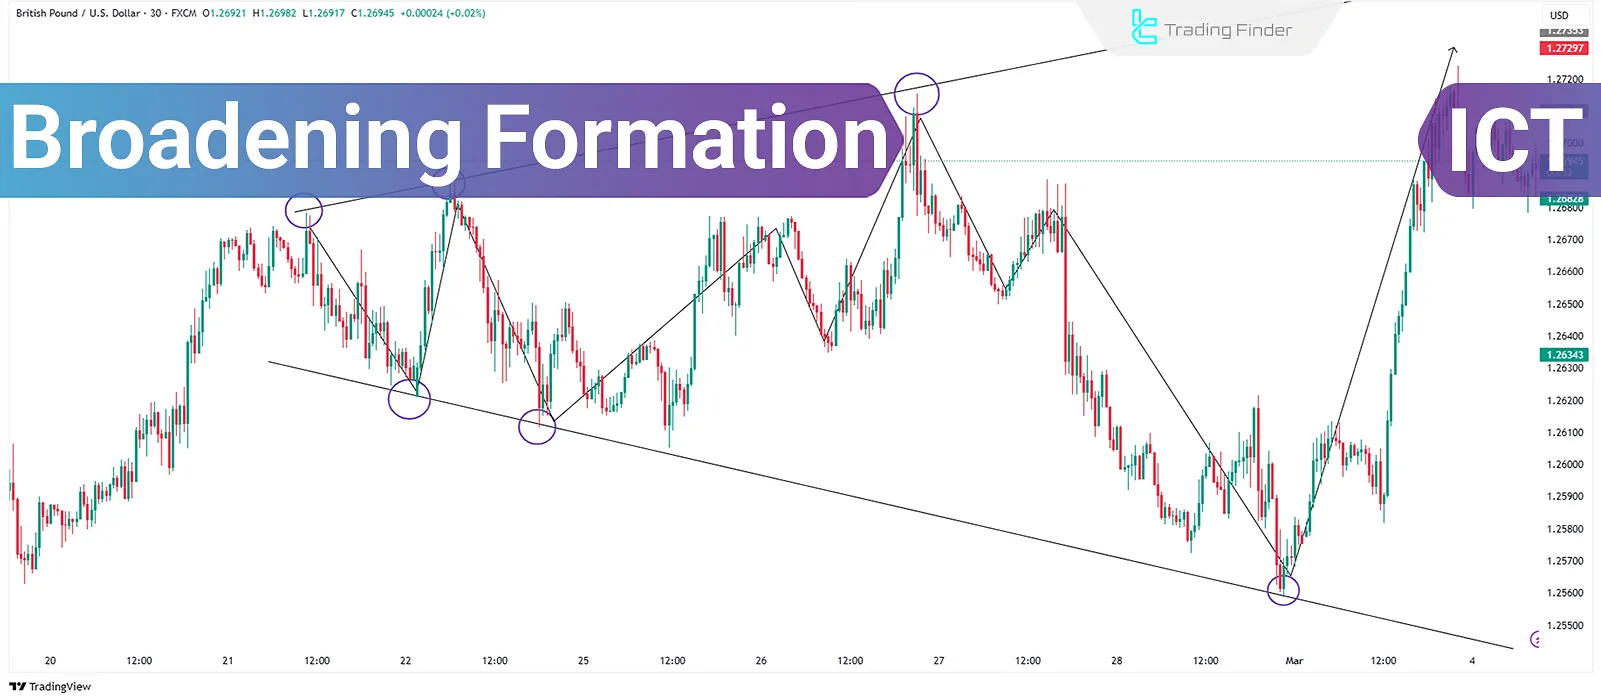
The Broadening Formation in ICT style is a price structure where the price continuously expands, increasing its range of fluctuations.
This pattern indicates that the market is transitioning from a consolidation phase to more intense volatility.
In other words, the price initially fluctuates within a specific range, but over time, this range expands, creating new highs and lows.
How to Identify the Broadening Formation?
The following characteristics help identify the Broadening Formation:
- It usually appears after an initial consolidation phase;
- The price first breaks one side of the range then returns to the range and breaks the other side. This process repeats several times, eventually expanding the price range.
How to Draw the Broadening Formation?
There are two main methods to draw this pattern:
- Identify key high and lows
- Use buy-side and sell-side liquidity
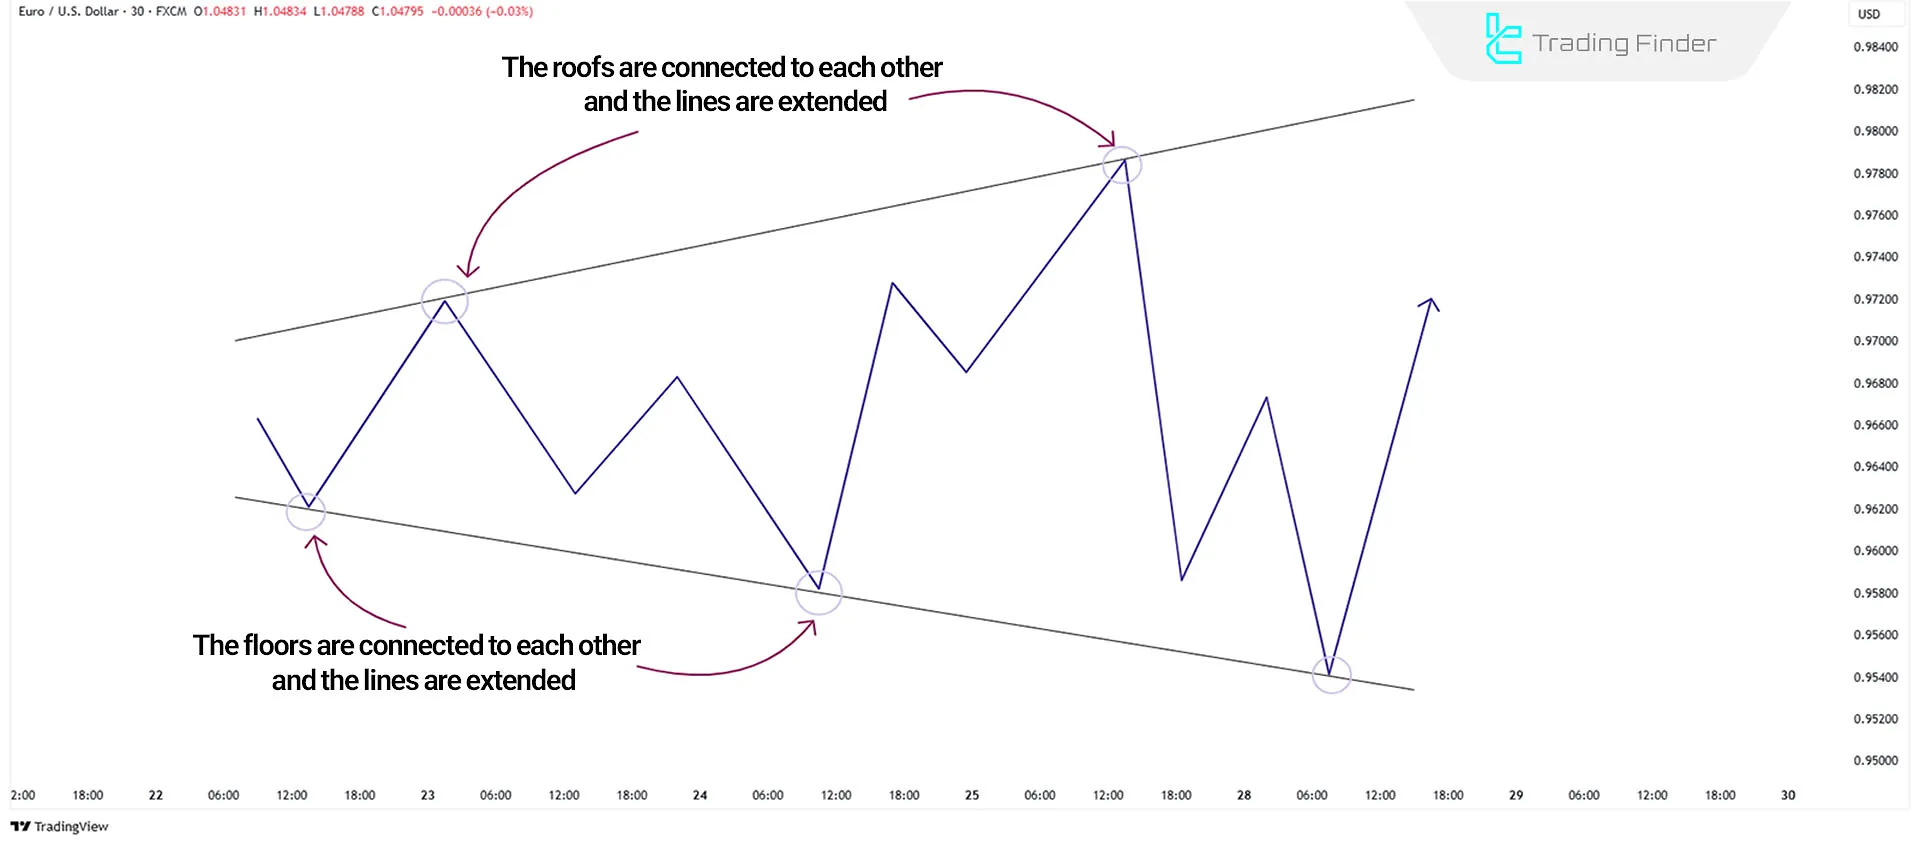
1- Identifying Key Highs and Lows
To draw the pattern using key highs and lows, follow these steps:
- Identify the highest high and the lowest low;
- Determine the broken highs and lows;
- Connect the previous highs and extend the lines;
- Connect the previous lows and extend the lines;
- Eventually, the Broadening Formation takes shape.
2- Using Buy-side and Sell-side Liquidity
To draw the pattern using liquidity, consider the following factors:
- Breaking previous highs in an uptrend indicates the absorption of buy-side liquidity;
- Breaking previous lows in a downtrend indicates the absorption of sell-side liquidity;
- Finally, connecting the highs and lows reveals the Broadening Formation.
Applications of the Broadening Formation in Trading
The Broadening Formation has the following applications in trading:
Identifying Suitable Entry and Exit Points
One of the most important applications of the Broadening Formation is identifying optimal entry and exit points. Typically, a trading opportunity arises when the price reaches one of the edges of the broadening range and shows signs of reversal. Buy and sell positions with Broadening Formation:
- A sell position can be considered if the price reaches the top of the pattern and shows weakness in continuing the uptrend;
- A buy position can be considered if the price reaches the bottom of the pattern and shows weakness in continuing the downtrend.
Using the Pattern in Different Timeframes
The Broadening Formation can be observed in various timeframes. For example, a smaller Broadening Formation may form in a shorter timeframe, such as the 15-minute chart, while a larger one may be created in higher timeframes, such as the hourly or daily chart. This phenomenon is known as nested patterns.
Combining the Broadening Formation with Other Trading Strategies
This pattern can be more effective when combined with other analytical methods:
Combining with SMT Divergence
If Smart Money Tool appears at the edges of the pattern, it can be used to confirm trade entries. For example, a bullish reversal can be expected if SMT indicates buyer activity at the end of a downtrend.
Combining the Power of Three
The Power of Three consists of three stages:
- Accumulation:The price consolidates within a specific range;
- Manipulation:A false breakout occurs on one side of the range;
- Distribution:The price moves in the opposite direction.
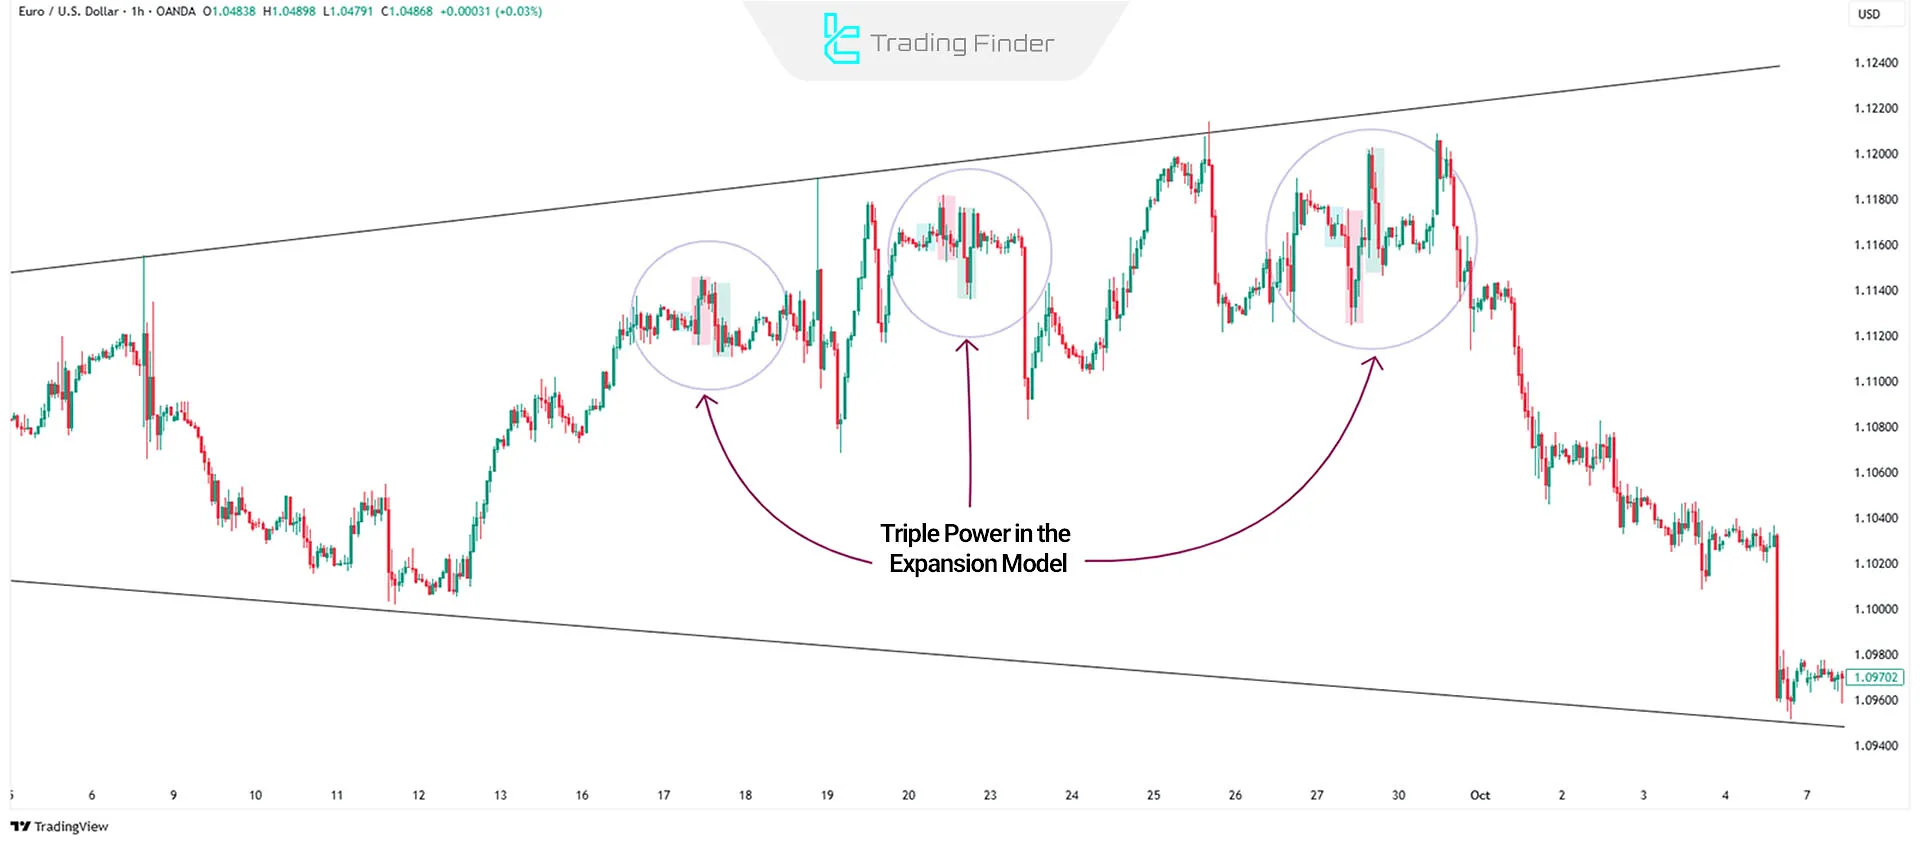
The Broadening Formation often follows these stages, so combining these methods can provide ideal entry and exit points.
Combining with Liquidity Levels and Support/Resistance
Buy side and sell side liquidity can be used to determine entry and exit points. A price correction can be expected if the price reaches a high liquidity level and shows signs of reversal. Support and resistance levels are also effective for setting price targets in the Broadening Formation.
Using the Broadening Formation in Daily Profiles
Another application of this pattern is analyzing it within the framework of daily profiles. Traders can use this pattern to predict market movements throughout the day:
- If the London session breaks the highs and lows of the Asian session, there is a high probability that the New York session will break the highs and lows of the London session;
- This trend reflects the Seek and Destroy price behavior, where the market aims to absorb liquidity on both sides.
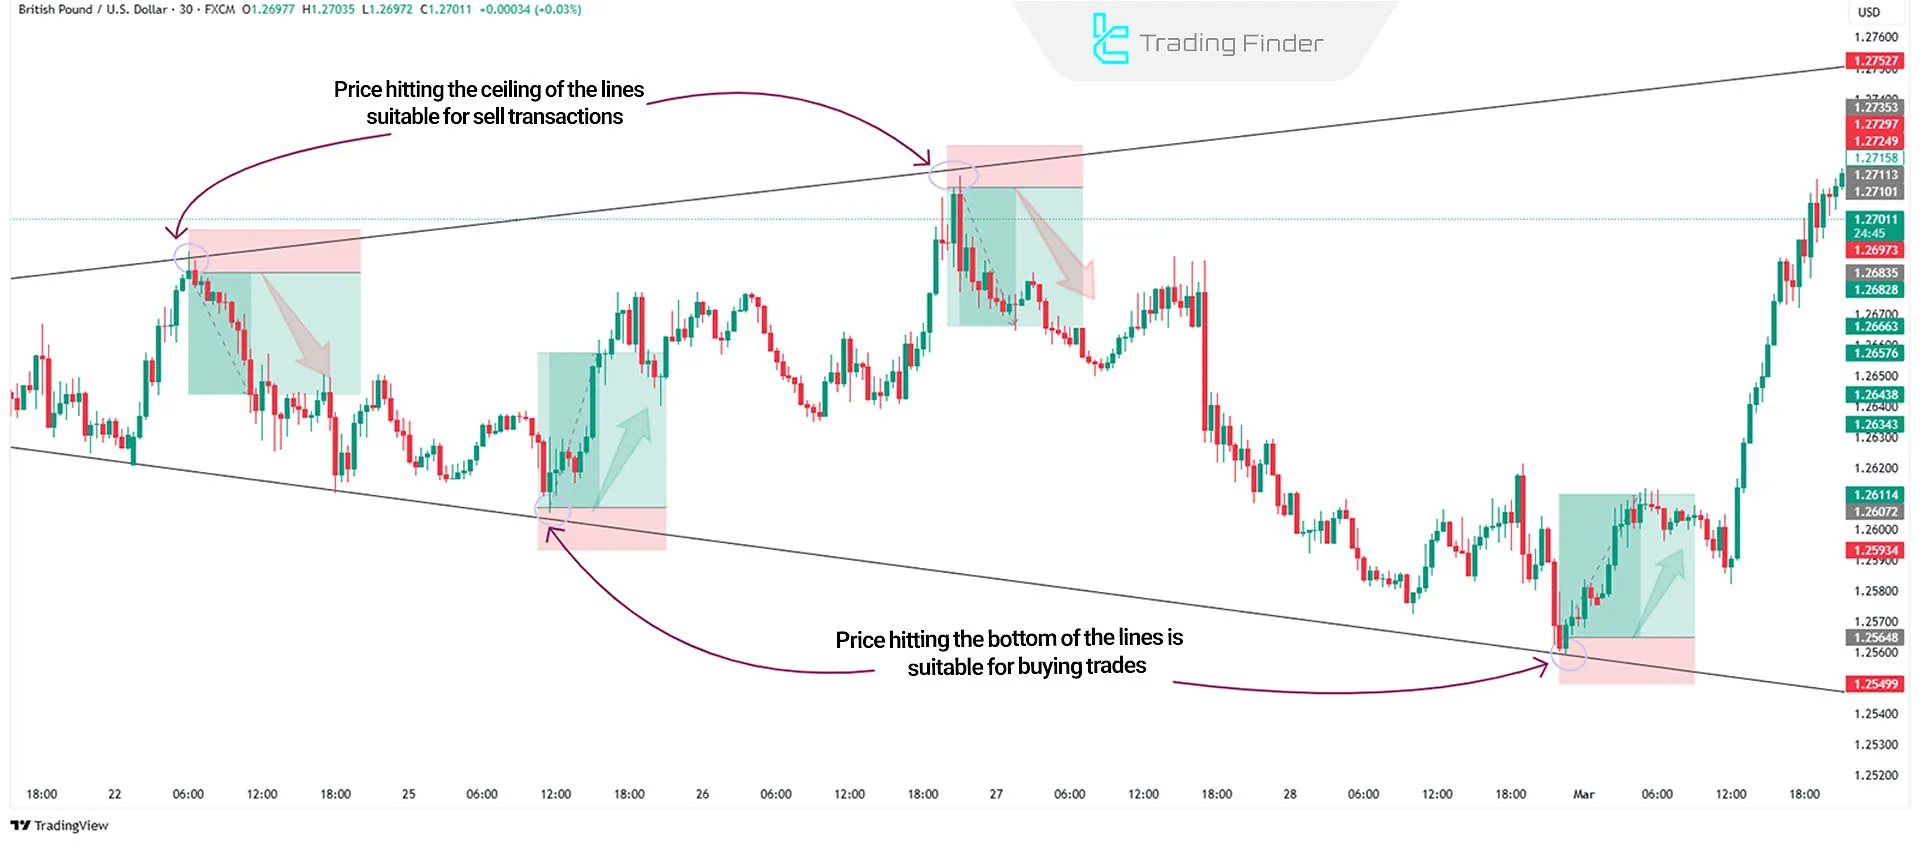
Example of Trade Using the Broadening Formation
In the 30-minute timeframe of GBP/USD chart, the price begins breaking short-term highs and lows after forming a Broadening Formation.
In this scenario, first, connect the highest and lowest prices in the pattern and extend the lines.
- A sell position can be entered when the price breaks a short-term high and touches the extended lines;
- When the price breaks a short-term low and touches the extended lines, a buy position can be entered.
Conclusion
The Broadening Formation indicates increasing volatility and expanding price movements. This pattern can be combined with methods like SMT Divergence, Power of Three, and liquidity levels.
By using this pattern across different timeframes, traders can identify entry and exit points and predict price movements within daily profiles.


