


One of the patterns derived from the ICT methodology is the Candle Range Theory (CRT), which revolves around the concept of Liquidity Sweep. This occurs when the market sweeps the liquidity above or below the previous candle's range.
In the state of price compression in ICT, a false breakout of the previous candle’s high or low is recognized as a signal and reveals the probable direction of the market.
This price behavior provides a precise framework for identifying entry and exit points in ICT-based analyses and consolidates the structure of short-term trend forecasting.
What is a Candle Range?
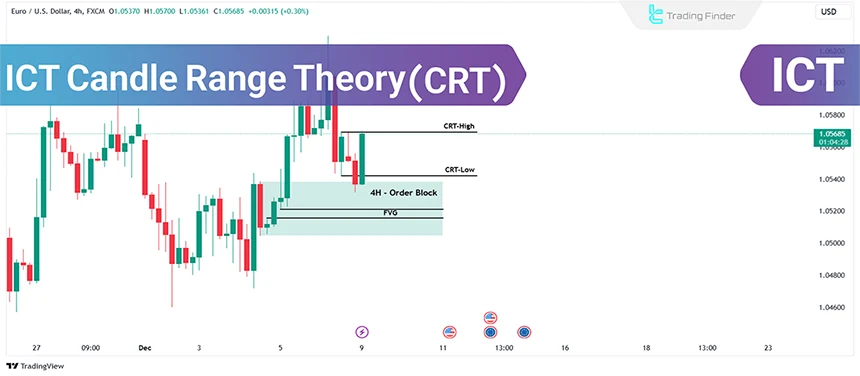
Each candlestick in a higher time frame represents a range within lower time frames. Thus, the highest price of a candle (High) marks the upper limit of a price range in a lower time frame, referred to as CRT-High; while the lowest price marks the lower limit, referred to as CRT-Low.
The structure of the body and shadows within the candle range is such that each candle consists of two main parts, the body and the shadows, both of which are highly important in CRT analysis.
- Body: Indicates the difference between the opening and closing price and shows the main direction of price movement;
- Shadows: Define the full range of price fluctuation within the selected timeframe.
The article teaching the candle range theory on the writofinance.com website has provided complementary explanations about this ICT-style strategy for interested readers.
What is the Institutional Candle in CRT?
In the candle range theory, selecting the base candle to determine CRT-High and CRT-Low shapes the direction of the analysis and creates a reliable foundation for evaluating price behavior.
This foundation becomes meaningful when it is derived from an institutional candle; a candle that records the entry of institutional liquidity and major order flow, and builds the starting point of accumulation or manipulation.
The characteristics of an institutional candle include:
- Formation in a higher timeframe;
- Heavy volume and wide range;
- Display of institutional liquidity entry;
- Beginning of changes in price behavior within the market structure.
The institutional candle stabilizes the CRT range framework and keeps price structure analysis in lower timeframes dependable. Using a weak candle disrupts the coherence of the analysis and increases the likelihood of recording a fake breakout.
In fact, determining the candle range begins with selecting an institutional candle and keeps the path of examining liquidity and market structure clear.
What is the Candle Range Theory (CRT)?
The CRT framework is based on the principle that each candle reflects a range of price movements observable in lower time frames.
The formation of this range adheres to the "Power of Three" concept, involving the Accumulation, Manipulation, and Distribution phases.
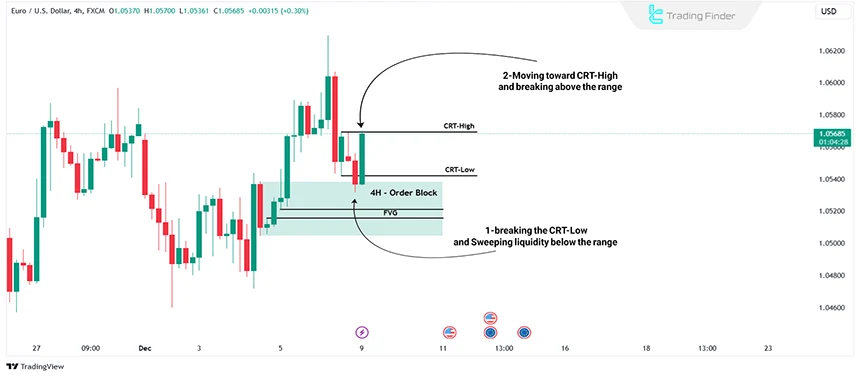
The candle range theory (CRT) in ICT style is based on sweeping the liquidity of the previous candle range and then moving toward the liquidity level.
For instance, if the price sweeps liquidity below the previous candle, it is expected to move toward the previous candle's upper range, and vice versa.
Bullish CRT Model
When the price reaches a key support level in higher time frame, a Bullish CRT can be identified by marking the High and Low of the candle closed at support. Then, wait for the next candle to sweep liquidity below and close above the previous candle.
After this phenomenon, wait for another candle to close above the one that swept the liquidity or look for an ICT market structure shift in a lower time frame. Then, execute a buy trade on the price's retracement.
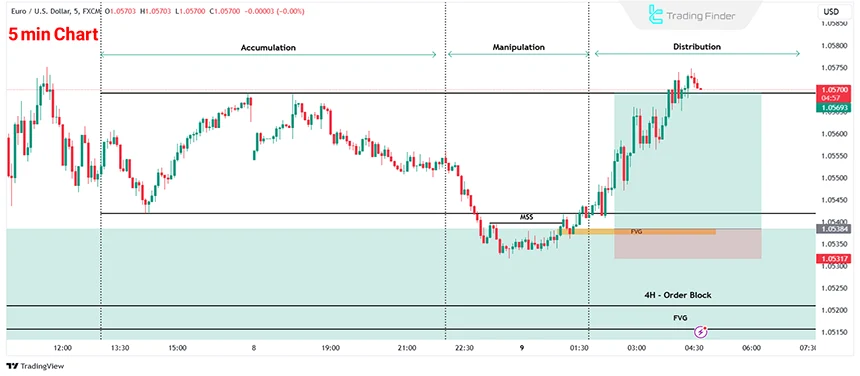
5-Minute price chart shows the stages of bullish "Power of Three" model and can be seen below.
Bearish CRT Model
Bearish CRT can be identified when the price reaches a key resistance level in a higher time frame by marking the High and Low of the candle closed at resistance. Then, wait for the next candle to sweep liquidity above andclose below the previous candle.
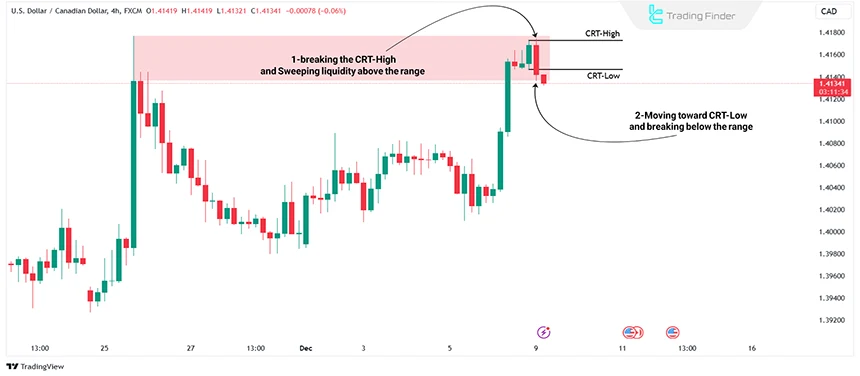
5-Minute price chart shows the stages of bearish "Power of Three" model and can be seen below.

High-Probability CRT Setups
Traders can identify key liquidity sweep zones by focusing on the Kill Zone hours. For better results, the range liquidity sweep should occur during the London session (3:00 AM to 6:00 AM New York time) or the New York session (8:30 AM to 11:30 AM).
The Asian Session typically shows low volatility and acts as an accumulation phase; While the London Session often involves price manipulation, followed by distribution during the New York Session.
Signals for Valid Liquidity Sweeps:
- Three-candle pattern where the second candle sweeps liquidity and the third candle breaks above the second candle;
- Formation should occur in less than 15 minutes for pattern identification;
- Price rejection (e.g., structure shift) after liquidity sweep, indicating institutional interest.
Example of a High-Probability CRT Setup
During the Asian session, the price of a currency pair such as EUR/USD usually moves within a low-volatility range, and this zone acts as an area of accumulation and liquidity buildup.
With the start of the London session, a bullish or bearish candle breaks out of this range and violates its high or low; this move usually reflects liquidity collection by major market flows.
After this sweep, the three-candle CRT pattern forms:
- The first candle collects liquidity;
- The second candle shows weakness in the move;
- The third candle confirms the short-term structure shift by breaking the low or high of the second candle.
This breakout is usually accompanied by the creation of an imbalance zone (FVG) and a structural dislocation, indicating the entry of institutional capital.
Subsequently, entering after the price retraces into the imbalance zone, with a stop loss behind the liquidity-grab candle and targeting the opposite side of the range, creates a trading scenario with an attractive risk-to-reward ratio.
This example shows that combining a liquidity sweep during the key London hours with the three-candle pattern and price structure change can build a powerful and high-probability setup within the candle range theory (CRT) in ICT.
Role of Killzones in Forming CRT Setups
In using the candle range theory, analyzing price behavior during the main sessions (Killzones) has a direct role in identifying the sweep and CRT path, and operates in alignment with the AMD cycle.
- Asian session (accumulation): Forming the initial CRT range and defining Asian Range highs/lows as key liquidity for later sweeps;
- London session (manipulation): Valid CRT sweep between 3:00–6:00 NY time, clearing Asian highs/lows, false breakout with quick reversal, MSS formation, and defining CRT-High or CRT-Low;
- New York session (distribution): Main move between 8:30–11:30 NY time, higher volume, price delivery to liquidity targets, and completion of distribution.
Note: The AMD cycle consists of three continuous stages in which, during Accumulation, the market collects liquidity within a limited range.
In Manipulation, by performing the sweep and fake breakout, liquidity is cleared, and in Distribution, the main move continues toward liquidity targets.
Structural comparison table of CRT and PO3 in ICT style:
Feature | CRT | PO3 |
Focus point | High and low of the higher timeframe candle (High/Low) | Entire market structure |
Manipulation phase | Sweep of CRT-High or CRT-Low | One-sided move for liquidity collection |
Entry point | After MSS or OB/FVG | After completion of accumulation and manipulation |
Target | Opposite-side liquidity or 50% CRT | Final distribution (Distribution) |
Time structure | More suitable for Killzones | Suitable for daily market behavior |
The educational video of the Trader Tips channel on YouTube provides complete explanations about the best CRT trading setup, which can also be used.
50% CRT Target as the Ideal Trading Objective
In the candle range theory, many CRT traders consider the 50% level of the range as the first safe target; a level that has a special place in institutional logic and accurately reflects the flow of liquidity.
After the initial liquidity absorption, institutional structures usually create a repetitive path and return the price to the equilibrium point; the point that defines the center of the candle range (CRT) in ICT style and forms the field of powerful market reactions.
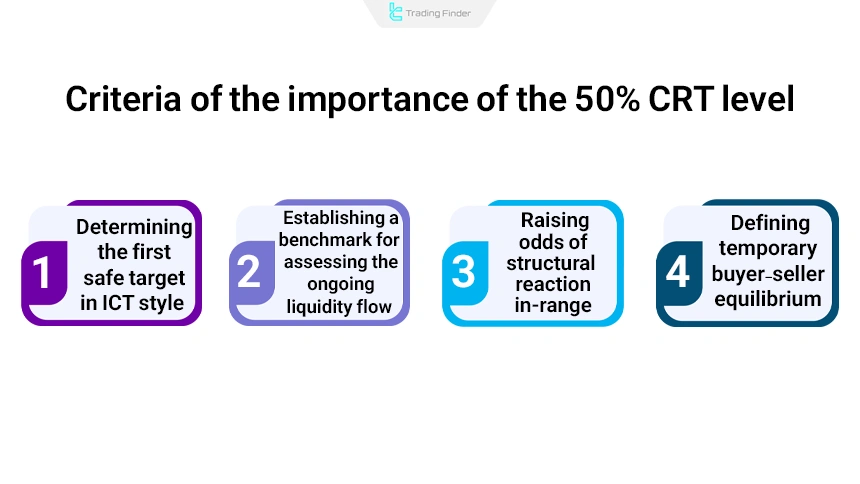
From this stage, the trend moves toward the next liquidity depending on its movement strength and completes the structure of order flow. The importance of the 50% CRT level can be summarized in the following cases:
- Defining temporary equilibrium between buyers and sellers;
- Increasing the probability of structural reaction in the heart of the range;
- Creating a reference point for evaluating the continuation of liquidity flow;
- Determining the first safe target in ICT-based trading methods.
Limitations and Common Mistakes in CRT Trading
In a trading environment based on the CRT theory, analytical precision is preserved only when this model is executed in the correct context and incorrect interpretations of liquidity structure do not deviate the analytical path.
The limitations and common mistakes of the trading strategy within the trading range are as follows:
- Using only CRT: Disregarding market structure, supply and demand zones, and key levels;
- Interpreting every sweep as a change of direction: Ignoring the fact that part of the sweeps strengthen the continuation of the current trend;
- Selecting a non-institutional candle: Analyzing the range based on a candle without sufficient range or volume;
- Viewing the structure in a single timeframe: Not examining the microstructure in a lower timeframe to identify the fake breakout;
- Prioritizing the CRT pattern over risk management: Entering without precise and standard stop placement.
Indicator of Candle Range for Metatrader
The indicator of candle range (Range of Candle) is a tool that analyzes market volatility by comparing the range of each candle relative to the previous one.
This indicator, by using colored histograms, visually shows the difference between the highs and lows of candles on the chart.
For this reason, it is considered one of the simple yet practical tools for traders of various markets, including forex, cryptocurrencies, stocks, and the forward market.
This tool is categorized among oscillators and reversal indicators of Metatrader, and usually beginner traders can easily use it as well.The indicator of candle range can be applied in multi-timeframe analysis and is compatible with trading styles such as day trading and scalping.
The core of this indicator’s performance lies in the coloring of histograms.
- Yellow histogram: Shows that the volatility range of the candle has become larger compared to the previous candle; meaning the market is experiencing increasing volatility;
- Pink histogram: Displays the decrease of the volatility range and is usually a sign of weakness in the current market movement;
- Purple histogram: Indicates the stabilization of the volatility range and equality of the range of two consecutive candles.
In an uptrend, when green candles appear continuously and simultaneously yellow histograms form one after another, it can be concluded that the volatility range is expanding.
This increase in range usually implies the strengthening of buying flow and continuation of the bullish movement.
On the other hand, if the market enters a downtrend and bearish candles form along with repetitive yellow histograms, this situation indicates the rise in volatility intensity in the direction of price decline.
Such behavior is usually accompanied by intensified selling pressure and continuation of the downward trend.
Also, in an upward movement, if pink histograms are observed between candles, it can be considered a sign of decreasing volatility range and weakness of buyers’ power.
This reduction of candle range structure may indicate the possibility of sellers’ return or a halt in continuation of the trend
In general, the indicator of candle range provides a clear picture of the expansion or contraction of market volatility by examining the difference between the High and Low of each candle relative to the previous candle.
YouTube:
Conclusion
Although CRT is not a complete trading strategy by itself, traders who grasp liquidity sweep and the Power of Three concepts can integrate these ideas into the CRT framework to systematically identify high-probability price movement setups.
This knowledge benefits traders aiming to align their strategies with major market movements while maintaining disciplined risk management.


