


In the ICT Style, a proper understanding of market structure shifts is highly important, as these changes often mark the beginning of major price movements and precise trading opportunities.
When a CHOCH appears on the chart, it signals the end of a trend and the potential start of a new one.
In this situation, the break of a key area and the formation of an opposite high or low serve as the first indication of liquidity flow displacement.
Following a CHOCH, the MSS (Market Structure Shift) usually emerges, providing confirmation of the short-term change in market direction.
At this stage, professional ICT traders examine liquidity levels, FVG (Fair Value Gaps), and Order Blocks to seek preciseentry opportunities aligned with the newly formed trend, aiming to capitalize strategically on themarket’s character change.
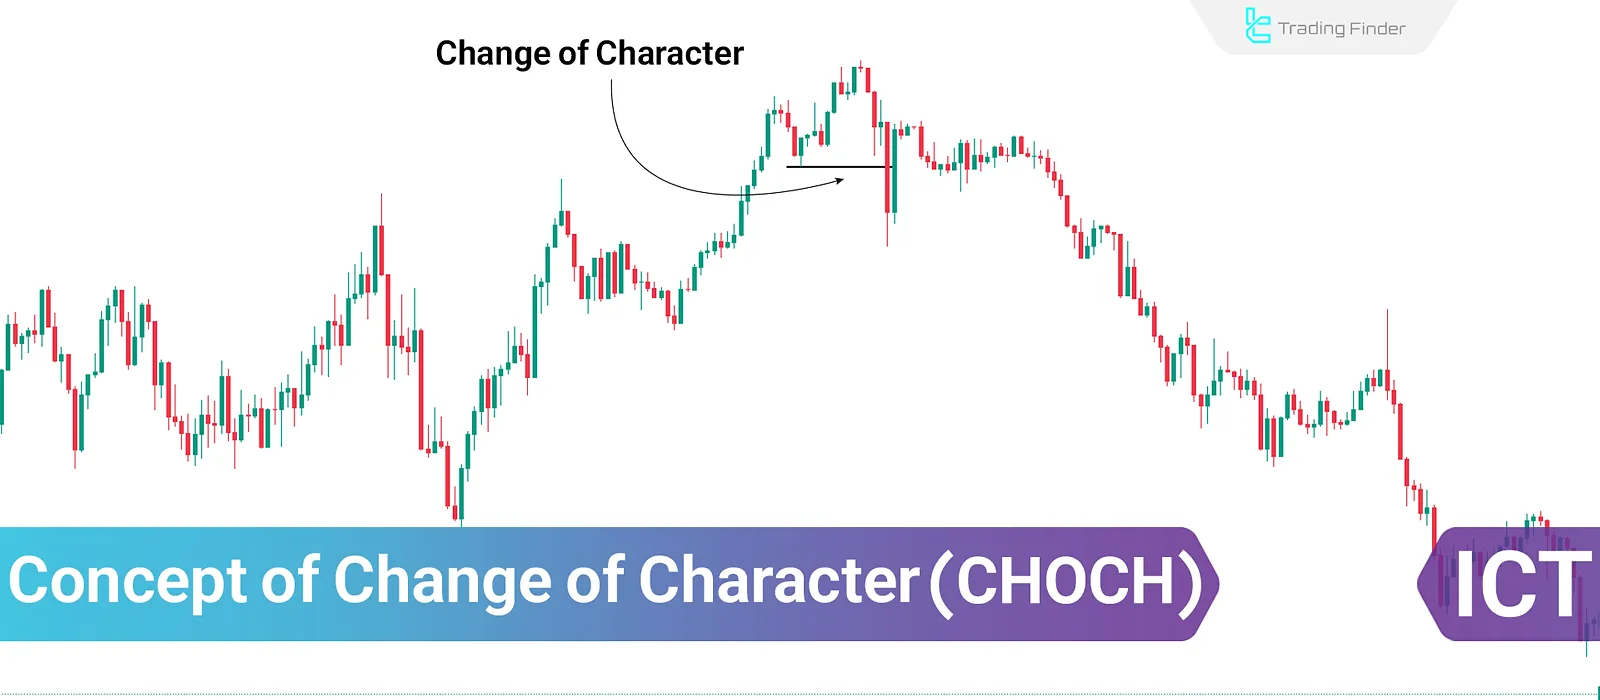
What Is CHOCH in ICT Trading?
The concept of CHOCH in trading often emerges with Smart Money entering the market, resulting in a significant reversal in trend direction.
Change of Character (CHOCH) refers to when the market shifts from a defined trend (bullish or bearish) to a different one. This transition usually reflects a change in market sentiment and trader behavior.
According to the CHoCH tutorial article on the FXOpen website, a Change of Character in the market is one of the signals of an overall trend reversal.

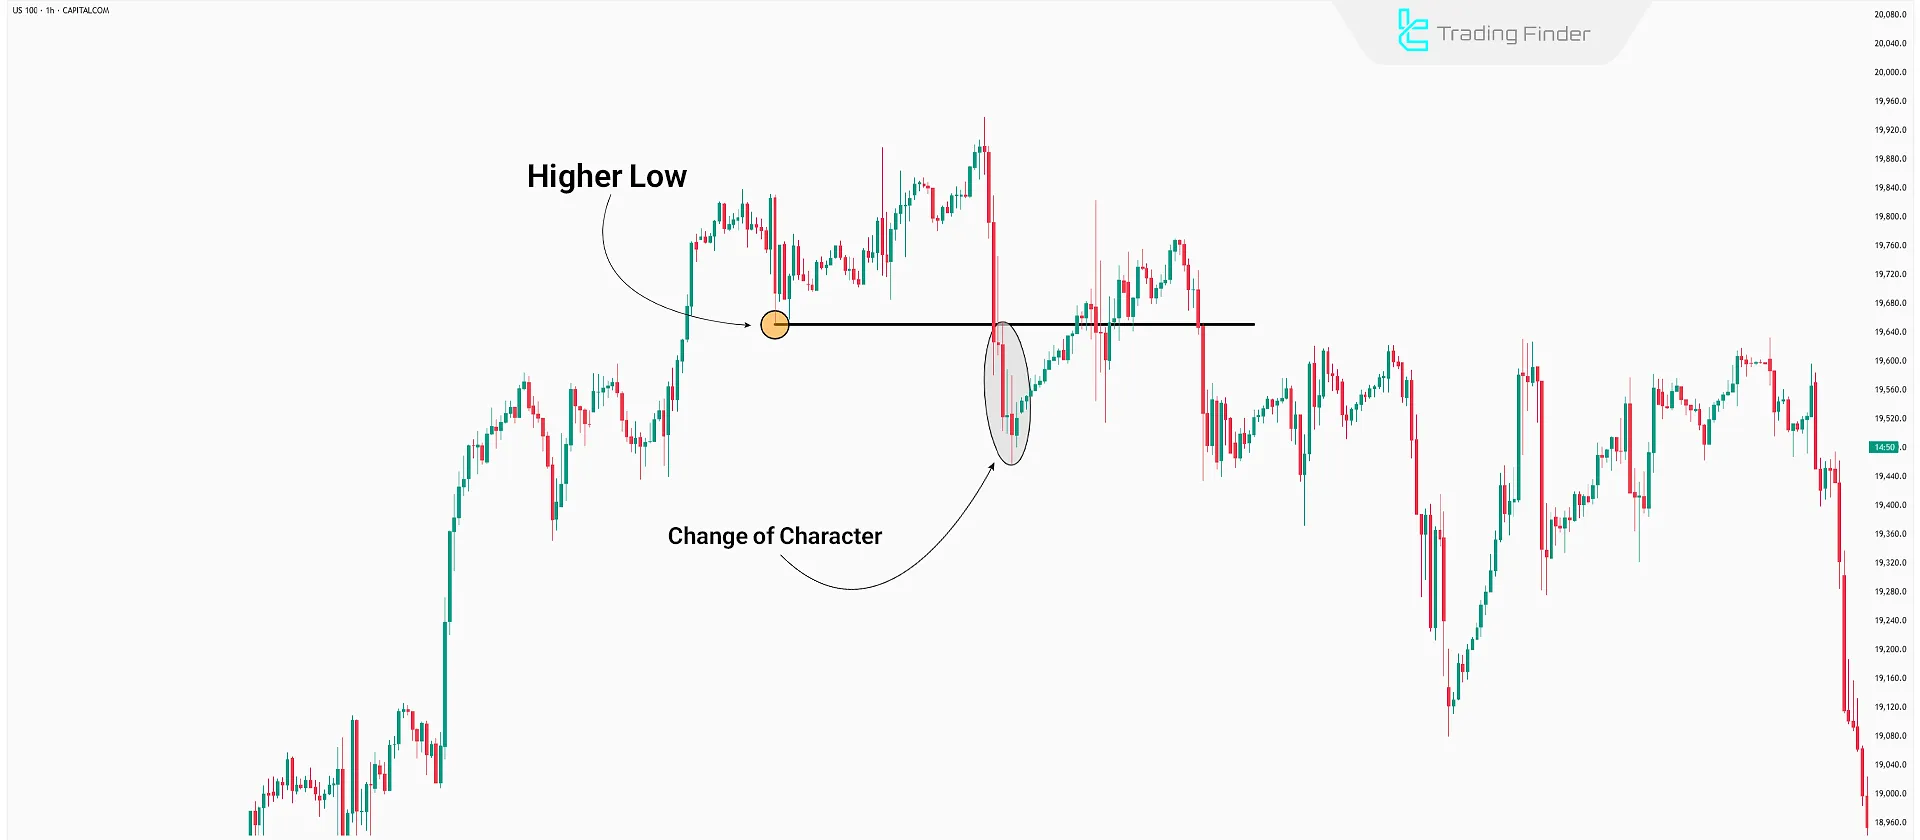
Practical Example of Change of Character (CHOCH)
In the ICT strategy, the concept of Change of Character (CHOCH) is recognized as the first signal of liquidity shift and the transfer of power between buyers and sellers.
When a key high or low in the market structure is broken in the opposite direction of the trend, the trader realizes that the previous order of the market is changing.
This indicates the beginning of a Market Structure Shift (MSS), which is considered a core component of many ICT setups.
The concept of CHoCH is taught through a video on the Smart Risk YouTube channel.
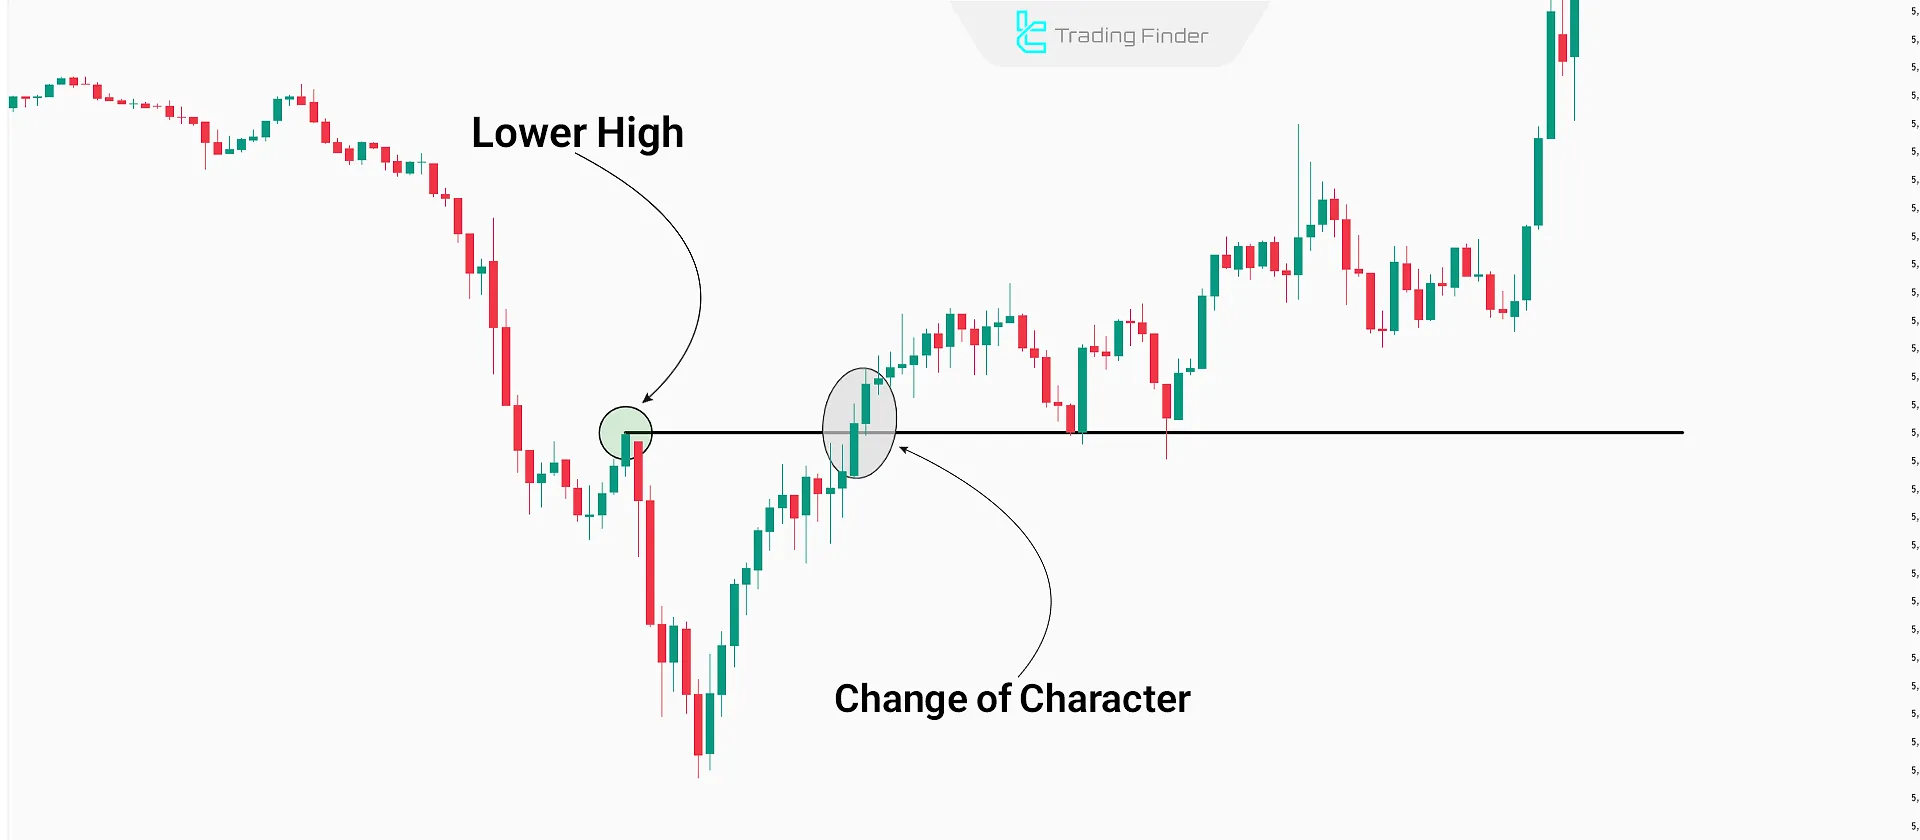
Bearish CHOCH
In a bullish trend, a CHOCH in trading occurs when the market shifts from forming HH & HL to LL & LH. This suggests that buyers have lost strength, and sellers are gaining control.
For example, if the price fails to make a new high and then drops below the previous low in an uptrend, a bearish CHOCH is likely underway. This point is usually accompanied by rising volume and a break of a key support level.
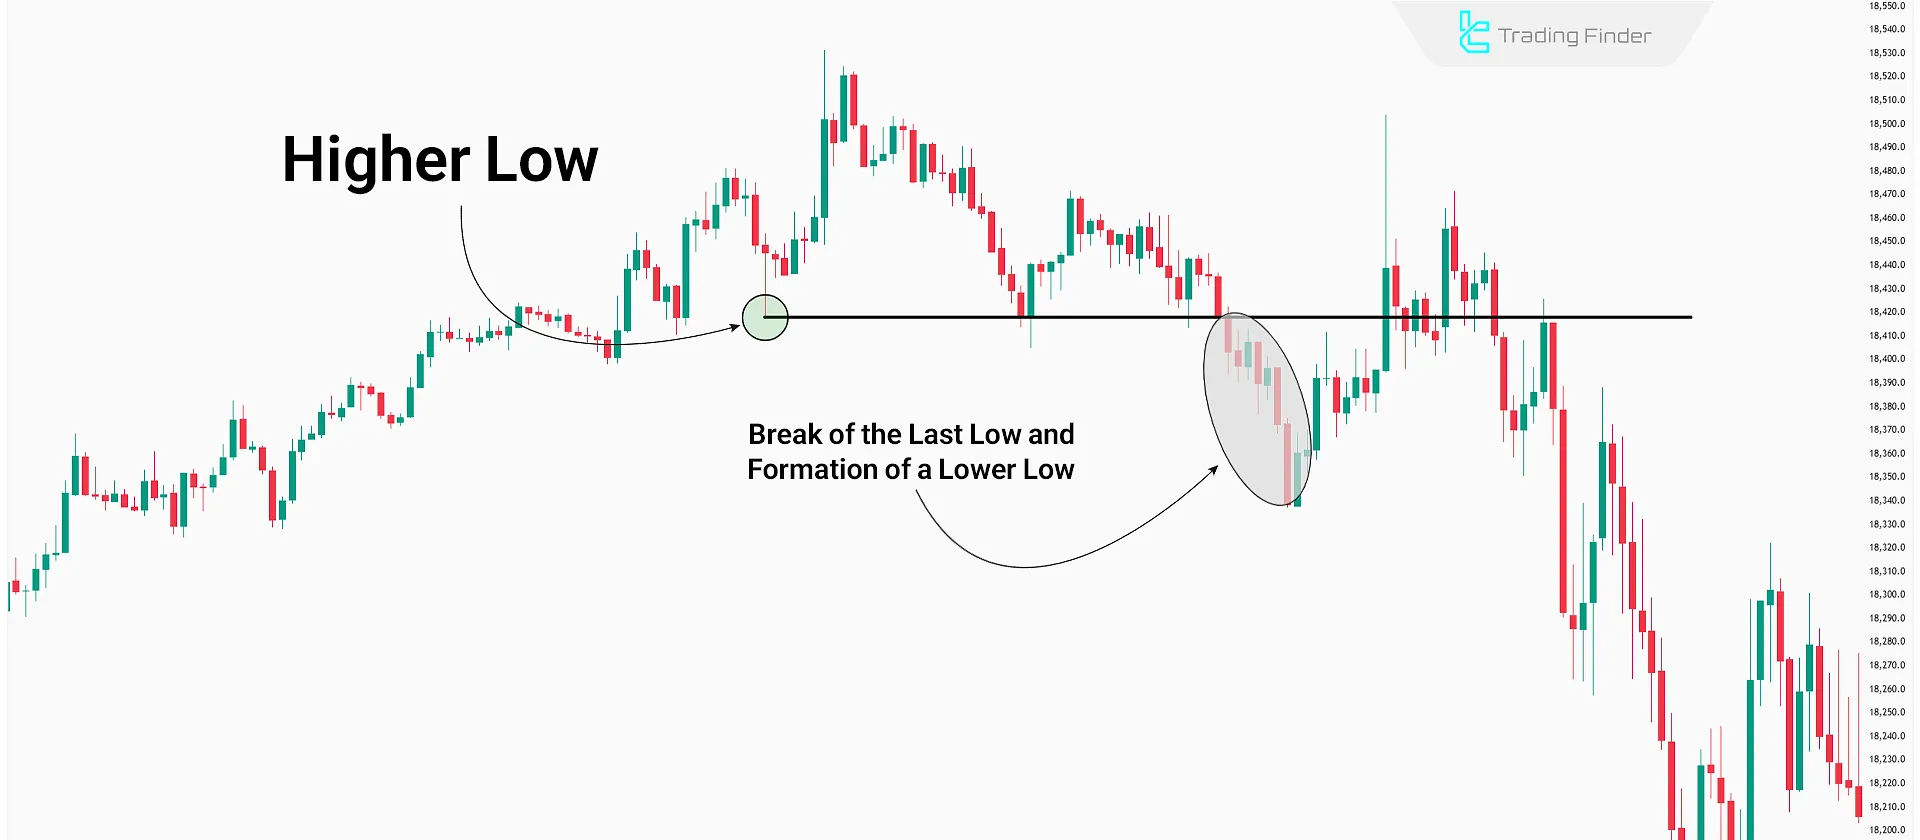
Bullish CHOCH
In a bearish trend, a ICT CHOCH forms when the price transitions from LL & LH to HH & HL. This indicates a weakening of selling pressure and emerging buyer dominance.
A bullish CHOCH is often confirmed by the break of a major resistance level, increased volume, and a return to order block zones.
For instance, when the price transitions from forming higher highs and lower lows (HH & HL) to forming Lower Lows and lower Highs (LL & LH), it signals the appearance of a bearish CHOCH.
This concept is vital for identifying the end of the current trend and the beginning of a new one. A CHOCH goes beyond a mere structural shift it reflects significant psychological changes in buyers, sellers, and overall market sentiment.
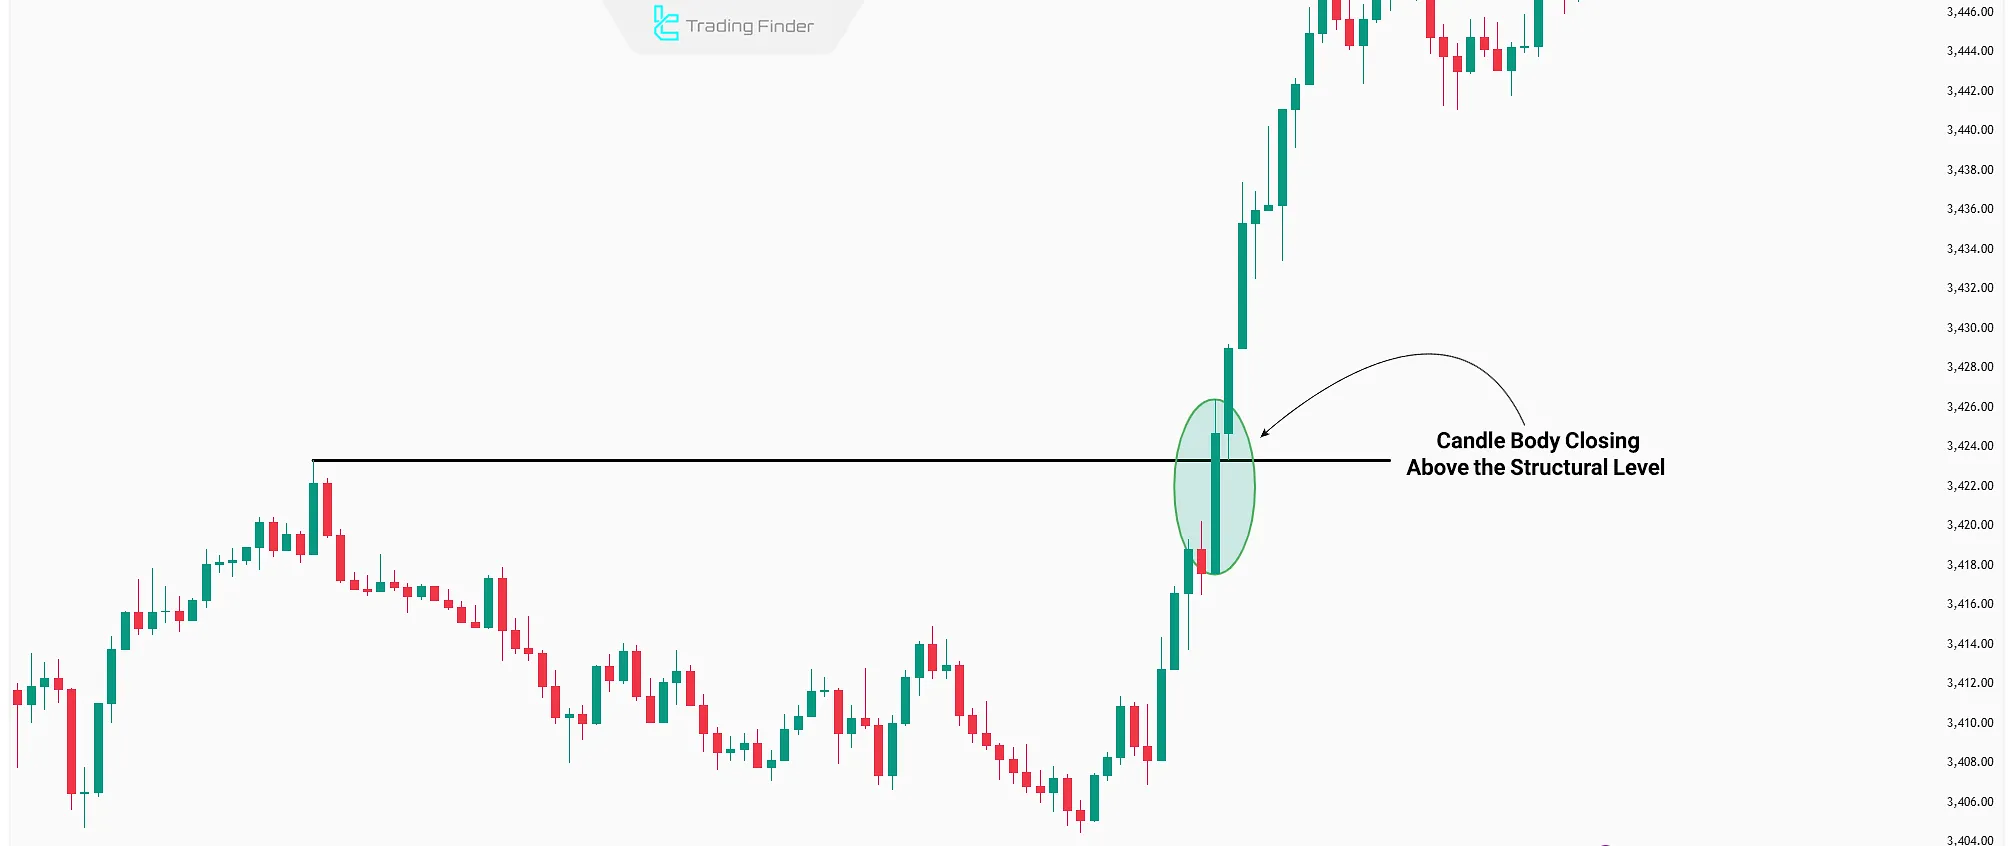
Valid Break in CHOCH: Candle Close or Wick?
In the analysis of Change of Character (CHOCH) , one of the most important factors is identifying a valid break.
Many traders ignore the distinction between candle close and wick; however, to confirm a Bullish CHOCH or Bearish CHOCH, the candle body closing above or below the structural level carries more weight than the wicks.
If one relies solely on the wick, the likelihood of a false break or Stop Hunt increases.
Therefore, the suggested rule is to always consider the break valid only if it occurs with a candle close, while treating wicks merely as signs of liquidity or Liquidity Grab.
This approach improves the win rate of trades based on Market Structure Shift (MSS) and BOS/BMS.
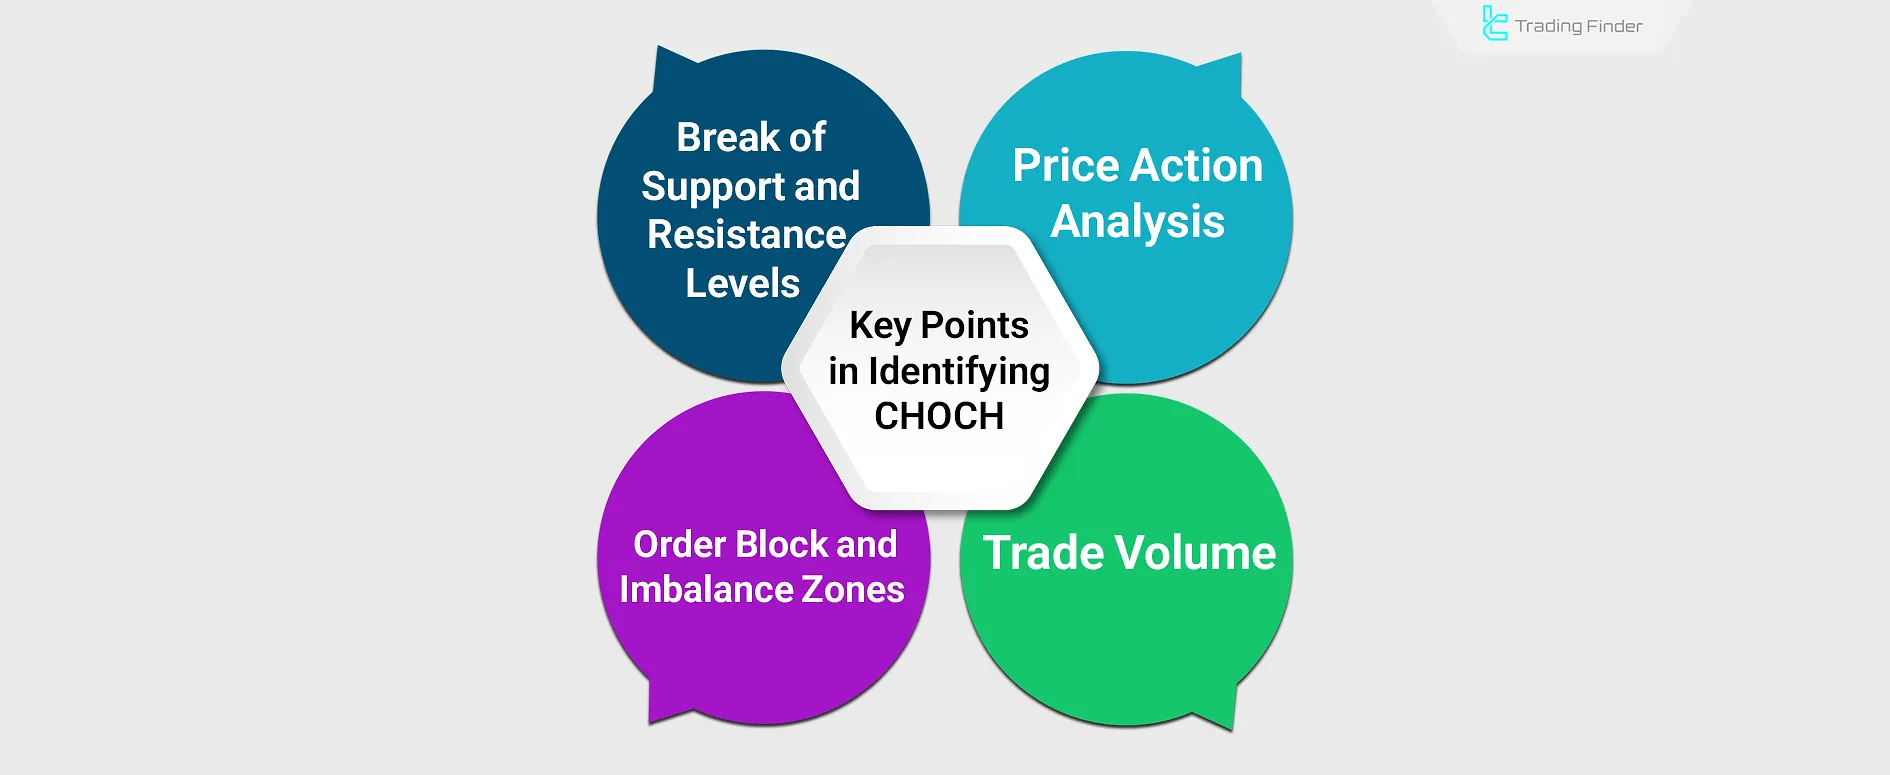
Key Points in Accurately Identifying Change of Character (CHOCH)
Reviewing different aspects such as price action, support and resistance levels, and other structural elements helps in better understanding CHOCH.
Key points in identifying Change of Character (CHOCH):
- Price Action Analysis: Evaluating higher highs and higher lows (HH/HL) or lower lows and lower highs (LL/LH) to detect changes in the trend structure;
- Break of Support and Resistance Levels: Price moving through these levels is usually the first sign of Market Character Change;
- Trading Volume: A significant increase or decrease in volume acts as confirmation for the formation of CHOCH in ICT trading;
- Order Block and Imbalance Zones: These areas are where Smart Money enters and exits, and are often accompanied by a shift in character.
Difference Between Change of Character (CHOCH) and Break of Structure (BOS)
Break of Structure (BOS) in the market merely represents the break of a high or low in the trend’s direction and does not necessarily indicate a trend reversal.
However, Understanding Change of Character (CHOCH) reflects a shift in the overall market sentiment and a liquidity shift between buyers and sellers.
CHOCH vs BOS Comparison Table:
Feature | Change of Character (CHOCH) | Break of Structure (BOS) |
Definition | A complete shift in market sentiment and transfer of power between buyers and sellers | Breaking of a high or low in continuation of the current trend |
Position in Market Structure | Usually occurs at the beginning of a trend reversal (major turning point) | Forms in the direction of the ongoing trend and confirms trend continuation |
Signal Validity | Indicates a trend reversal and the start of a new market phase | Merely confirms trend continuation; does not necessarily indicate reversal |
Trading Application | Used to identify the end of a trend and entry into a new one | Used to ensure the continuation of the existing trend |
Pros and Cons of Using CHOCH in Trading
CHOCH in ICT is primarily used to analyze long-term market structure. Below is a table outlining the key advantages and disadvantages of using this concept:
Cons | Pros |
Possibility of false signals in ranging markets | Early detection of trend reversals |
Requires experience and practice for accurate identification | Applicable in all markets and timeframes |
Higher risk in lower timeframes due to noise | Improved risk management and reduction of unnecessary losses |
Needs confirmation with other tools | Highly compatible with other ICT concepts |
Long formation duration | Helps identify optimal entry points in the new trend |
How to Identify CHOCH in Trading?
The first step to identifying a CHOCH in trading is understanding the overall market structure and its price movement phases.
Markets typically rotate through accumulation, uptrend, distribution, and downtrend, and CHOCH usually occurs at transitional points between these phases.
Key factors for detecting CHOCH include:
- Price behavior analysis: Identifying swing highs/lows and monitoring their changes;
- Support and resistance zones: Their break often signals a structural change;
- Volume analysis: Significant shifts in volume may confirm a CHOCH;
- Imbalance zones and Order Blocks: These areas often mark major entries/exits of significant capital and can act as signs of CHOCH.
Tips to Better Recognize CHOCH
For accurate CHOCH detection, consider the following:
- Apply Top-Down Analysis
- Analyze volume behavior during CHOCH formation
- Examine price action at support and resistance zones
- Use complementary tools such as indicators
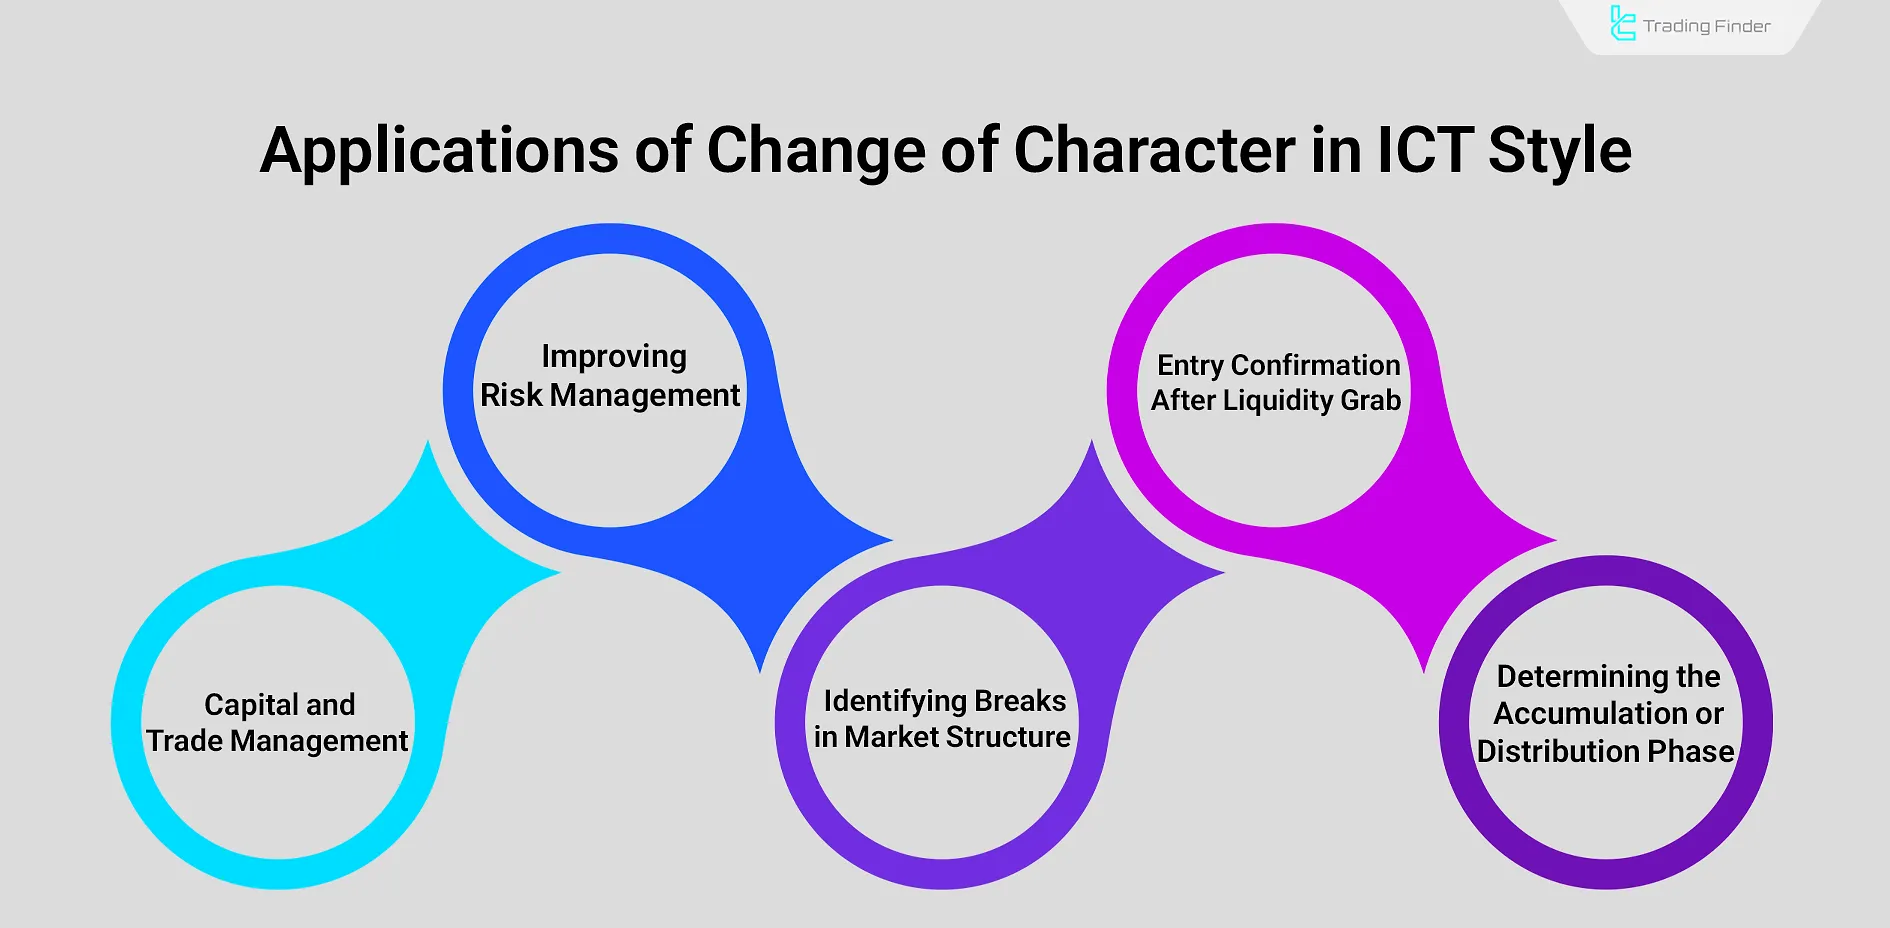
Application of Change of Character (CHOCH) in ICT Strategy
In ICT, Change of Character (CHOCH) is not merely a technical break, but a representation of Smart Money entering the market and the beginning of a new liquidity flow phase.
Therefore, CHOCH in ICT Strategy is one of the primary signals for detecting liquidity shift and the transfer of power between buyers and sellers.
Professional traders use CHOCH for the following purposes:
- Identifying the end of accumulation or distribution phases (Accumulation/Distribution): When the market shows its first valid CHOCH after a ranging period, it signals the beginning of a new trend;
- Confirming entry after a Liquidity Grab: In many ICT setups, the market first collects liquidity through a false move (Stop Hunt) and then reveals the main direction with CHOCH;
- Recognizing Market Structure Shift (MSS): CHOCH is often the first indication of a structural change in the broader market, warning traders to rewrite their trading scenarios;
- Enhancing Risk Management: Observing CHOCH allows traders to optimize their stop-loss placement and consider potential reversal trades;
- Capital and Trade Management: After a CHOCH forms and signals a possible change in direction, traders can adjust position sizing or exit early.
Major and Minor CHOCH
Not all Market Character Changes (CHOCH) carry the same weight. In ICT and SMC concepts, two categories are used: Major CHOCH and Minor CHOCH.
A Major CHOCH usually appears in higher timeframes (such as 4H or Daily) with a strong displacement move and is often aligned with an Order Block (OB) or a Fair Value Gap (FVG).
In contrast, a Minor CHOCH is more commonly observed in lower timeframes like 15M or 5M and plays the role of fractal signals.
Accurately distinguishing between these two types allows traders to separate small market noise from real structural changes.
This leads to better use of tools such as the CHOCH indicator or volume-based filters for confirming the trend.
Comparison Table of Major CHOCH vs Minor CHOCH:
Feature | Major CHOCH | Minor CHOCH |
Common Timeframes | Higher; 4H, Daily | Lower; 15M, 5M |
Nature of Move | Strong and decisive Displacement | Short-term, fractal changes |
Analytical Importance | Shows fundamental change in market structure | Temporary signal for entry or trend filter |
Relation with ICT Levels | Often aligned with Order Block (OB) and Fair Value Gap (FVG) | Less overlap with OB and FVG |
Role in Trading | Identifies end of a trend and start of a new one | Acts as a filter and identifies short corrections |
Risk of False Signal | Lower, since based on higher timeframes | Higher, due to noise and short-term movements |
Application of CHOCH in Scalping
One of the most popular fields for using Change of Character (CHOCH) is scalping on very low timeframes such as 1M to 5M.
In this case, after detecting a Bearish CHOCH or Bullish CHOCH, the trader immediately enters a position to capture fast price movements.
However, in such timeframes, noise is extremely high, and the chance of false signals increases significantly.
To reduce this risk, traders are advised to use filters such as the Volume Profile , OBV, or even higher-timeframe FVG. This way, the scalper can capture only valid changes and avoid entering trades against the main trend.
Best Timeframe to Identify CHOCH
A Top-Down analysis approach is used to detect CHOCH in trading. The approach starts from a higher timeframe (4H, 1H, or 30M) to determine the trend direction.
- First, the trend and its swing highs/lows are identified on higher timeframes;
- Then, swing structures are validated in mid-level timeframes (1H or 30M);
- Finally, the break of structure is confirmed in lower timeframes (30M or 15M), depending on the trend direction.
CHOCH + FVG Trading Setup
The CHOCH concept is compatible with other ICT concepts. Combining it with Fair Value Gaps (FVG) creates a high-probability trading setup.
Steps to trade with CHOCH + FVG:
- Identify CHOCH in a higher timeframe (4H, 1H, or 30M);
CHOCH formation on 1H NASDAQ chart - Spot the FVG in a lower timeframe (30M or 15M);
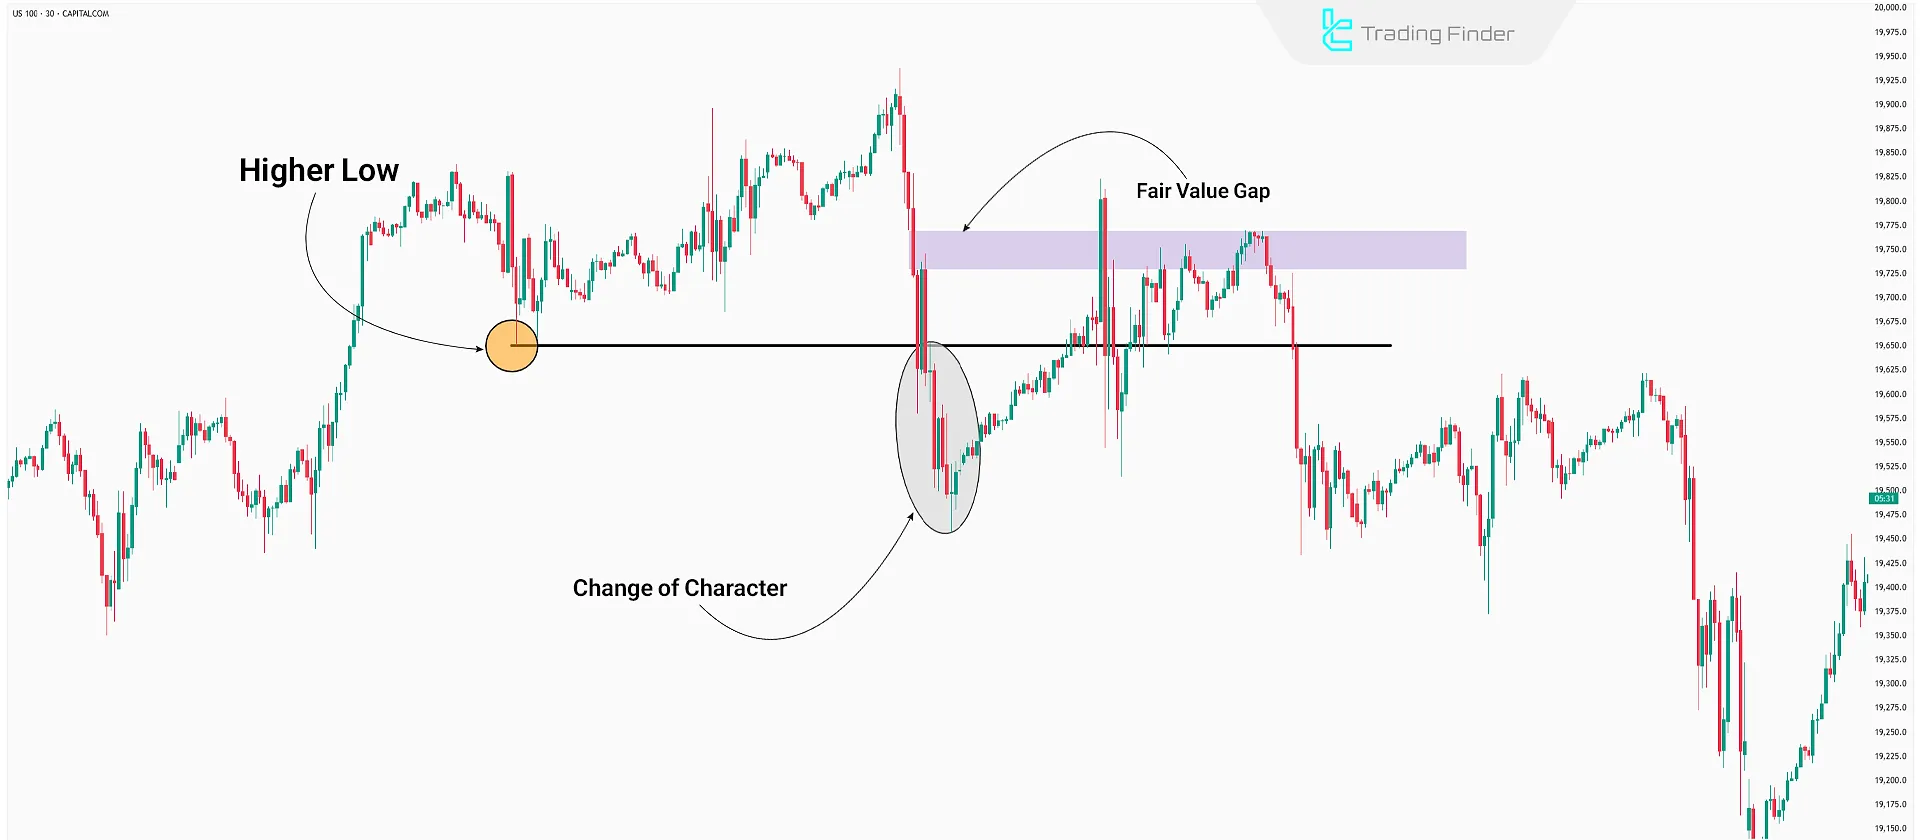
FVG detection on 30M chart - The 50% zone of the FVG provides a precise entry point;
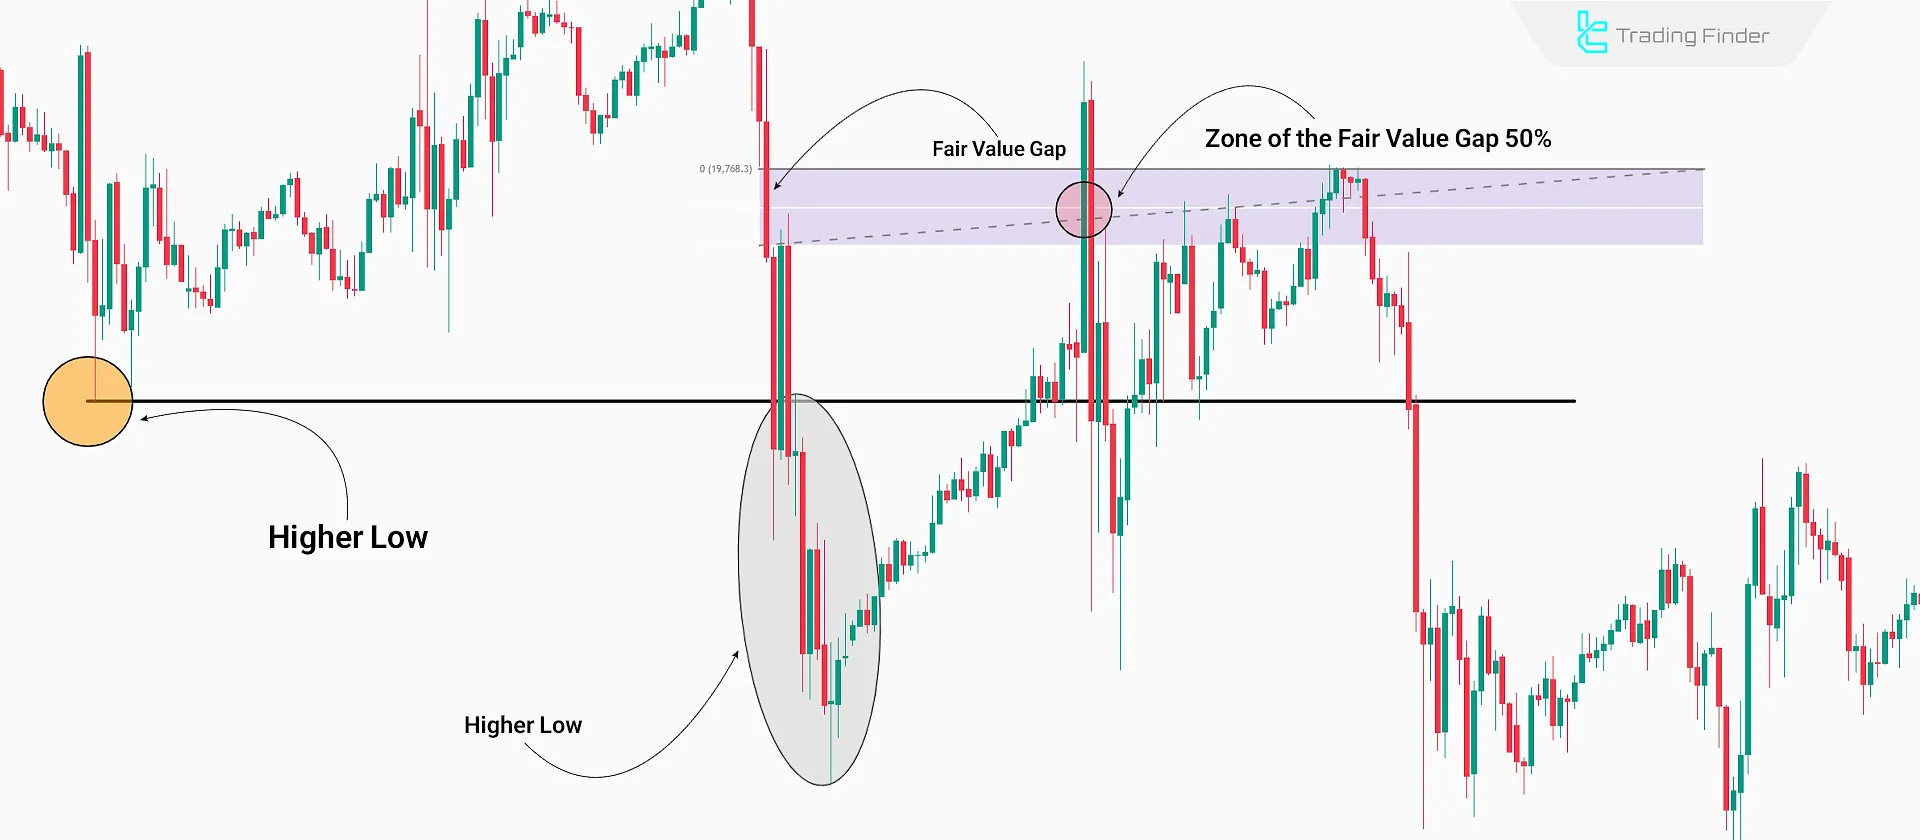
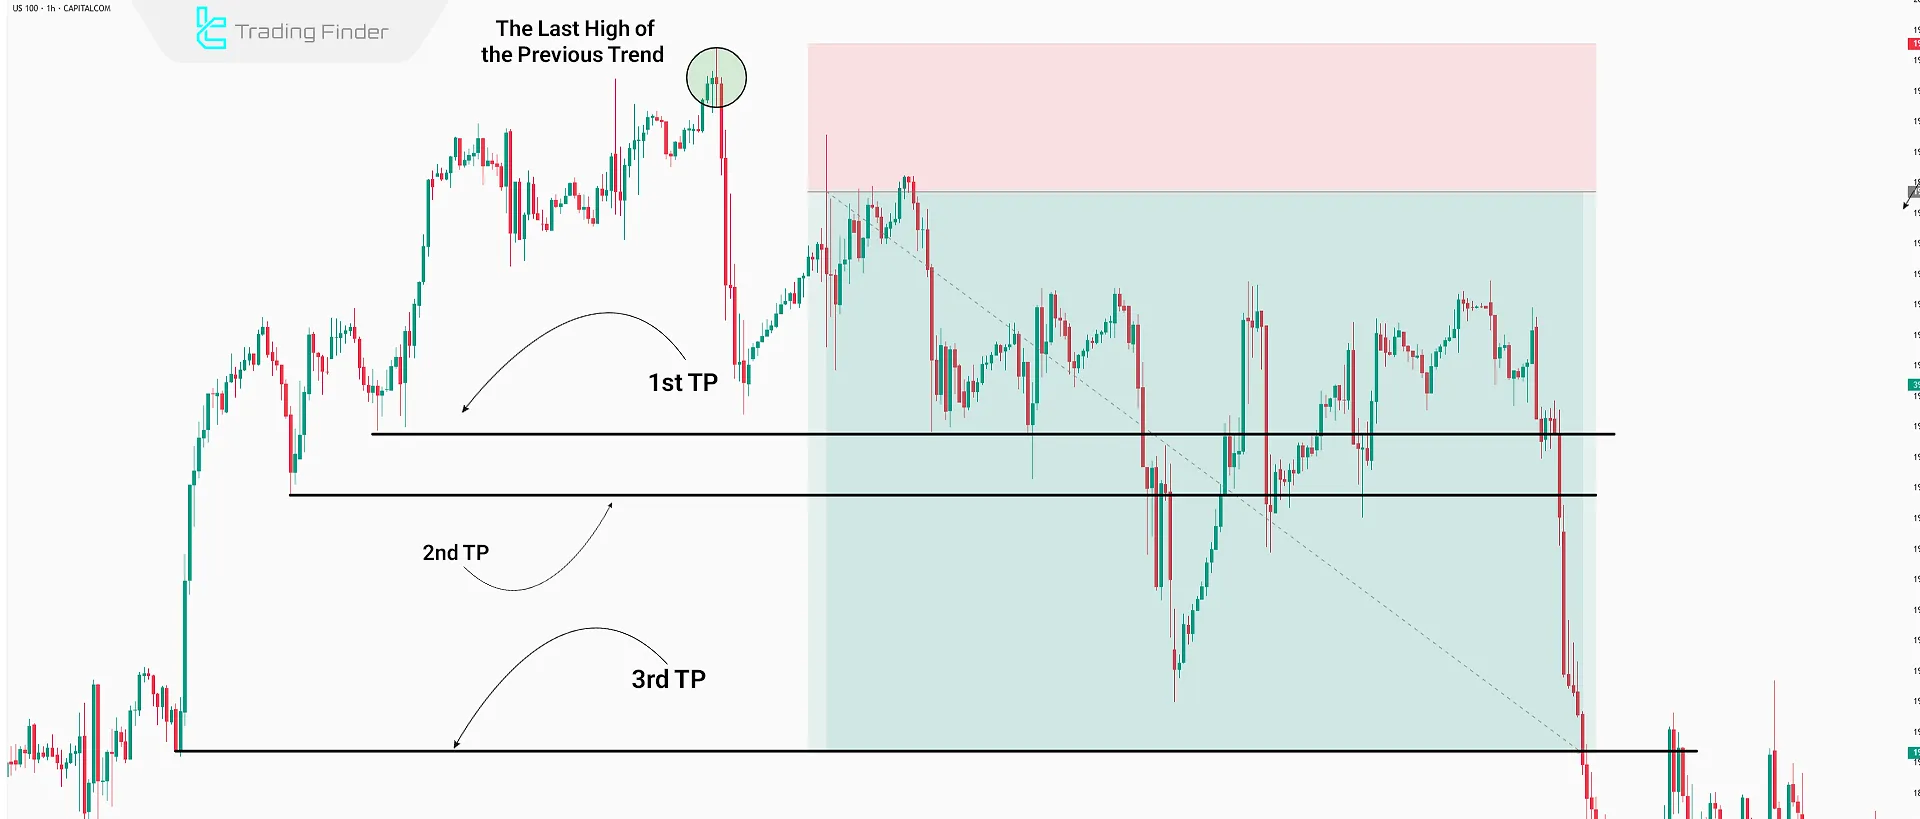
Entry point identified at the 50% mark of the FVG - Previous swing lows act as support zones and serve as profit targets;
- Stop-Loss can be Placed above the last high of the previous trend.
Application of CHOCH in Cryptocurrency
Understanding CHOCH in the crypto market cannot be limited to simply spotting a break of a price level.
Due to the fast pace and deep liquidity in Bitcoin and Ethereum, this concept is often combined with more complex patterns such as Stop Hunts and Liquidity Grabs.
To clarify this further, consider the following focal points:
- Structural Breaks in Trends: In crypto, CHOCH often comes along with Stop Hunts or Liquidity Grabs;
- Character Change in Key Zones: Detecting aBullish CHOCH in accumulation zones or a Bearish CHOCH in distribution zones is a strong signal of trend reversal;
- Combination with ICT Concepts: Professional traders apply CHOCH together with Order Blocks , Fair Value Gaps (FVG) , and concepts such as BOS/BMS/MSS to refine entry and exit points.
Trade Management in Pure CHOCH
Many traders only enter trades when Change of Character (CHOCH) aligns with a Fair Value Gap (FVG) or an Order Block (OB). However, using Pure CHOCH alone can also be effective.
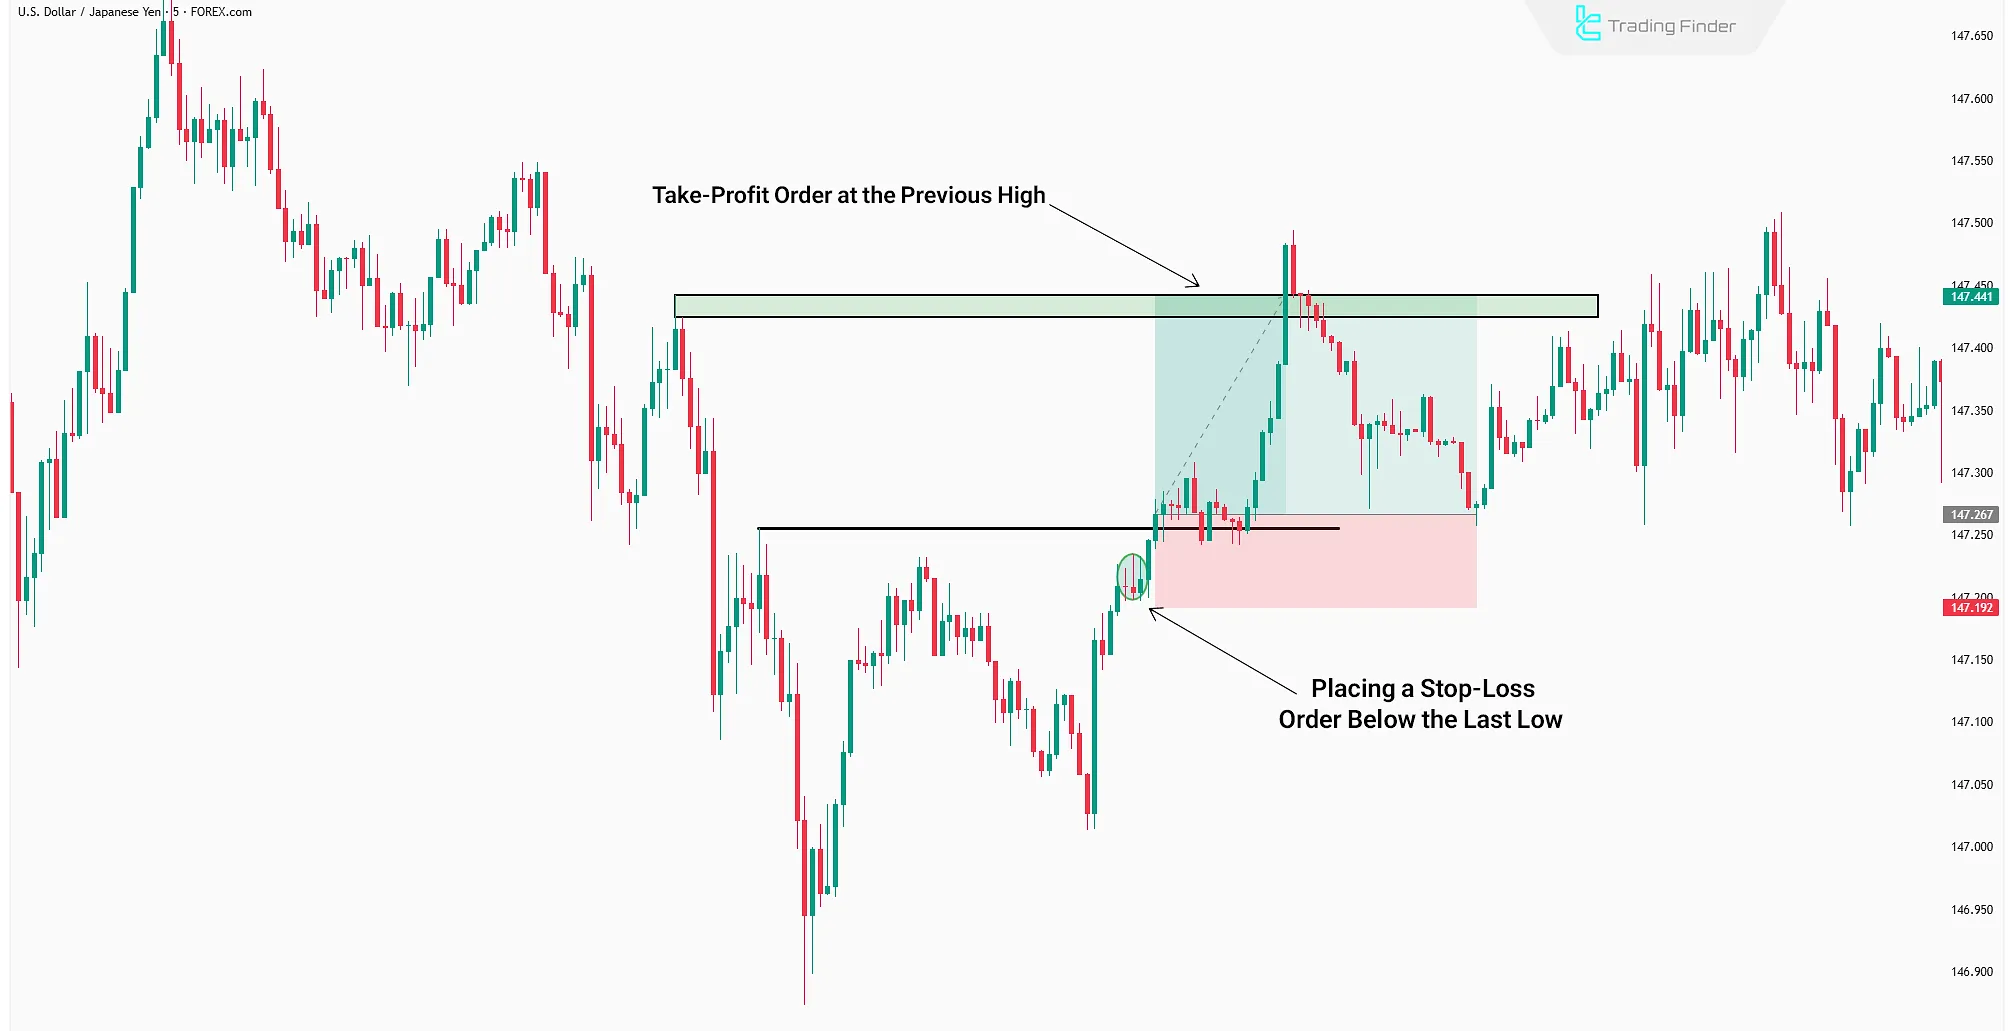
In this case, the stop-loss is usually placed behind the last Swing Low or Swing High prior to the break, while the take-profit is set at liquidity areas or the next structural levels.
For example, after a Bullish CHOCH, the stop-loss can be placed below the last Lower Low (LL) and the take-profit at the previous Higher High (HH).
This style of trade management creates a favorable risk-to-reward ratio, even without combining CHOCH with other tools. Of course, applying proper risk management and controlling position size is essential in this approach.
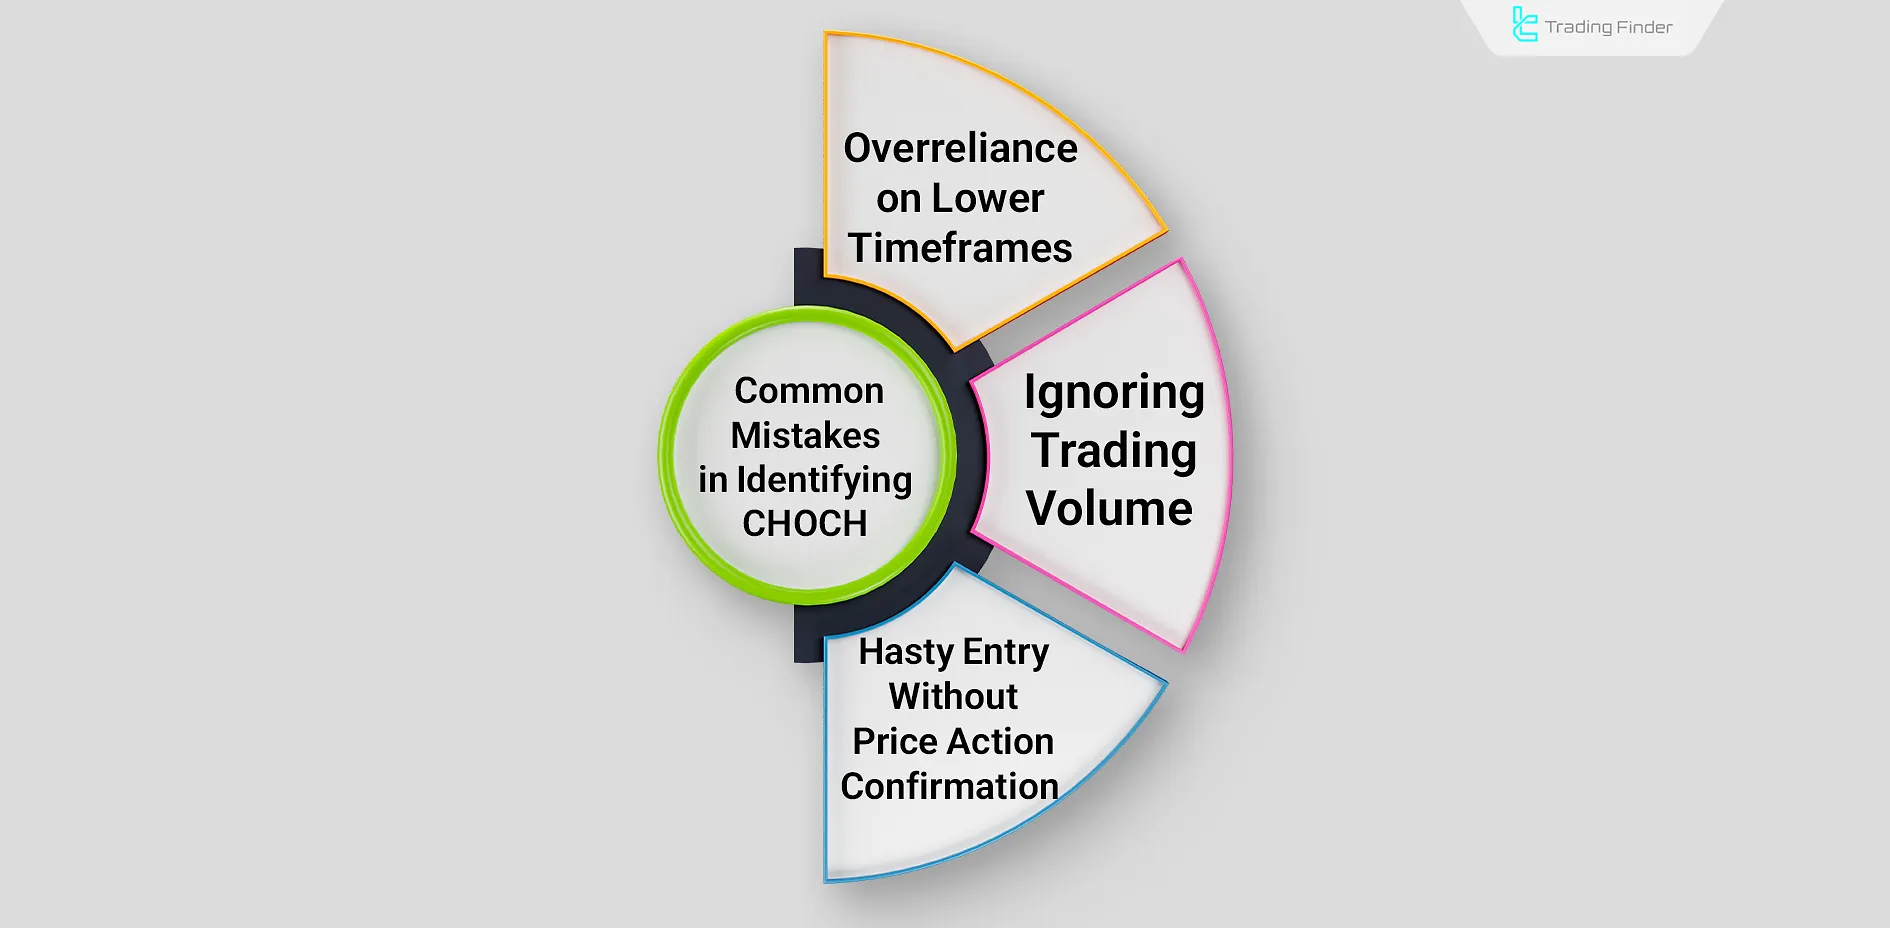
Common Mistakes in Identifying Change of Character (CHOCH)
Several issues such as not using higher timeframes, analyzing without checking trading volume, and similar mistakes can lead to CHOCH in ICT trading being identified with low reliability. As a result, trades based on it may end in losses.
- Overreliance on lower timeframes: Without considering the trend in higher timeframes, signals are often false;
- Ignoring trading volume: Analyzing purely based on price charts without volume reduces the credibility of the pattern;
- Entering hastily without price action or Order Block confirmation: This increases risk and leads to more invalid signals.
BOS-CHOCH with Label Indicator
The BOS-CHOCH with Label indicator is a specialized tool designed for ICT and Smart Money Concepts (SMC) traders.
It automatically detects Break of Structure (BOS) and Change of Character (CHOCH) , marking them directly on the chart with labels for clear visualization.
This allows traders to gain a deeper understanding of market structure and identify trend reversals in real time.
A BOS occurs when price breaks a previous high or low and establishes a new level. If that key level is broken again in the opposite direction, a CHOCH is confirmed, signaling a shift in market direction.
The indicator highlights these moves with turquoise blue and red colors, making structural changes visually easy to track.
This tool is suitable across multiple markets including Forex, cryptocurrencies, and indices , and it supports various trading styles such as scalping , day trading , and multi - timeframe analysis.
For instance, on a 5-minute AUD / JPY chart or a 1-hour US30 chart, BOS and CHOCH levels are plotted precisely, giving traders reliable references for decision-making.
The indicator settings include options to select theme mode (light, dark, auto) , define the number of candles for calculation, choose trend calculation via ZigZag Candle, and enable or disable BOS/CHOCH labels.
- BOS-CHOCH with Label Indicator (ICT) for MT 5 Download
- BOS-CHOCH with Label Indicator (ICT) for MT4 Download
Conclusion
CHOCH in ICT occurs at the end of trends due to weakening buyer strength. After CHOCH forms, the trend structure transitions from bullish to bearish or vice versa.
Accurately identifying CHOCH requires thorough market structure and liquidity behavior analysis.
A well-detected CHOCH often marks a significant trend reversal and presents a high-quality entry point for profitable trades.


