


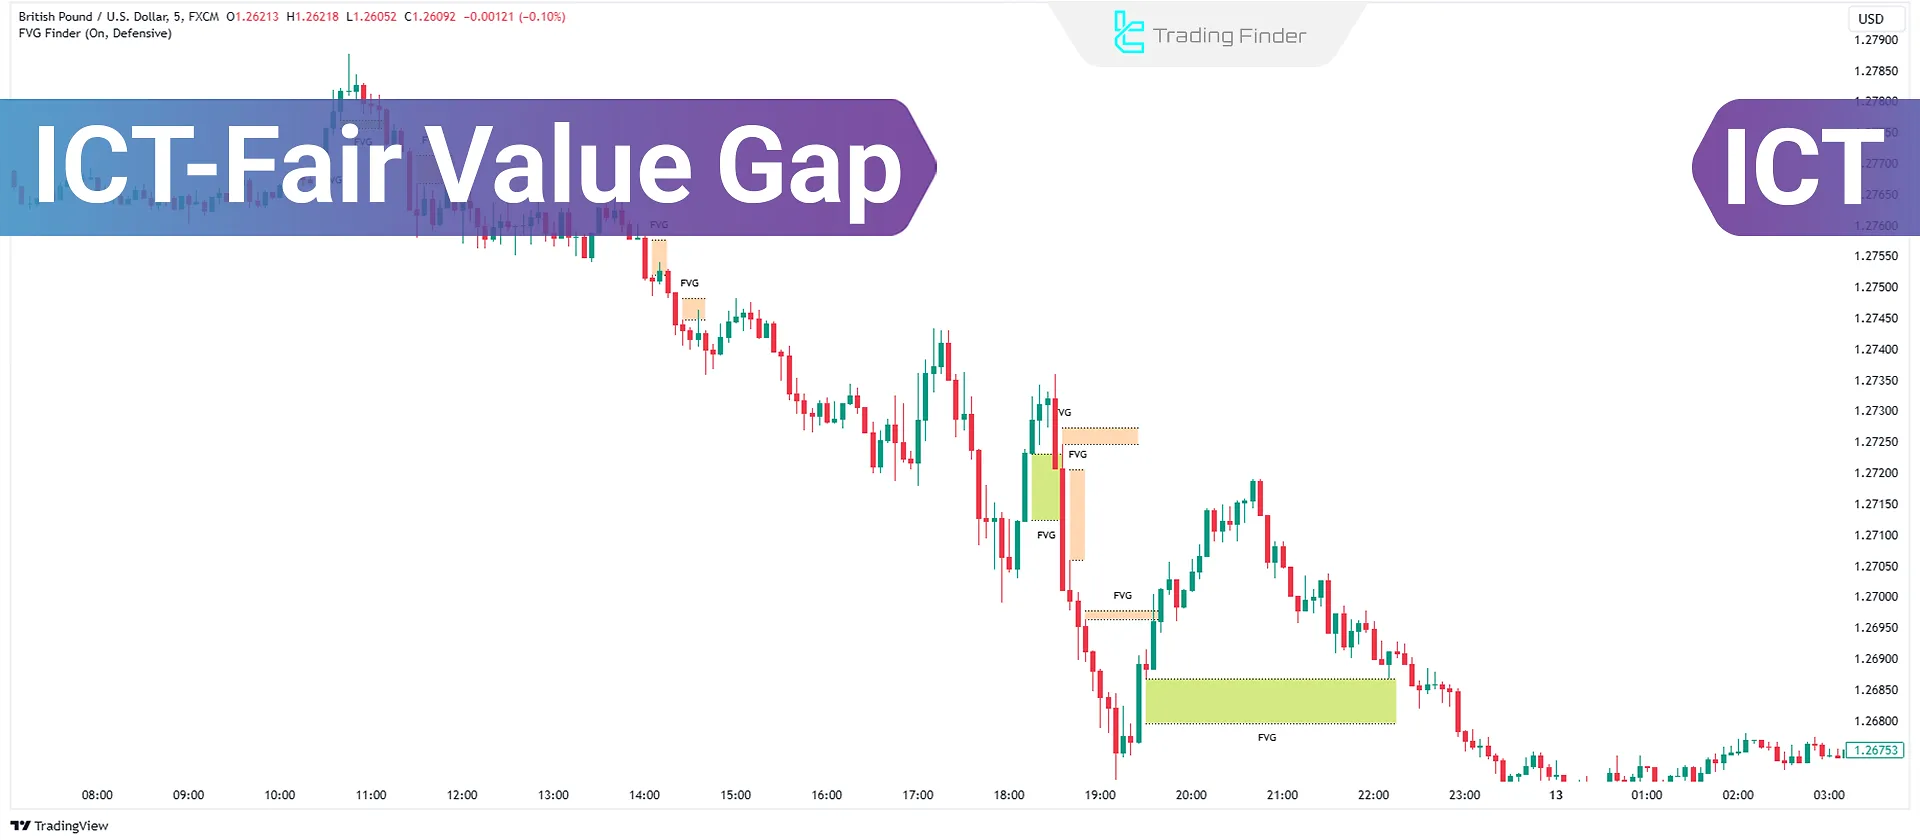
Fair Value Gap orICT FVG is a three-candle pattern that creates an empty or unreturned zone between the first candle's high and the third candle's low. This zone represents an imbalance between buyers and sellers and acts as a support or resistance level.
This imbalance is usually caused by a sudden influx of liquidity or the execution of large orders by smart money, and once it is filled, price equilibrium is restored.
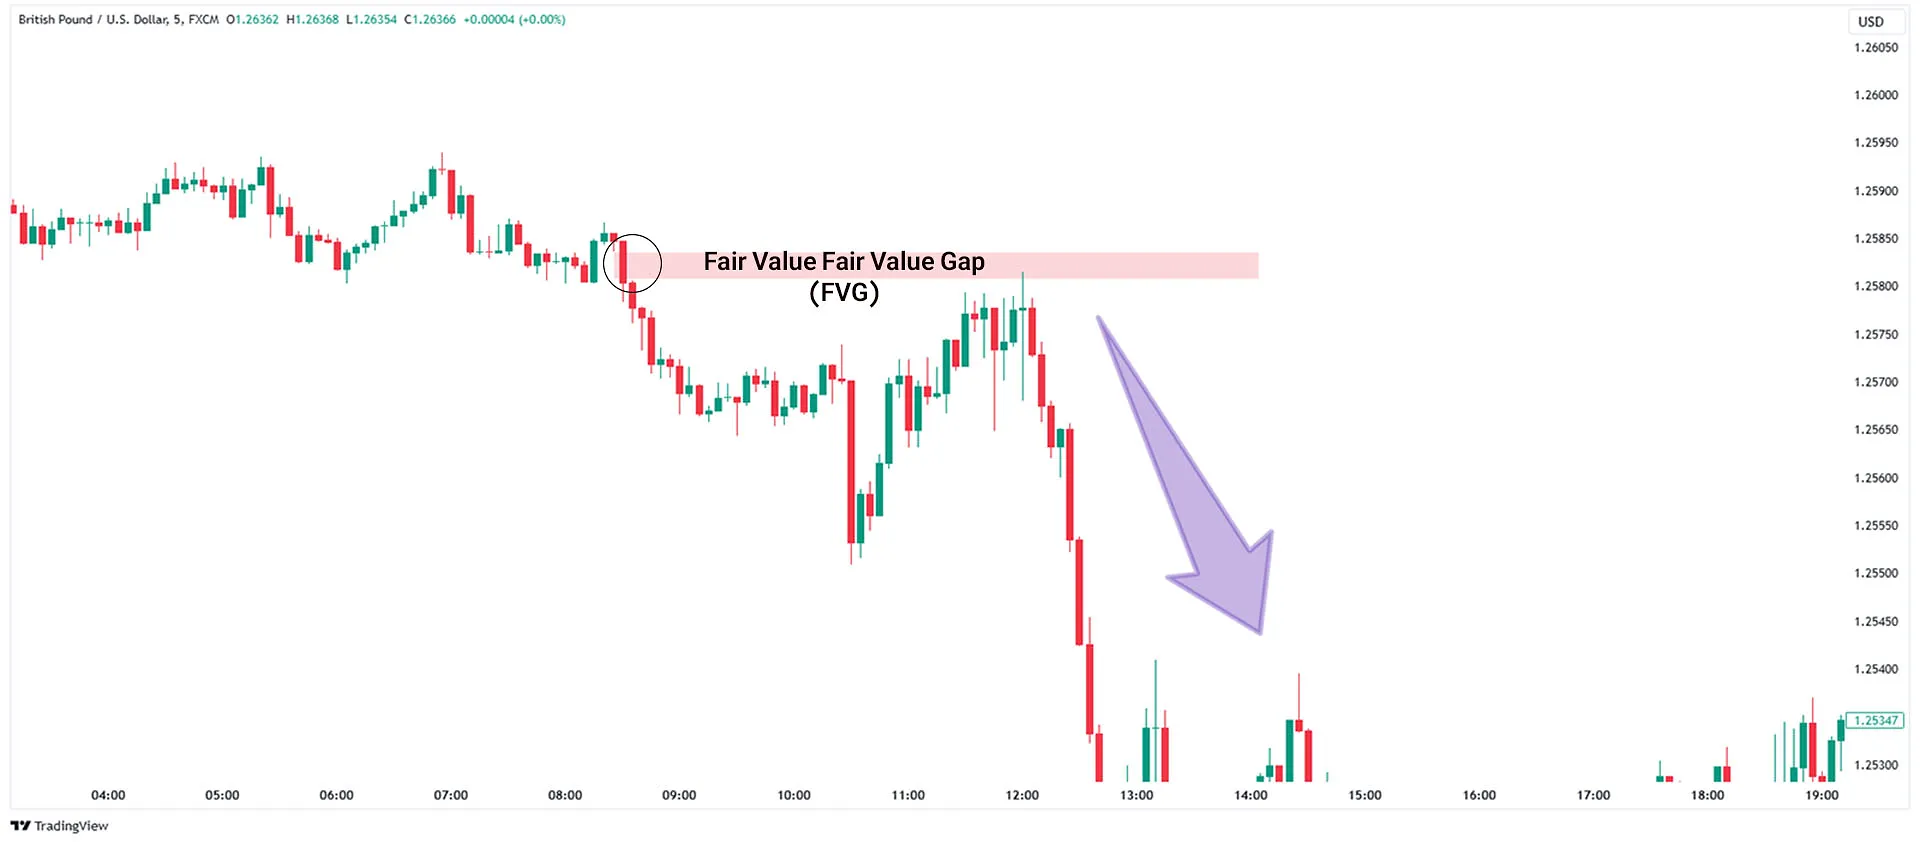
How is FVG Formed?
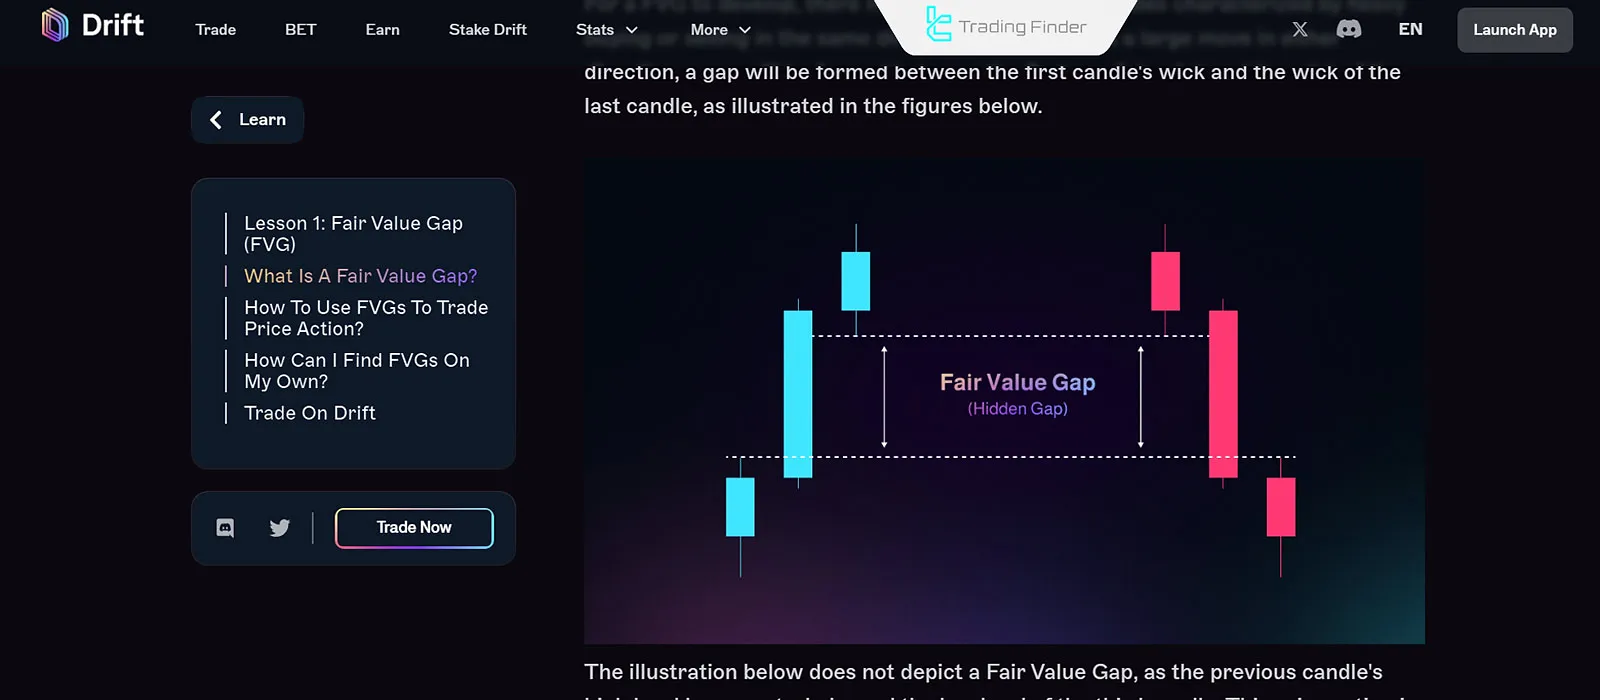
FVG forms when the price does not fully return to the zone between the first and third candles and remains unreturned. This area is thus referred to as a Fair Value Gap.
Educational video on Fair Value Gap (FVG) from the TTrades YouTube channel:
Advantages and Disadvantages of FVG
To better understand the effectiveness of FVG within the Smart Money framework, it is necessary to analyze its strengths and weaknesses in the context of price action.
Due to its distinct three-candle structure, the Fair Value Gap has strong potential for identifying entry and exit zones. However, if used without considering price action confirmations or market liquidity conditions, it may generate false signals.
Table of Advantages and Disadvantages of FVG:
Advantages of FVG | Disadvantages of FVG |
Identifies entry and exit points | Possibility of false signals in volatile markets |
High profit potential when used correctly | Requires experience to identify valid FVGs |
Lower risk compared to many price action strategies | Limited opportunities in certain timeframes |
Applicable to various markets such as Forex and Crypto | Affected by news and unpredictable market movements |
Fair Value Gap represents price imbalance and acts as a support or resistance zone on the chart.
Tutorial on the proper formation of FVG from the Flux Charts website:
How to Identify an FVG
The validity of an FVG is confirmed when the price structure and market behavior indicate a real imbalance between buy and sell orders.
The mere presence of a three-candle gap is not sufficient for making trading decisions. The following factors should be analyzed when evaluating an FVG:
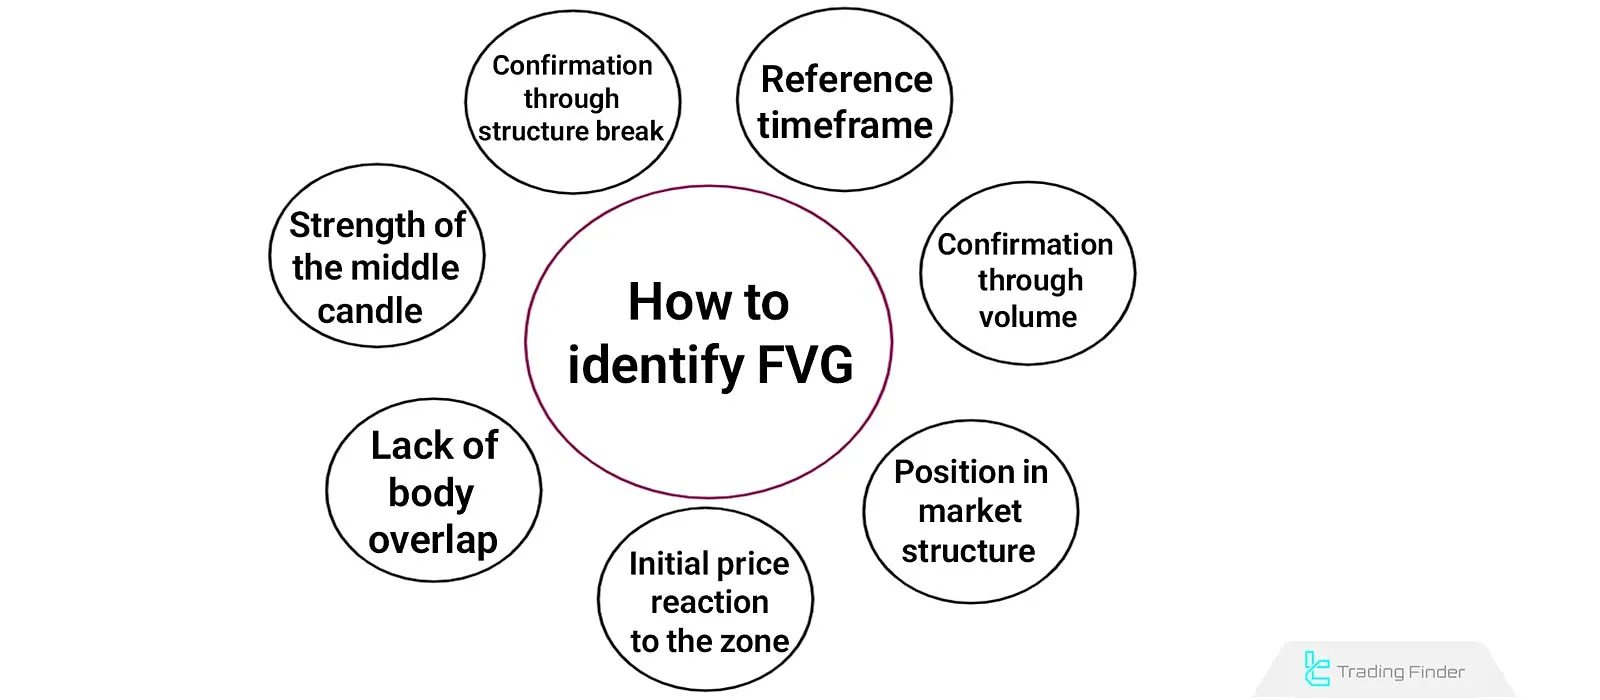
Strength of the Middle Candle (Imbalance Candle)
The second candle should have a large body and short wicks. This feature indicates strong order pressure in one direction. If the body is weak or has long shadows, the likelihood of a quick price retracement and FVG invalidation increases.
Lack of Body Overlap
The bodies of the first and third candles should not overlap with the middle candle. Any overlap indicates early equilibrium between buyers and sellers, reducing the strength of the gap.
Initial Price Reaction to the Zone
Price behavior during the first return to the gap area is a key indicator of validity. A sharp and strong rejection response implies a more reliable FVG zone. Conversely, full penetration and multiple candle closes within the gap suggest weakening.
Position in Market Structure
The location of the FVG should align with the overall market trend. Gaps that form in the direction of the main trend are more likely to remain valid. In contrast, gaps against the trend or during a bias shift are prone to fake breakouts and reversals.
Confirmation through Volume
A rise in trading volume during the formation of the gap indicates the inflow of new liquidity. If volume within the FVG zone is low, the likelihood of weak validity and quick retracement increases.
Matching volume growth with the dominant market direction provides stronger confirmation of the gap’s legitimacy and trend continuation after it is filled.
Reference Timeframe
Gaps formed on higher timeframes (H1, H4, Daily) are more stable. Short-term FVGs on lower timeframes are useful for quick trades but are usually filled faster and rarely generate structural signals.
In contrast, larger gaps on higher timeframes typically represent significant institutional capital shifts and can act as key liquidity zones or daily directional guides.
Confirmation through Structure Break
FVGs have greater validity when they form alongside a market structure break (BOS or MSS), as this indicates the entry of liquidity and a new price direction. Conversely, FVGs that appear without a structural change often represent temporary and unreliable movements.
How Does FVG Work?
This gap works like a magnet, returning the price to restore balance. The price resumes its primary trend once the gap is revisited and corrected.
Simply put, FVG is an empty area on the chart that the price typically revisits before continuing its previous direction.
Types of FVG
Based on price movement, ICT FVG can be categorized into two types:
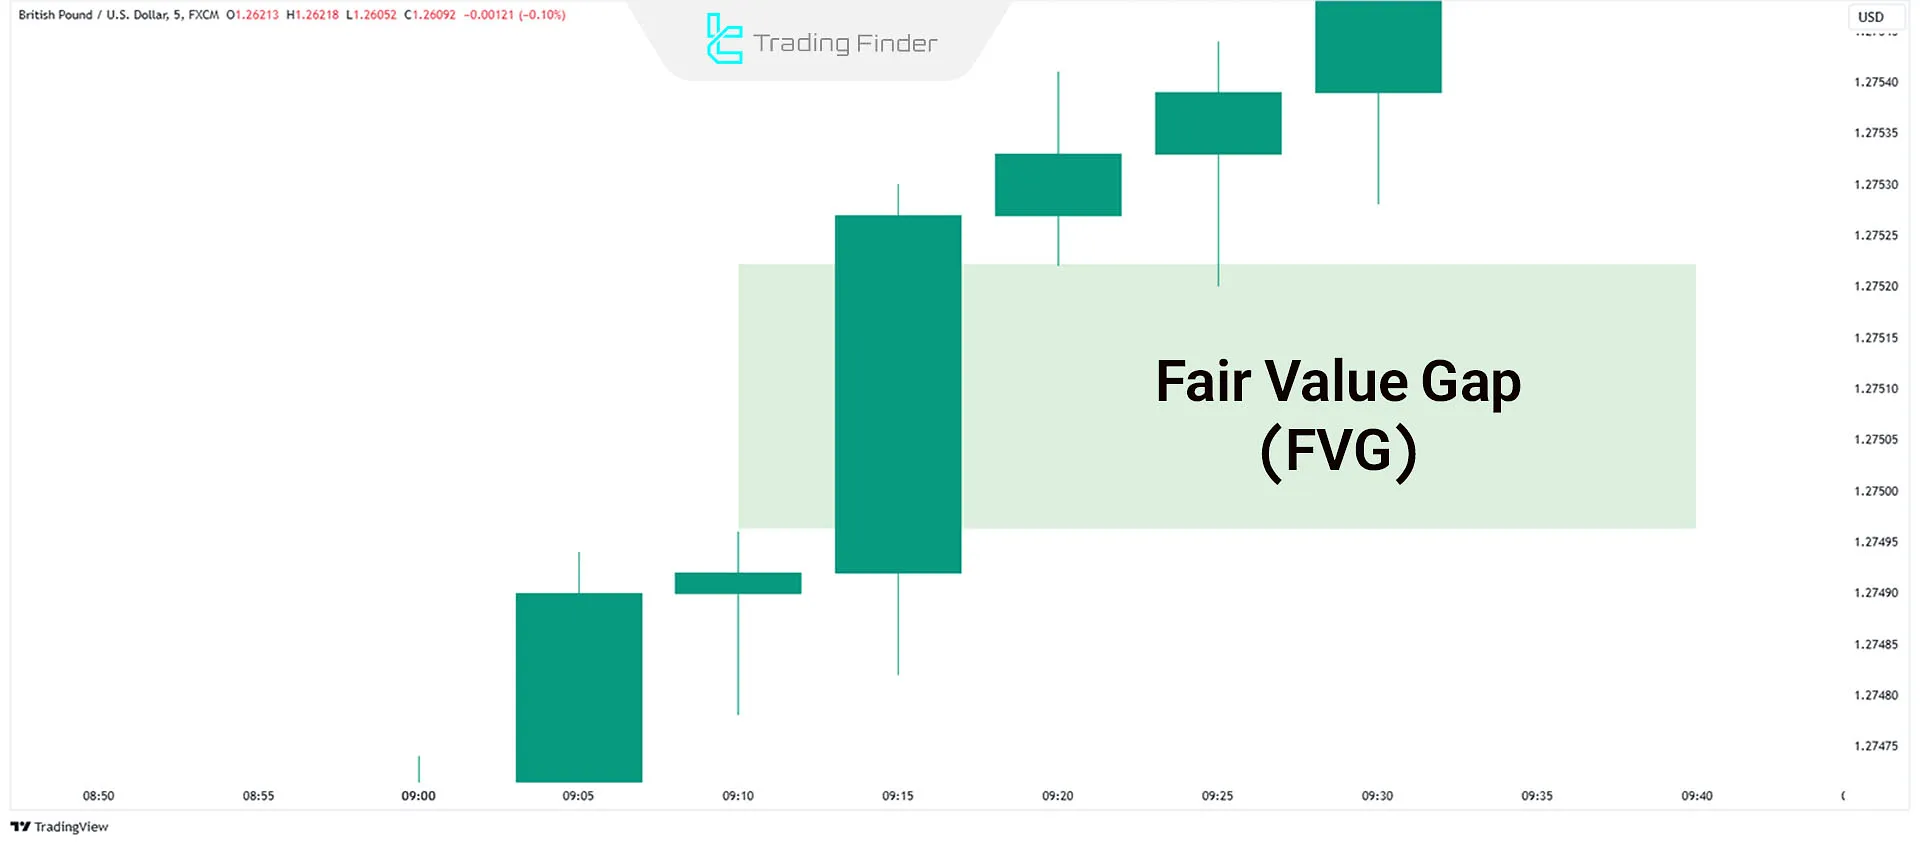
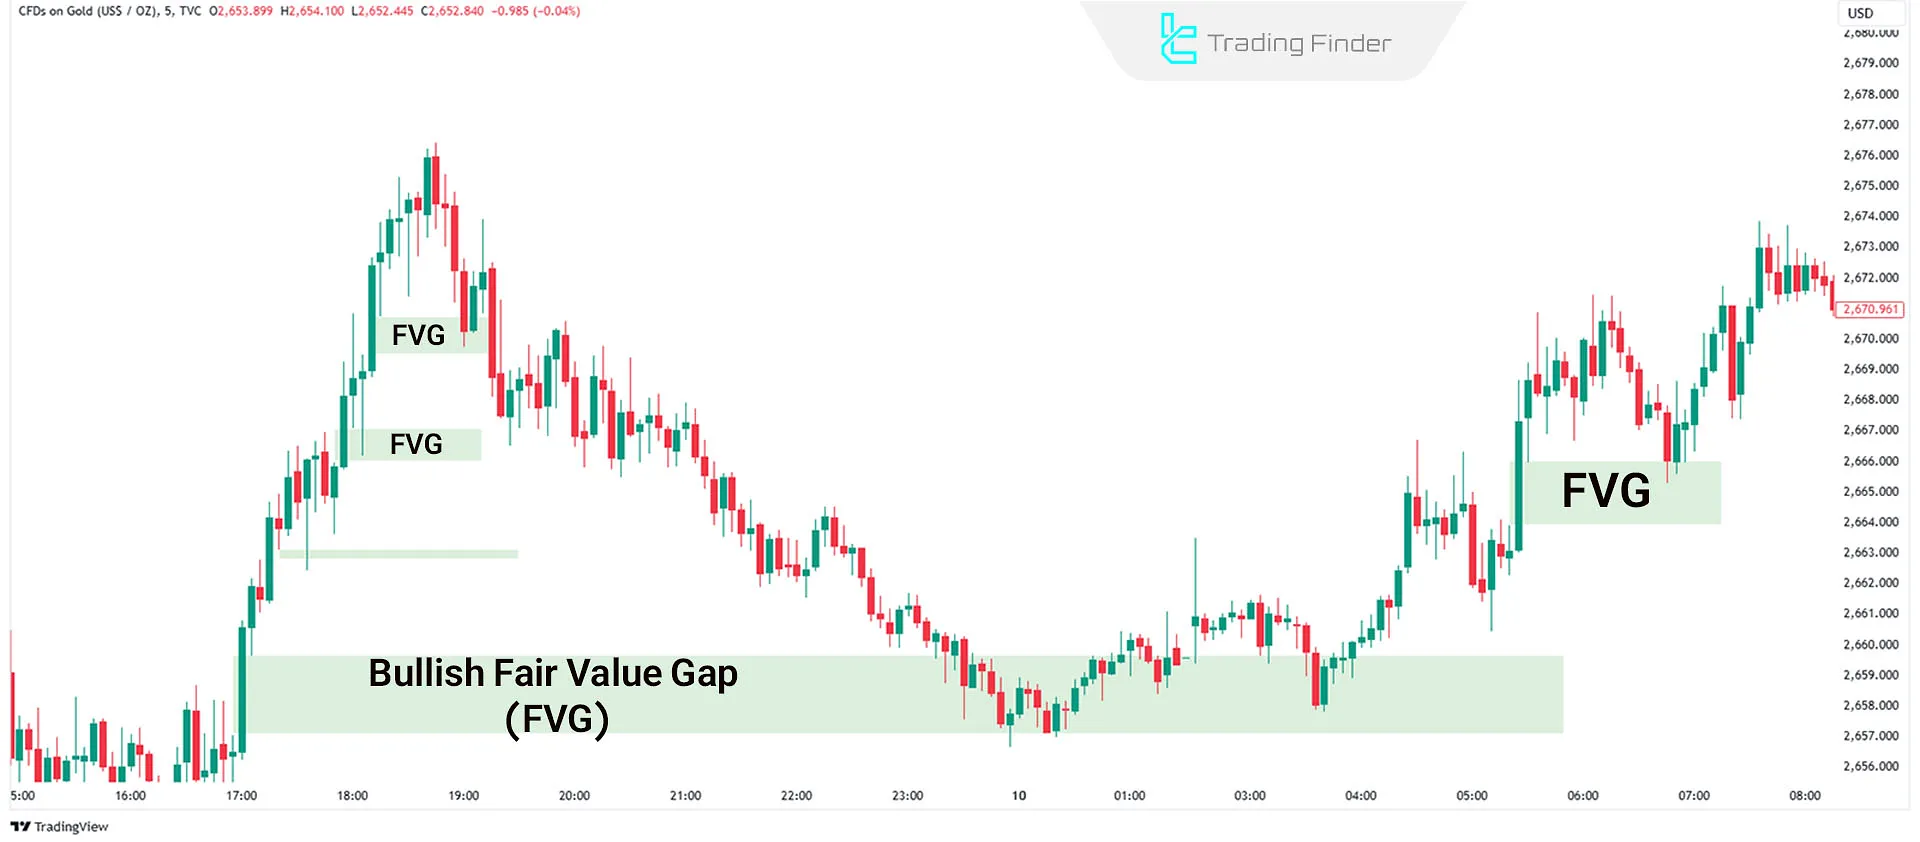
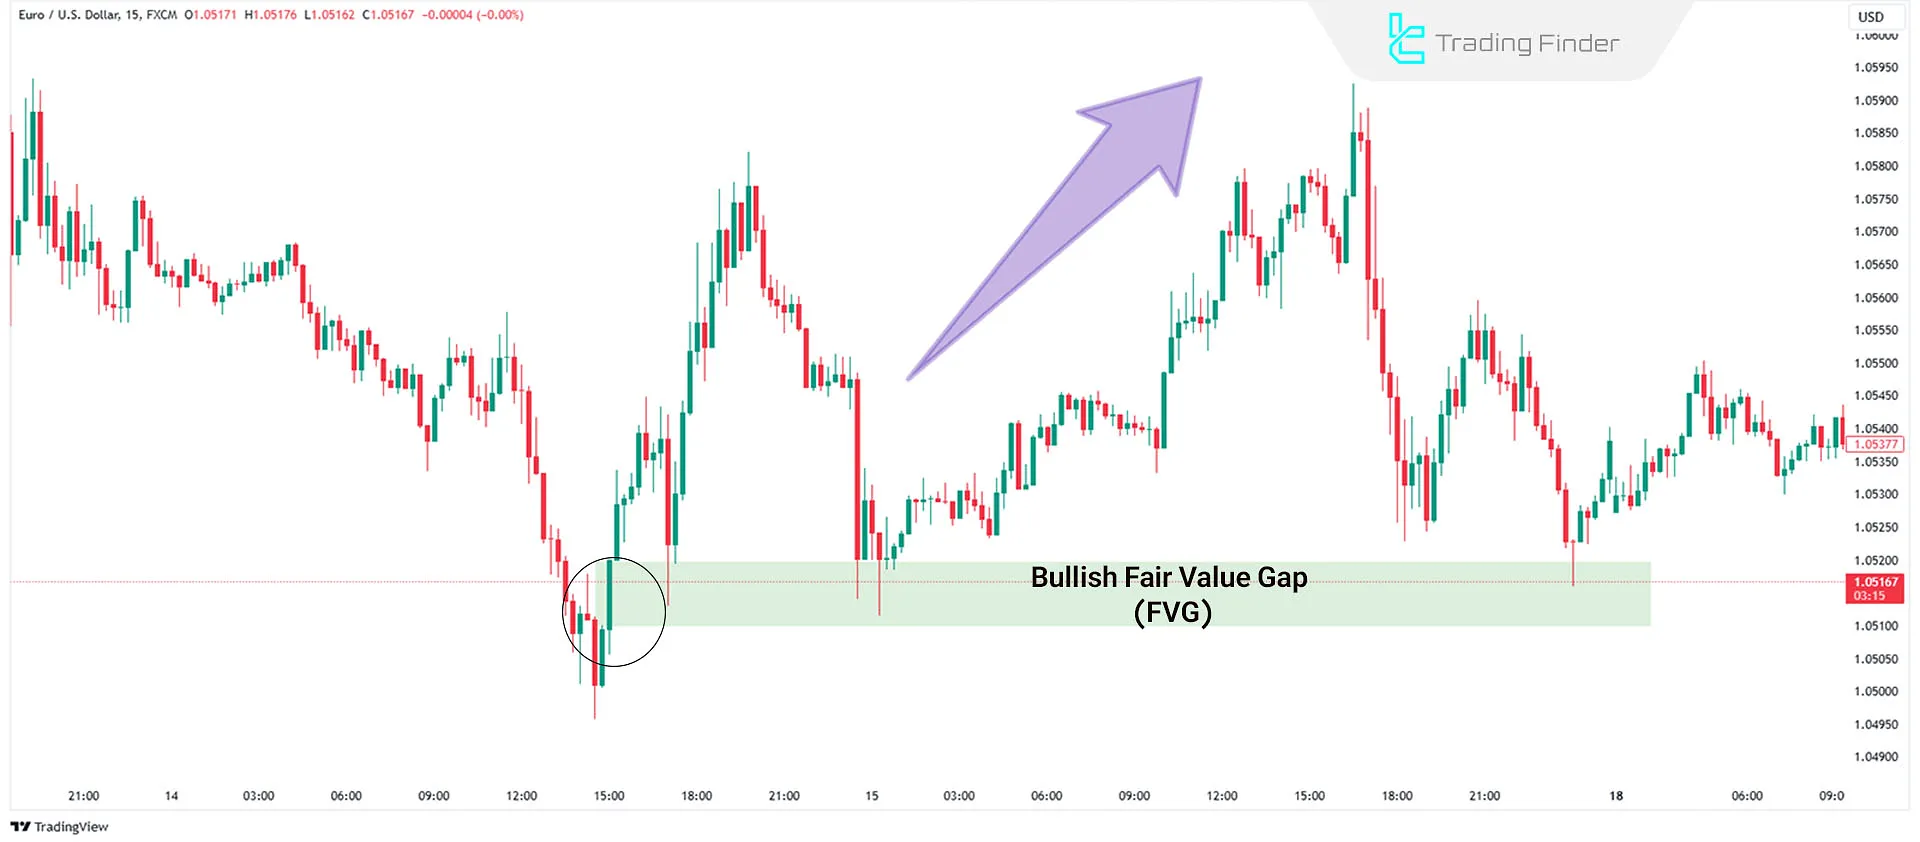
#1 Bullish Fair Value Gap
In a bullish market, a three-candle pattern may create a price gap. Bullish FVG forms when:
- The second candle has a large body;
- There is a gap between the first candle's high and the third candle's low.
This gap usually acts as strong support. The price often revisits this gap (to fill it) and then continues its upward movement.
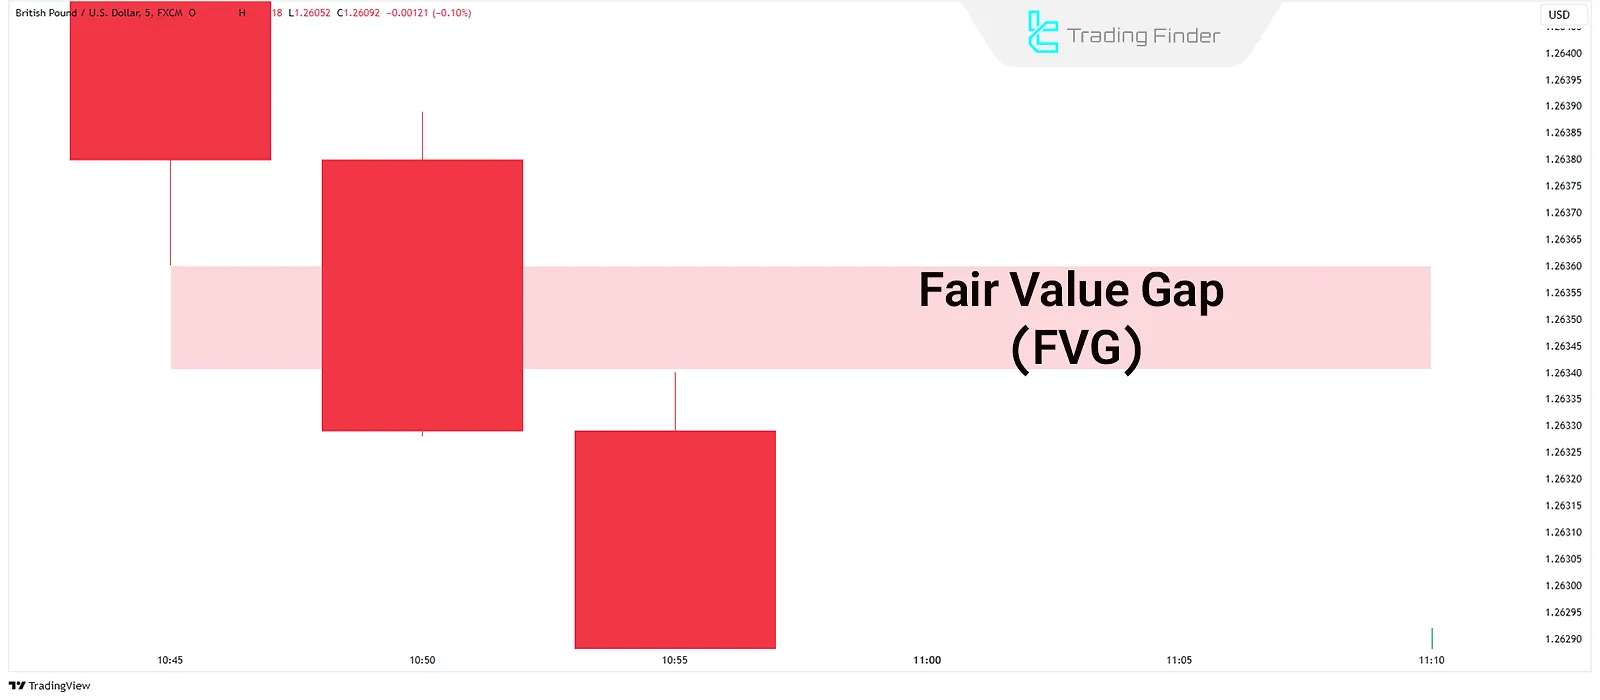
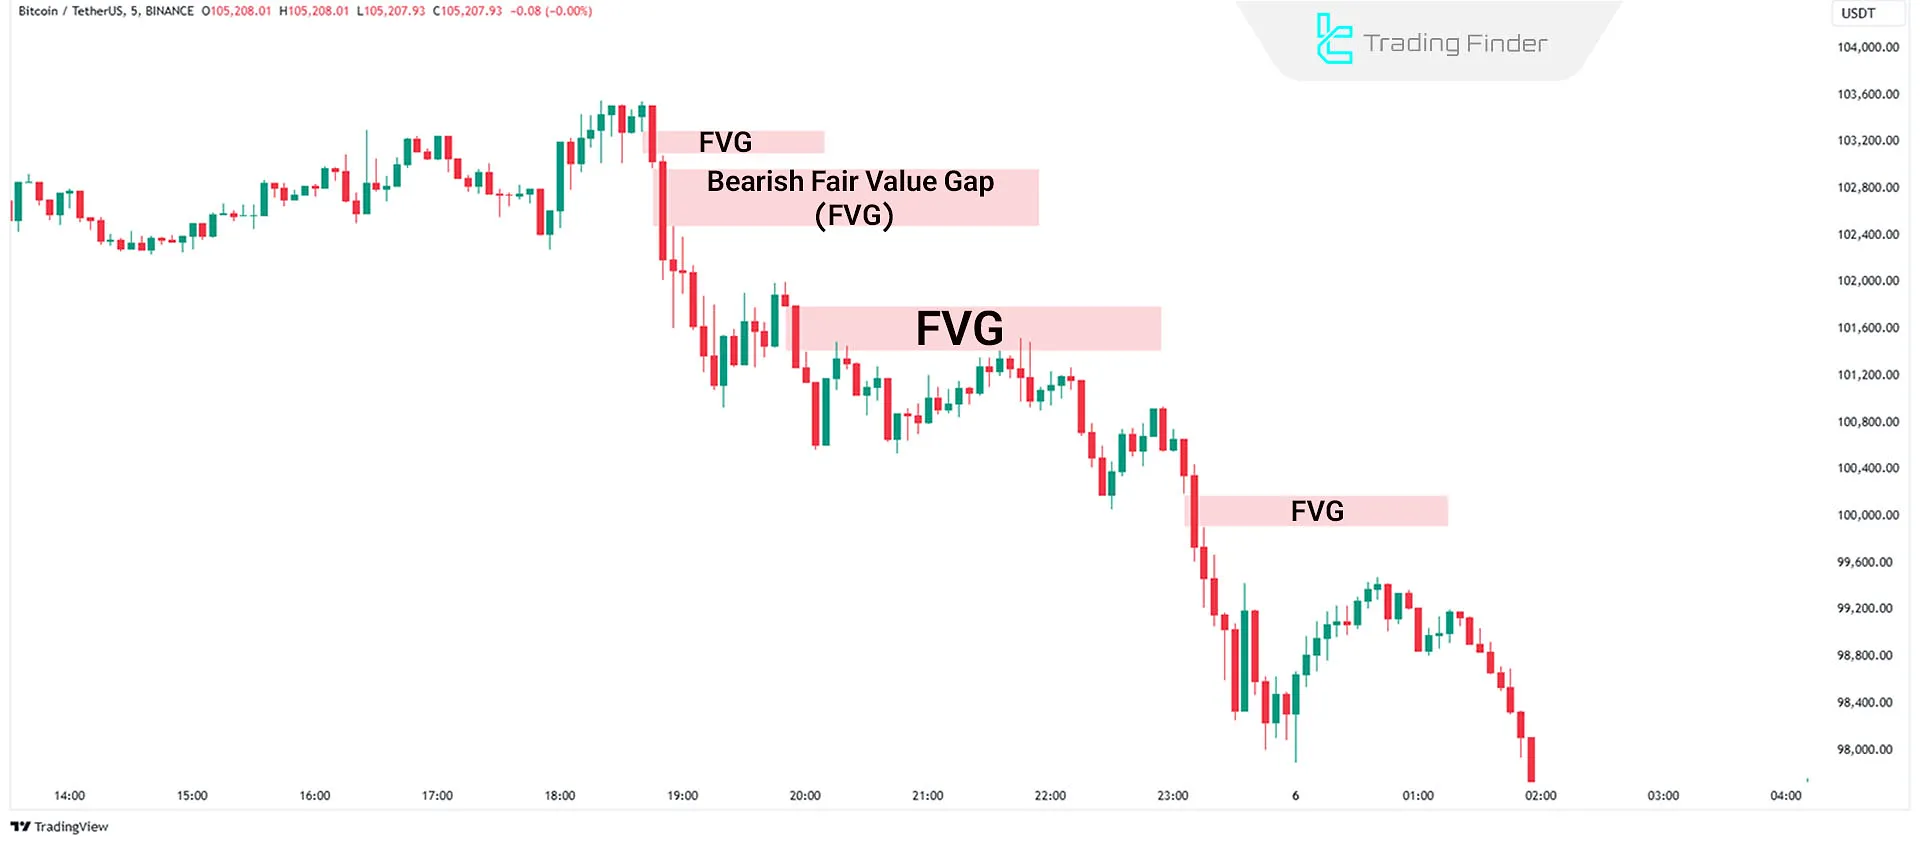
#2 Bearish Fair Value Gap
In a bearish market, a three-candle pattern may create a price gap. Bearish FVG forms when:
- The second candle has a large body;
- There is a gap between the first candle's low and the third candle's high.
This gap acts as strong resistance. The price often revisits this gap (to fill it) and then resumes its downward movement.
How to Trade Using FVG in ICT?
To trade using Fair Value Gap (FVG) in ICT, follow these steps:
#1 Determine the Market Trend
One of the main applications of FVG is identifying the dominant market direction, as the way gaps form and fill is directly related to the pattern of highs and lows.
- In an uptrend, prices form higher highs and higher lows;
- In a downtrend, prices form lower highs and lower lows.
#2 Identify Premium and Discount Zones
The location of an FVG in relation to price zones determines the probable market direction and can provide an ideal point for entry or trade continuation.
To Utilize Fair Value Gaps (FVG) in Trading, One Can Use Premium and Discount Zones:
- In a downtrend, traders locate FVG in the Premium Zone;
- In an uptrend, traders locate FVG in the Discount Zone.
#3 Identify the Significant Candle
After identifying the market trend, you should look for a candle with a large body and small wicks. In an uptrend, a strong bullish candle should have a large body and wide range.
In a downtrend, a strong bearish candle should have a large body with the widest body range.
#4 Analyze Surrounding Candles
Examine the candles before and after the significant candle. These should not overlap with the large candle's body. Such a structure confirms the presence of FVG between the wicks of the first and third candles.
#5 Mark the Fair Value Gap (FVG)
- In an uptrend, FVG is the gap between the first candle's high and the third candle's low;
- In a downtrend, FVG is the gap between the first candle's low and the third candle's high.
#6 Enter the Trade
Uptrend: Wait for the price to return to the Discount FVG zone. After testing the gap, use confirmations like price rejection or market structure shifts on lower timeframes to open a buy position.
Downtrend: Wait for the price to return to the Premium FVG zone. Upon reaching the gap, use confirmations to open a sell position.
FVG Indicator (Fair Value Gap Indicator)
The Fair Value Gap (FVG) indicator is one of the key tools in ICT and Smart Money concepts, used to identify imbalance zones between supply and demand.
This indicator automatically detects price gaps formed between the first and third candles in a three-candle pattern and displays them as boxes on the chart.
Gaps created due to strong price movements and insufficient liquidity between buy and sell orders are recognized as potential trend reversal points and ideal entry or exit zones.
Tutorial videos on using the FVG indicator:
In an uptrend, the price usually retraces to fill a bearish FVG before continuing its upward movement; these zones often present good opportunities for long (buy) entries.
Conversely, in a downtrend, after a bullish correction, the price often reacts to bullish FVGs and resumes its downward movement making these contact zones ideal for short (sell) entries.
The indicator offers high customization options. Users can adjust background style (dark or light), the number of candles analyzed, FVG calculation methods, visibility of the latest gaps, and box extensions.

The FVG indicator is a precise and professional tool for traders familiar with liquidity and supply & demand concepts.
By automatically identifying imbalance zones, it helps define optimal entry and exit points, detect structural support and resistance, and gain a deeper understanding of price behavior.
Proper use of this indicator enhances price action analysis accuracy and enables more informed trading decisions across Forex, stocks, indices, and cryptocurrency markets. Download links for the FVG Indicator:
How to Use FVG as a Profit Target
In the ICT style, the Fair Value Gap (FVG), in addition to its entry role, can also be used as a profit target, because the market tends to fill open gaps to reach equilibrium.
When the trader enters a trade in the opposite direction of the gap, the price reaching the FVG area is considered a logical target for exit.
For the validity of this target, alignment with the daily bias, the presence of liquidity near the FVG, and appropriate volume should be examined. In short-term trades, the nearest gap is considered the initial target, and in swing trades.
the FVG of the higher timeframe is regarded as the final target.
Difference between FVG and Imbalance
The two concepts of Fair Value Gap (FVG) and Imbalance have differences as shown in the table below:
Feature | FVG (Fair Value Gap) | Imbalance |
Candle structure | Precise three-candle structure | Free and unlimited structure |
Direct visibility | Clear and distinct | Broad and requires deeper analysis |
Reference price levels | Low of the first candle to High of the third candle | Broad zones between the wicks or candle bodies |
Type of market movement | Sudden and sharp movement | Continuous, slow, or unusually high-volume movement |
Use as Entry | Precise and common entry point | Structural analysis and general confirmation area |
Conceptual position | Specific subset of Imbalance | Broad concept including various imbalances |
Which Timeframes Are Best for FVG?
Fair Value Gaps (FVG) are analyzed across different timeframes:
- Use higher timeframes (e.g., daily) for overall market direction (Daily Bias);
- Use lower timeframes (e.g., 15 minutes) to pinpoint trade entries.
Best Markets for FVG
FVG was first introduced in indices like Nasdaq andS&P-500, achieving excellent results. Later, it was successfully applied to forex and has become an essential tool for traders in all markets.
Conclusion
Fair Value Gap (FVG) helps identify price imbalance zones where prices move quickly, bypassing market orders.
Traders can use these zones to find better entry and exit points. Proper understanding and usage of FVG can improve trading decisions and profitability.


