


The New Day Opening Gap (NDOG) refers to the price difference between the market's closing price and its reopening price in the following day. For example, in U.S. indices, the market closes at 5 PM (New York time) and reopens at 6 PM (New York time).
Traders use this analytical method to monitor liquidity flows and implement the ICT strategy. The importance of NDOG lies in its ability to define the initial daily structure and the potential directional bias of price before complete patterns form on lower timeframes.
What Is the New Day Opening Gap (NDOG)?
The New Day Opening Gap (NDOG) is the price difference between the previous trading day’s close and the new day’s open. This gap commonly appears in markets that have a daily trading halt.
The New Day Opening Gap (NDOG) is not merely a simple price void; in ICT logic, it has a defined role and functions as an active liquidity zone at the beginning of each trading day.
Within the ICT framework, the NDOG reflects an imbalance between supply and demand at the moment of market reopening a gap created by pending order transfers, volume shifts during the previous session, or institutional reactions occurring while the market is closed.
Educational video on the New Day Opening Gap from the Inner Circle Clips YouTube channel:
Reasons for NDOG Formation
The New Day Opening Gap is the result of sudden shifts in the supply demand balance during the period when the market is closed and no order flow can be exchanged.
These shifts typically arise from events that move liquidity without direct price interaction, causing a gap to appear at the moment the next day opens. Reasons for the formation of the NDOG:
- Release of significant news outside trading hours;
- Changes in market supply and demand;
- Sudden decisions by large institutional traders.
NDOG Advantages and Disadvantages
The New Day Opening Gap, like any analytical tool, comes with a set of advantages and limitations that must be understood for precise and professional use. Table of advantages and disadvantages of the New Day Opening Gap (NDOG):
Advantages | Disadvantages |
Identifying daily imbalance zones | Possibility of false signals in low-volume markets |
Defining the initial Daily Bias | Requires experience to interpret price reactions |
Marking daily support and resistance levels | High sensitivity to high-volatility news |
Enabling precise entries on returns to the gap | Not applicable to assets without actual market closures |
Effective for 5- and 15-minute timeframes | Difficulty validating the gap in ranging markets |
Helping understand liquidity flow | Possibility of the gap remaining unfilled within the same day |
Can be combined with FVG and OB for entry confirmation | Requires multi-session analysis to avoid errors |
Provides a clear structure for daily risk management | The gap may break quickly in strong trends |
How to Use NDOG at the Start of a New Day?
The process of using NDOG relies on a set of specific and measurable steps that enable structural analysis of price behavior at the beginning of the trading day.
These steps create an organized framework for identifying the market’s initial reaction, selecting a trading scenario, and managing risk. Steps for using NDOG:
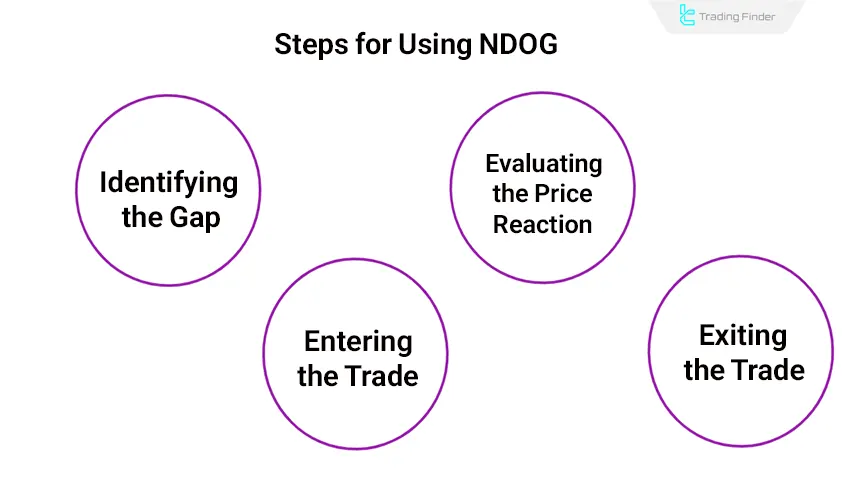
- Identify the gap: Mark the previous day's closing price and the new day's opening price (NDOG) on the chart;
- Observe price reaction: If the price tends to fill the gap, apply a gap-fill strategy. If the price moves toward the gap, traders should seek confirmation of trend continuation;
- Enter the trade: For a gap-fill strategy, enter trades opposite to the gap direction. For a trend continuation strategy, enter trades in the gap's direction;
- Exit the trade: Set your take profit and stop loss levels by using key price levels or the point where the price returns to the gap's starting position.
Finding Entry Points Using the 50% NDOG Level
One of the most important NDOG trading methods involves the 50% level of the gap. This level often triggers significant price reactions.
To calculate the exact 50% level, use the 0, 0.5, and 1 levels of Fibonacci tool.
Does NDOG Expire After Being Filled?
The validity of NDOG does not necessarily disappear once the gap is fully filled. In many price structures, the gap remains an active zone even after being filled; the reason for this persistence is the residual footprint of liquidity flow and institutional orders within that area.
If price pauses in the zone after filling the gap or forms confirming candles, the NDOG level can act as secondary support or resistance and set the stage for the next move.
The durability of this zone depends on market conditions. In strong trends, the gap is usually touched only to rebalance inefficiency and has limited structural significance afterward.
Conversely, in medium-term or ranging markets, NDOG may be revisited multiple times even after being filled, giving it a longer lifespan.
Applications of NDOG in Trading
The applications of NDOG extend beyond identifying a simple price gap; it plays a practical role in analyzing market behavior, determining the daily structure, and identifying high-probability entry zones. Method of using the New Day Opening Gap from the Writo-Finance website:
This tool, when combined with multiple consecutive gaps and detailed lower-timeframe analysis, provides a clear picture of liquidity direction and the decision-making zones of large market participants. Types of NDOG applications in trading:
- Identifying key levels: NDOG and NWOG gaps are reference points for support and resistance levels;
- Plotting multiple NDOGs: Draw at least five NDOGs on the chart for better understanding of price behavior;
- Analyzing lower timeframes: After identifying NDOGs on daily charts, switch to lower timeframes (e.g., 5- or 15-minute) to find precise entry points.
Key Times for Using NDOG
Timing plays a decisive role in using NDOG, as the price reaction to the gap at the beginning of the day and across different sessions follows a consistent and analyzable pattern.
Understanding these temporal differences allows the trader to evaluate the gap’s behavior more accurately and use the most suitable moment for entering a trade. Suitable times for using NDOG:
- Early trading hours: The first 1-2 hours after the market opens are critical for identifying and trading gaps;
- Trading sessions: Price reactions to gaps vary across different market sessions (Asia, Europe, U.S.);
- London session: High volumes and frequent gap fills;
- New York session: Confirmation or continuation of gap trends.
Advanced NDOG Tips
Advanced work with NDOG requires attention to factors that influence the strength, durability, and validity of the gap.
Examining multi-day gaps, measuring the size of the gap, aligning it with the dominant trend, and assessing the news context provide the trader with a more precise view of signal quality. Types of advanced tips for using NDOG:
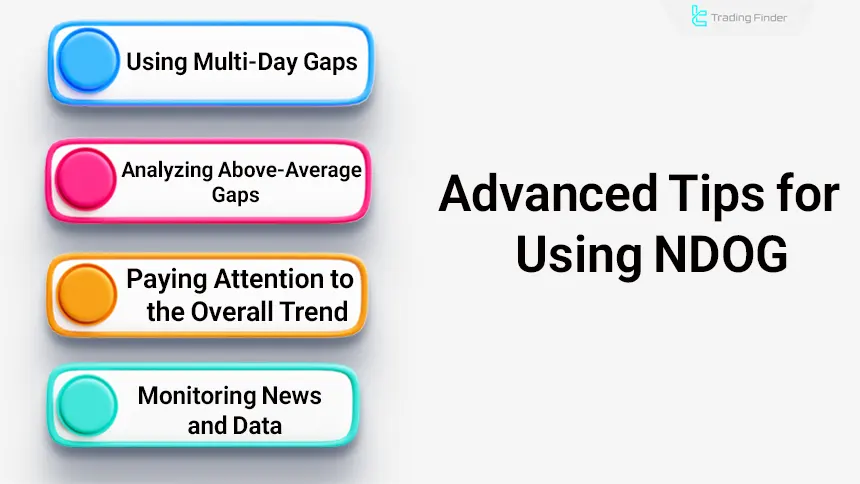
- Multi-day gaps: Gaps spanning multiple trading days provide stronger levels for analysis;
- Larger-than-average gaps: Pay attention to gaps larger than the daily average for significant signals;
- Market trend alignment: Gaps aligned with the overall market trend are more likely to succeed;
- Monitor news and data: Gaps caused by economic news or significant reports offer stronger signals.
NDOG Buy Strategy
Using NDOG in buy-side trades is effective when the price reaction to the gap level shows signs of liquidity absorption and the beginning of an upward move.
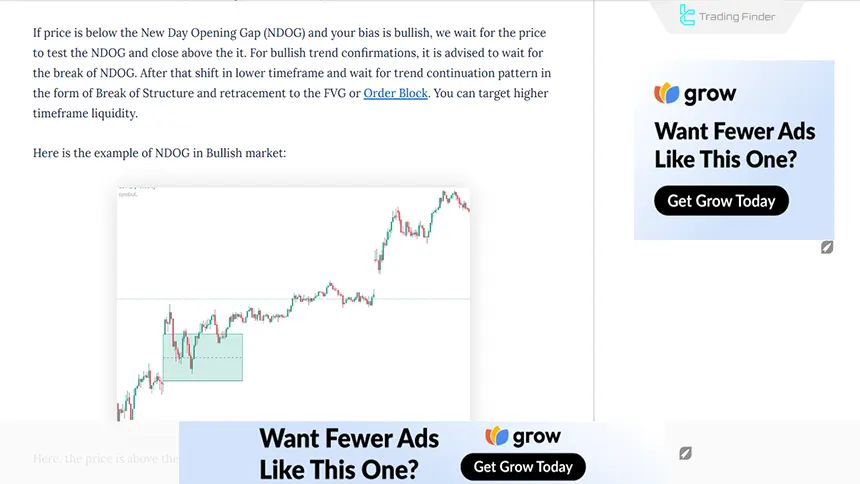
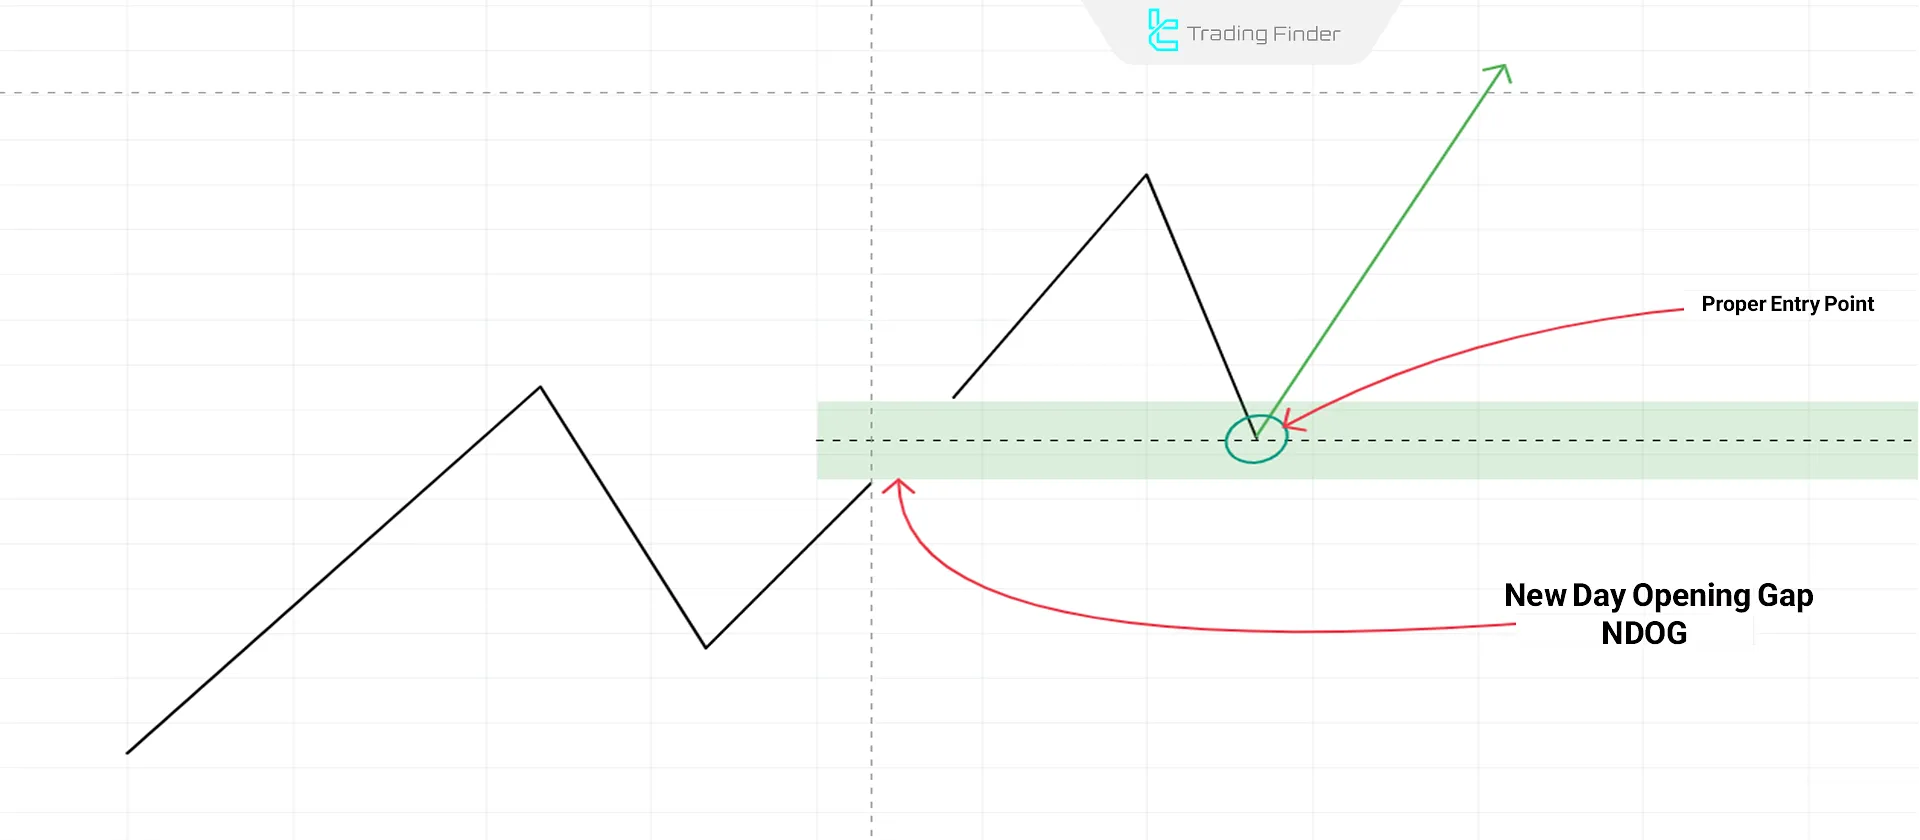
Interpreting the position of price relative to NDOG (above or below the gap) provides a clear framework for identifying a reversal or continuation scenario.In bullish scenarios, the strategy splits into two approaches:
- Price above the NDOG level: Wait for the price to return to the NDOG level and test it. After observing signs of price reversal on lower timeframes (like market structure shift), enter a buy position, targeting liquidity levels;
- Price below the NDOG level: If the price tests the NDOG level and closes above it, this level acts as support; It will confirm the bullish analysis.
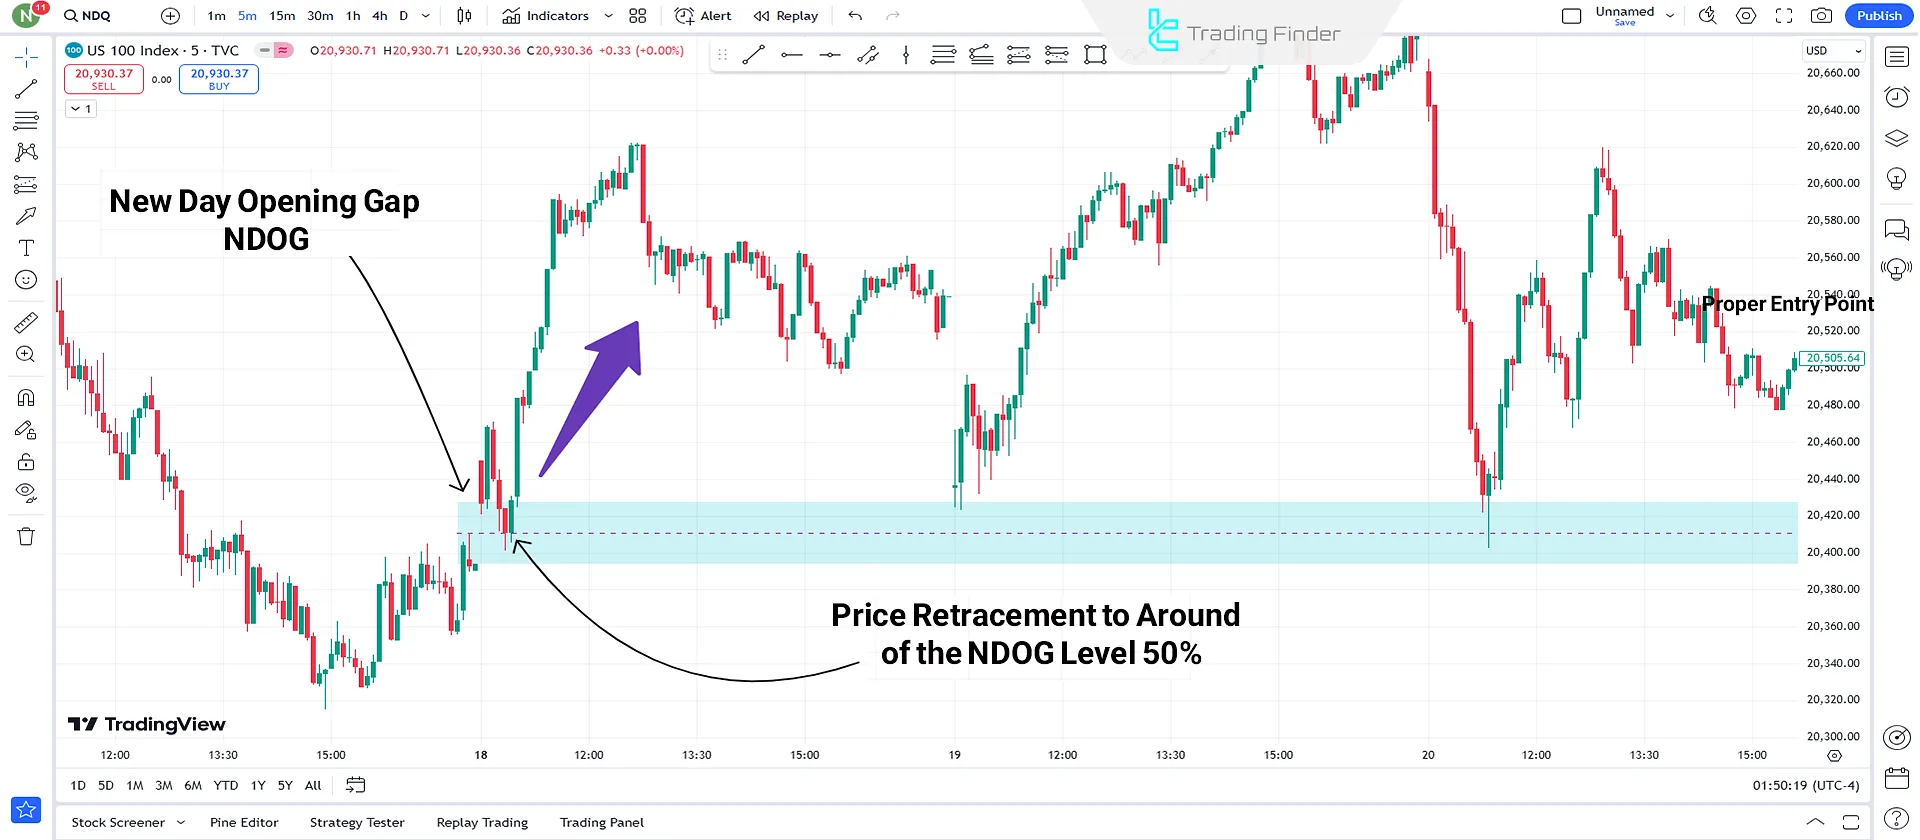
Example of Using NDOG in Buy-Side Trades
In this chart, the New Day Opening Gap (NDOG) is clearly identified, and after the market opens, the price makes a corrective move toward approximately the 50% level of the gap.
The blue zone represents the area where price entered to complete the imbalance, and after touching it, a strong bullish reversal formed. This behavior is a classic example of price reaction to NDOG in the ICT style.
NDOG Sell Strategy
The use of NDOG in sell-side trades becomes important when the market structure shows a tendency to absorb liquidity in the gap zone and initiate a downward move.
The position of price relative to the NDOG level (a pullback to retest from below or a break and close beneath the gap) provides a method for identifying a reversal scenario or confirming resistance and entering a sell trade.
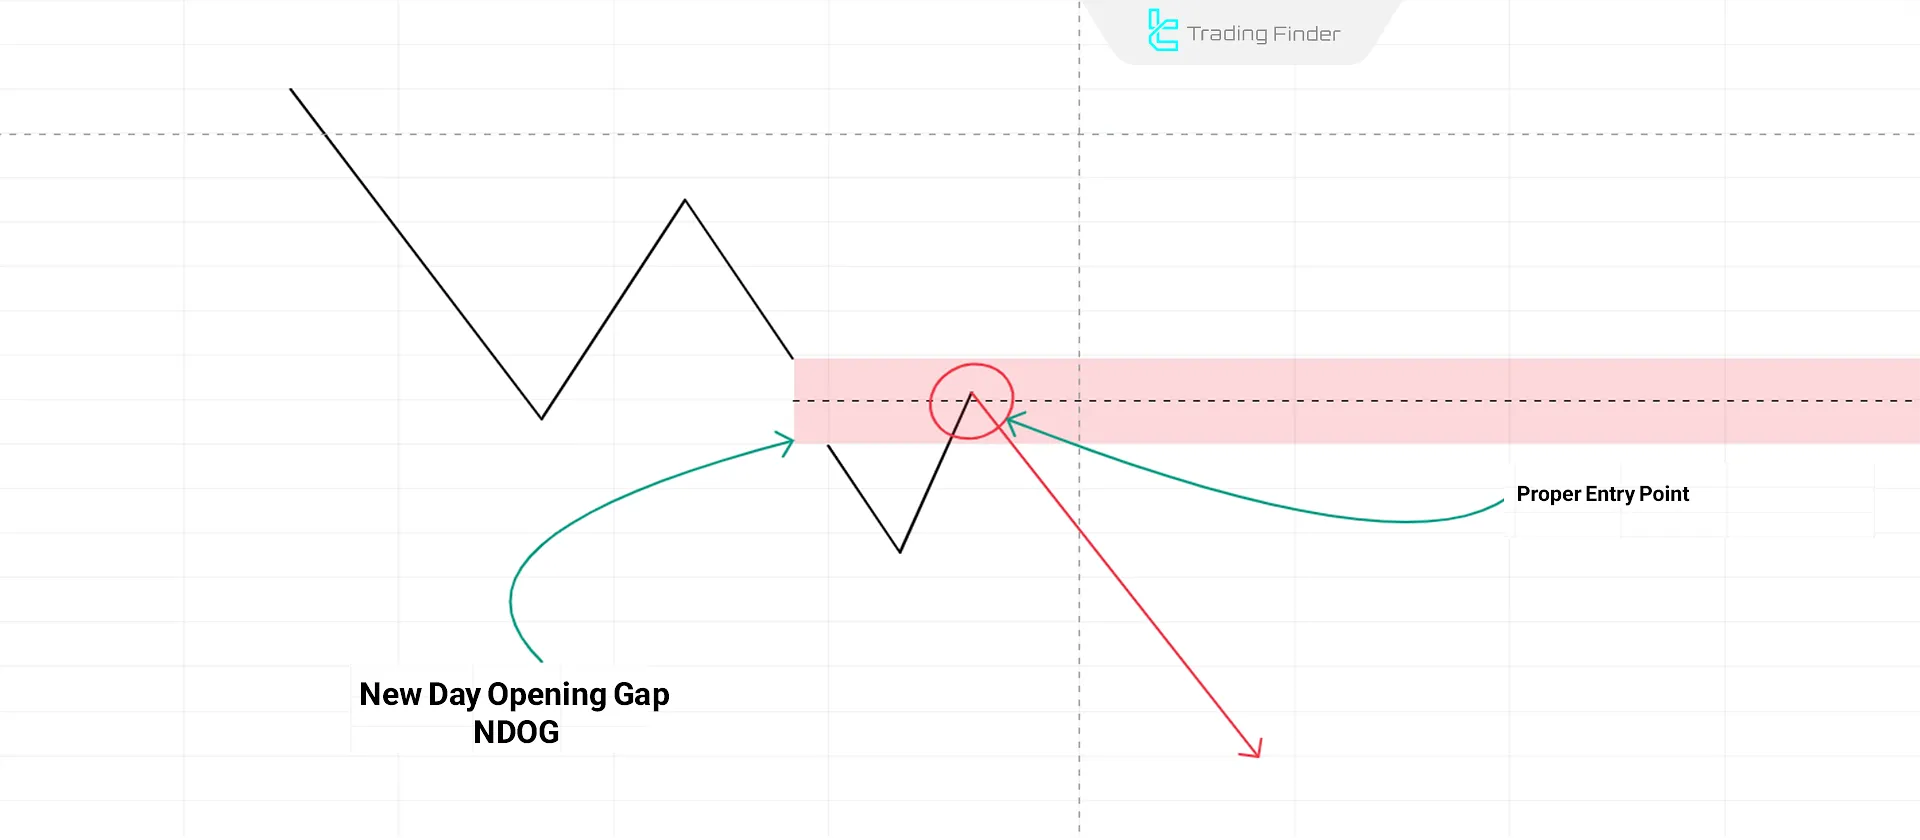
In bearish scenarios, the strategy splits into two approaches:
- Price below the NDOG level: Wait for the price to return to the NDOG level and test it. After observing signs of price reversal on lower timeframes (e.g., structure changes), enter a sell position, targeting liquidity levels;
- Price above the NDOG level: If the price tests the NDOG level and closes below it, this level acts as resistance, confirming the bearish analysis.
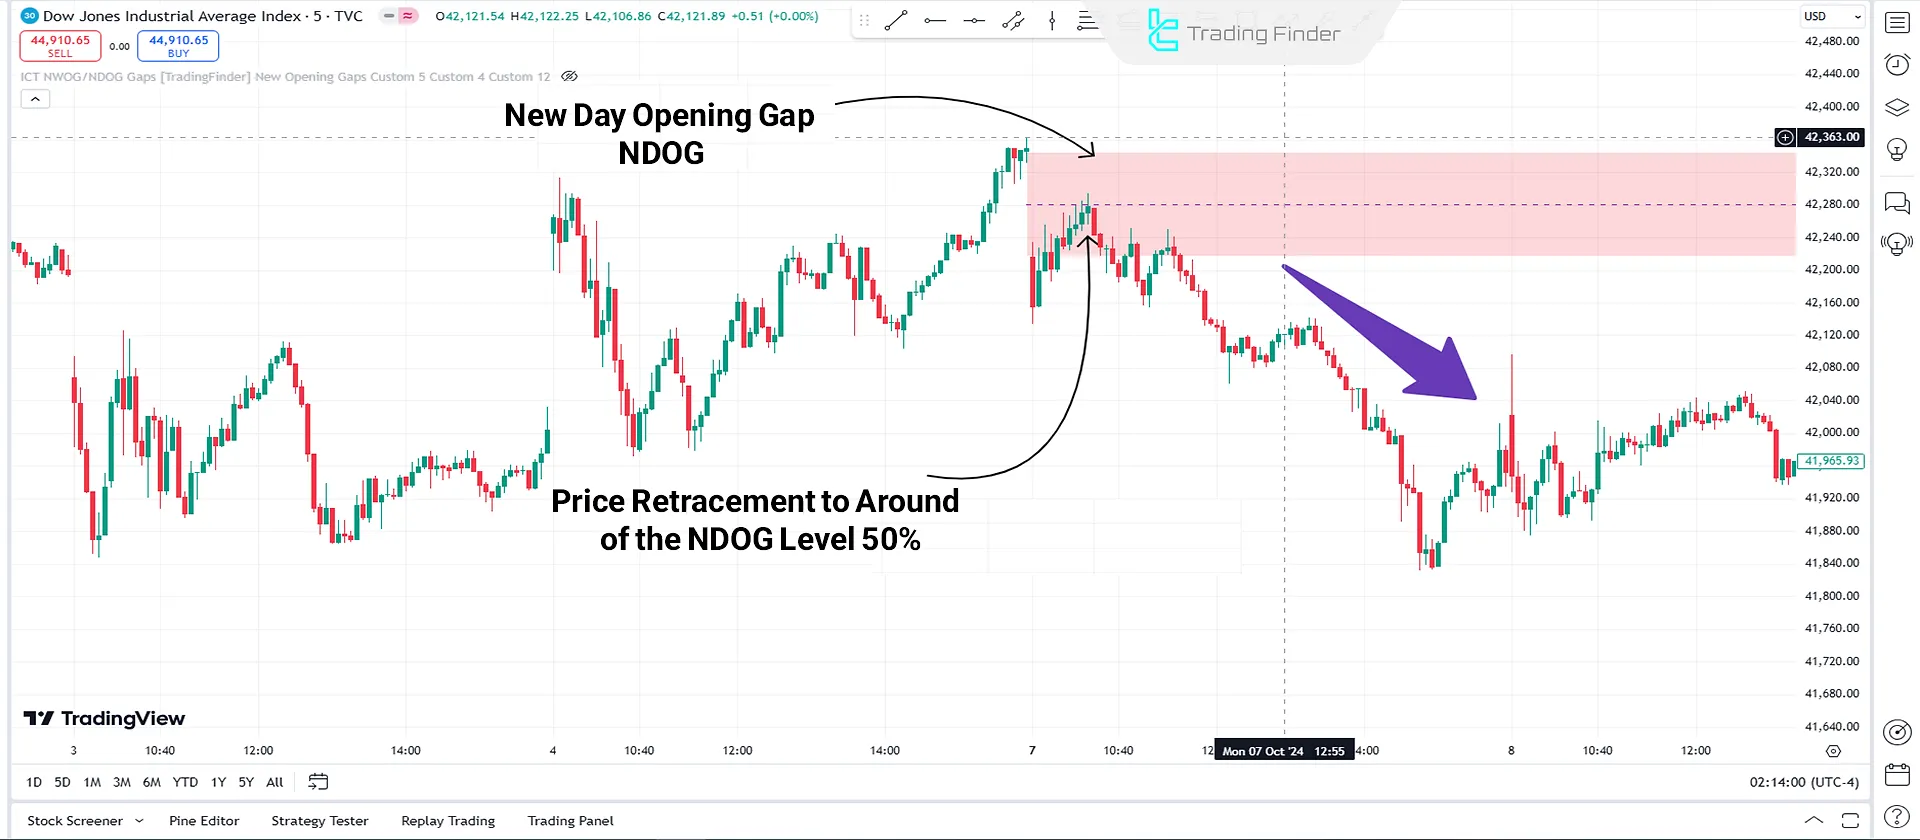
Example of Using NDOG in Buy-Side Trades
In this chart, after the formation of the New Day Opening Gap (NDOG), the price retraces with a corrective move toward approximately the 50% level of the gap and confirms that area as an active resistance.
The price reaction to the red zone indicates liquidity absorption and the beginning of a strong bearish move behavior that clearly represents the classic NDOG pattern in a sell-side scenario.
NDOG Indicator
The New Week Opening Gap / New Day Opening Gap Indicator (NDOG – NWOG) is a specialized tool for detecting and displaying price gaps at the beginning of the day and the week.
This indicator is designed to analyze price behavior at the moment of market opening and identify early imbalances, and in the ICT trading style, it is used as a practical tool for spotting liquidity zones.
Educational video on using the New Day Opening indicator:
After the market closes at the end of the day or week, the price usually begins trading at a different level upon reopening; the distance between these two levels is the gap or “Opening Gap.” The indicator displays the daily gap (NDOG) in green and the weekly gap (NWOG) in red on the chart so that the trader can quickly identify reactive areas in the market.
These gaps often act as support or resistance, and price behavior around them can define a reversal or continuation scenario. In addition to displaying these levels, the indicator highlights potential entry and exit areas in both bullish and bearish trends.
For example, in an uptrend, a price touch of the NDOG usually creates a buying opportunity; in a downtrend, touching NDOG often increases the likelihood of a pullback or continued selling pressure.
Along with this, the indicator also covers the concept of PD arrays, which represent an average of NDOG and NWOG and create an important zone for liquidity analysis.
The indicator settings include enabling or disabling daily, weekly, monthly, and yearly gaps, selecting the number of candles used to calculate gaps, and an option to remove invalidated zones. These highly flexible settings allow the indicator to adapt to various asset classes (Forex, stocks, crypto, commodities).
Overall, the NDOG indicator is a powerful tool for identifying key price zones, analyzing liquidity, and executing gap-based trading strategies, and it is widely useful for day traders and swing traders.
NDOG Indicator Download Links:
- NDOG Opening Gap Indicator for MetaTrader 4
- NDOG Opening Gap Indicator for MetaTrader 5
- NDOG Opening Gap Indicator for TradingView
Comparison of NDOG Across Markets
Comparing markets using NDOG provides a better understanding of how this method applies to different trading conditions:
Markets | Frequent Gaps | Gap Impact | Gap Fill Likelihood |
Forex | Start of sessions | Moderate to high | High |
Stocks | Daily | High | Moderate |
Futures & Commodities | Weekends and overnight | Moderate to high | Moderate to high |
Indices | Daily | High | Moderate |
Cryptocurrency | Less frequent | Moderate | Low |
Bonds | News-driven | Moderate | Moderate |
Conclusion
The NDOG (New Day Opening Gap) is a straightforward yet effective trading method for analyzing market behavior during daily openings. This approach helps identify profitable opportunities during early market volatility. However, success in this style requires proper risk management, practice, and experience.
Especially in highly volatile markets, accurately interpreting the price reaction to the gap and identifying a reversal or continuation scenario plays a decisive role in trade quality and the trader’s performance consistency.


