


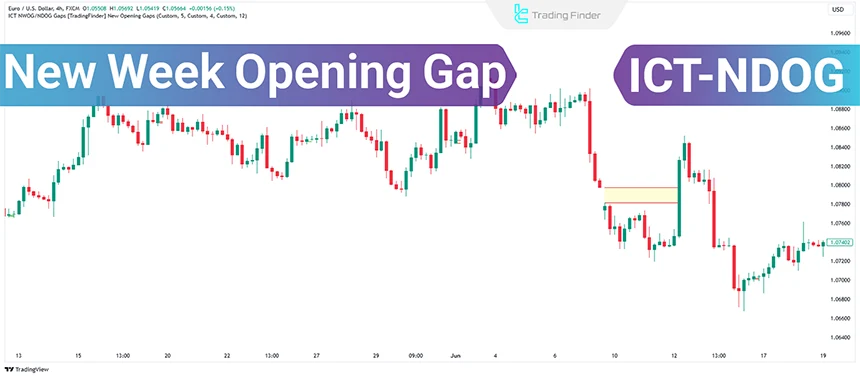
The New Week Opening Gap (NWOG) refers to the price gap between the market's closing price on Friday and its reopening on Monday.
NWOG gaps can be either bullish (when the market opens higher than the previous week's close) or bearish (when the market opens lower than the previous week's close.)
This analytical method is used to analyze liquidity flow and implement ICT trading strategies.
What Is the New Week Opening Gap?
The New Week Opening Gap (NWOG) refers to the price difference between the market close at the end of the week and the market open at the beginning of the following week.
This gap forms because the market is unable to trade during the weekend, while order flow, economic news, global events, and liquidity changes continue to occur. The result of this hidden liquidity shift is the appearance of a price gap on the first candle of the week.
Training on How to Trade New Week Opening gap from the Writo-Finance website:
Advantages and Disadvantages of NWOG
Understanding the strengths and weaknesses of the New Week Opening Gap helps traders properly evaluate the application of NWOG and use it as a complementary tool in liquidity flow analysis.
Table of Advantages and Disadvantages of the New Week Opening Gap:
Advantages | Disadvantages |
Determining the medium-term market direction | Possibility of delayed gap filling |
Identifying weekly liquidity zones | High sensitivity to weekend news |
Creating a clear structure for weekly bias | Requires multi-timeframe confirmations |
Ability to combine with PD Arrays and ICT tools | Weak performance in low-volatility markets |
Suitable for swing and medium-term trades | Risk of rapid gap break at the start of the week |
Providing high-probability entry points | Possibility of unreliable gaps in 24-hour markets |
Displaying weekly support and resistance zones | Strong dependence on the structure of the weekly closing candle |
Helping identify reversal or continuation points | Possibility of errors during major economic data releases |
Why Does NWOG Occur at the Start of the Week?
Trading halts at the end of the week, and the market closes. However, unexpected events such as wars, natural disasters, or political developments over the weekend may impact prices.
These influences are reflected in the market's opening price at the start of the new week, leading to the formation of a gap.
Educational video on the New Day Opening Gap from the Solomon King YouTube channel:
How to Identify a New Week Opening Gap?
To identify an NWOG, mark the closing price on Friday and the opening price on Monday. This price difference is called an NWOG or a liquidity void because no trades occur within this range.
NWOG gaps occur when the Friday closing price differs from the Sunday opening price. These gaps often act as “liquidity attraction zones”, meaning prices tend to return to these levels to correct imbalances.
For instance, if a bullish NWOG appears without wicks at the start of the week, it may indicate strong buying pressure and an increased likelihood of a continued upward trend.
The Importance of NWOG in ICT Analysis
In ICT analysis, NWOG & NDOG gaps are critical for identifying key support resistance levels andliquidity attraction zones. These gaps may indicate strong buying or selling pressure, helping traders anticipate price movements.
How to Trade NWOG?
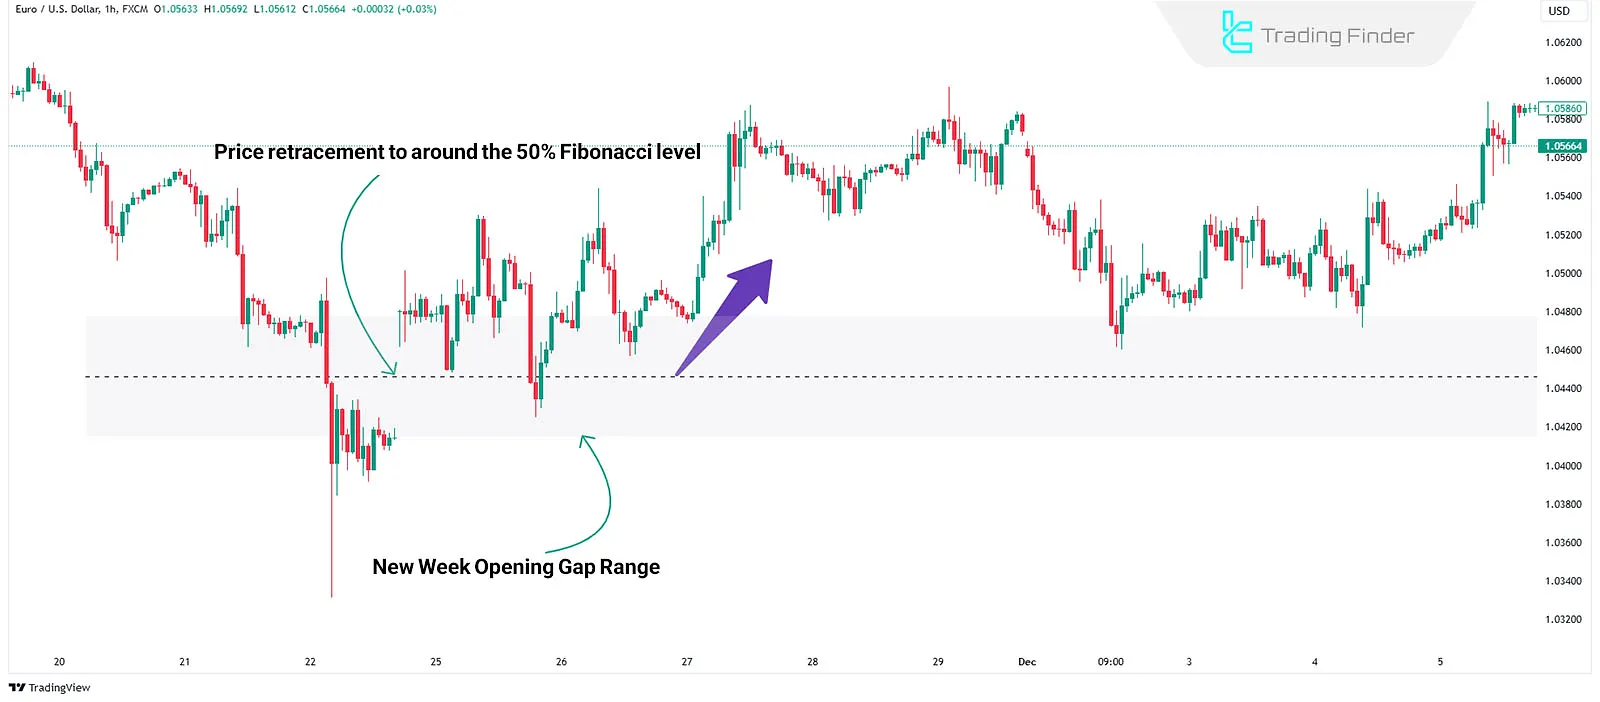
Approaching the 50% level of the gap often results in significant price reactions, making it a strategic entry point. Use Fibonacci tools to determine the 50% level accurately.
Note: Fibonacci levels should include 0, 1, and 0.5.
Trading Strategies Based on NWOG
The use of price gaps in NDOG analysis is usually divided into two main approaches, each of which follows a different logic of liquidity behavior.
Determining whether price intends to continue its move or return to the gap to rebalance the imbalance forms the basis for choosing between these two strategies. Review of strategies applicable in NWOG:
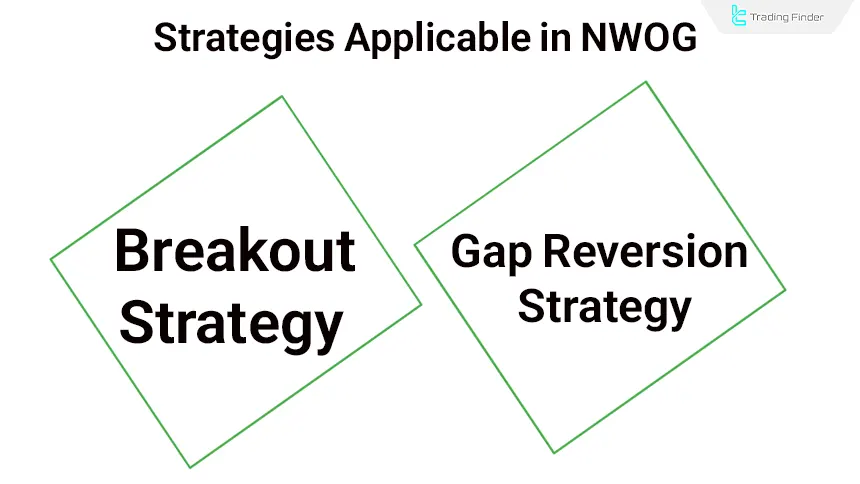
- Breakout Strategy: Enter a trade when the price breaks out of the gap range and continues in the same direction;
- Reversion to the Gap Strategy: Enter a trade when the price returns to the gap and reverses from the gap level.
Using Different Timeframes for NWOG Analysis
Analysis of the Weekly Opening Gap (NWOG) becomes more accurate and reliable when it is examined across multiple timeframes in a layered manner.
Each timeframe plays a specific role in determining direction, confirming the trend, and identifying entry points, and combining these levels provides a coherent picture of market behavior. Application of different timeframes in NWOG analysis:
- Weekly Charts: Identify NWOGs within the weekly framework and assess the overall market direction;
- Daily and 4-Hour Charts: Confirm price movement toward or away from NWOG in lower timeframes;
- 1-Hour and Lower Charts: Pinpoint entry points and observe price reactions near NWOG.
Bullish NWOG Trading
In bullish scenarios, price behavior relative to the NWOG is the main criterion for identifying the support zone and the appropriate entry timing.
Price reaction to this level determines whether the market is recovering liquidity or continuing its move, and based on this, two common structures are defined for bullish entries.
For bullish sentiment, the strategy splits into two scenarios:
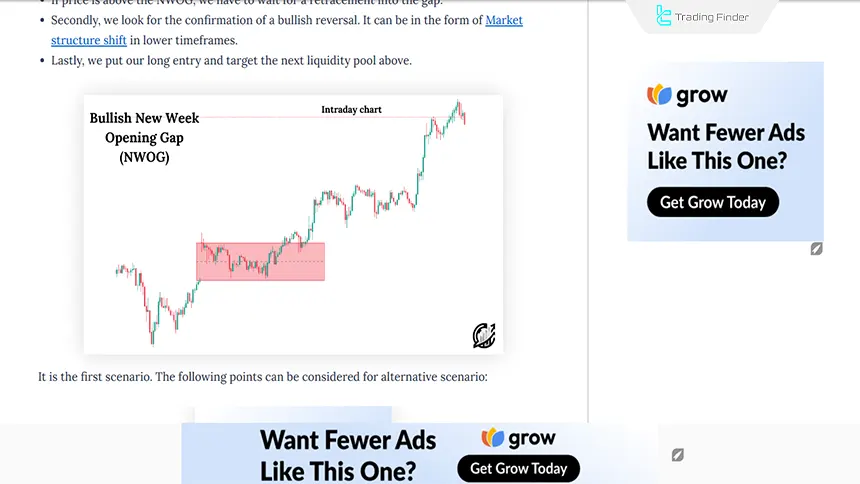
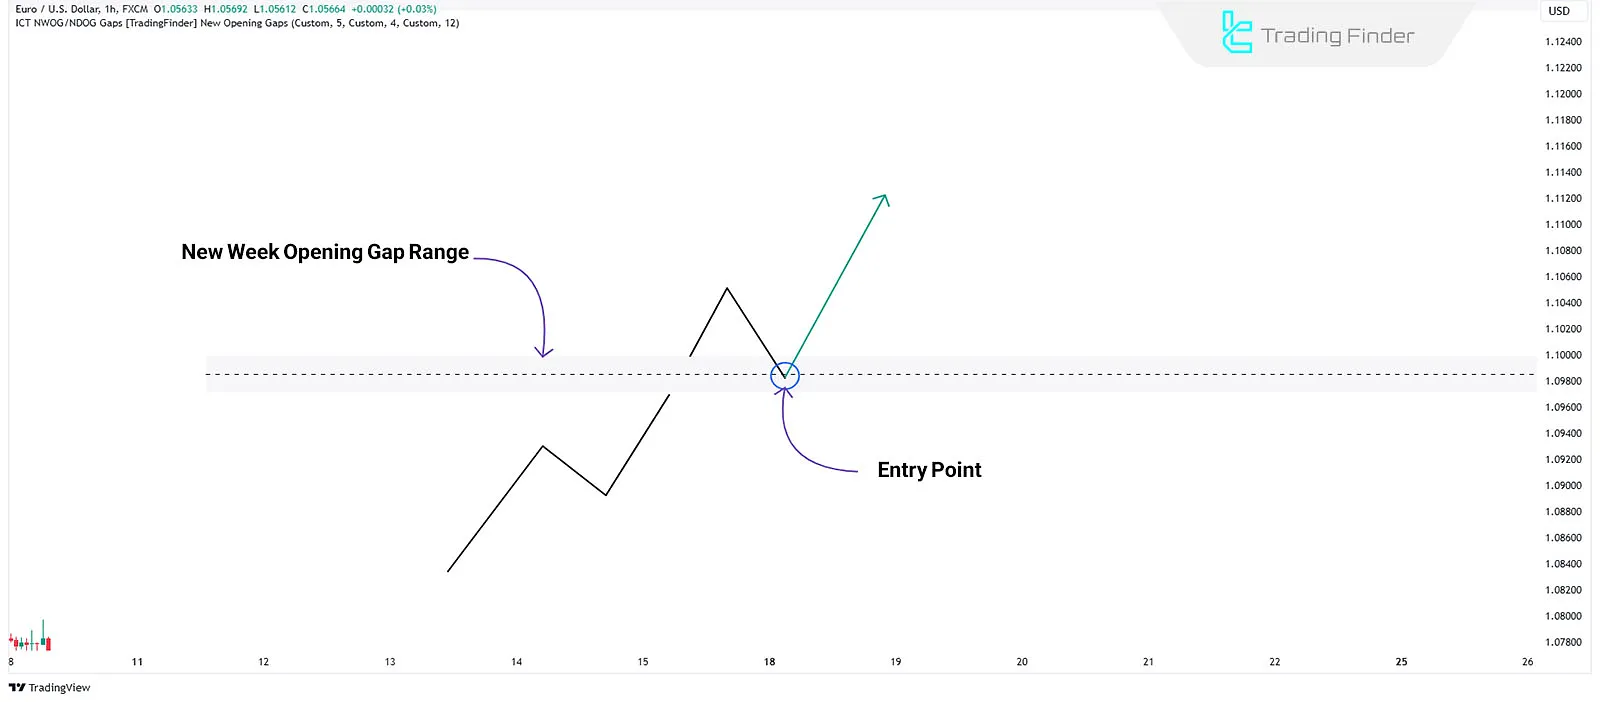
#1 Price Above NWOG
When the price retraces to NWOG and shows reversal signs in lower timeframes (Like MSS), it takes a buy position targeting the next liquidity level.
#2 Price Below NWOG
When the price approaches NWOG and closes above it, use this level as price support for long trades.
Example of Using NWOG in a Bullish Market
In this chart, the New Week Open Gap (NWOG) is marked and the price has made a valid bearish reaction after returning to this area.
The price closing below the NWOG area confirmed this level as weekly resistance and the specified entry point was chosen based on the breakdown of the structure on a lower timeframe.
The continuation of the downward movement after touching the NWOG is a clear example of how this gap works in a selling scenario and liquidity behavior at the beginning of the week.
Bearish NWOG Trading
In bearish scenarios, price behavior relative to the NWOG is the main criterion for identifying the resistance zone and the dominant market scenario.
The way price interacts with this level determines whether a reversal occurs or selling pressure continues.
For bearish sentiment, the New Week Opening Gap strategy splits into two scenarios:
- Price Below NWOG: When the price retraces to NWOG and shows reversal signs in lower timeframes, take a sell position targeting the next liquidity level;
- Price Above NWOG: When the price approaches NWOG and closes below it, use this level as price resistance for short trades.
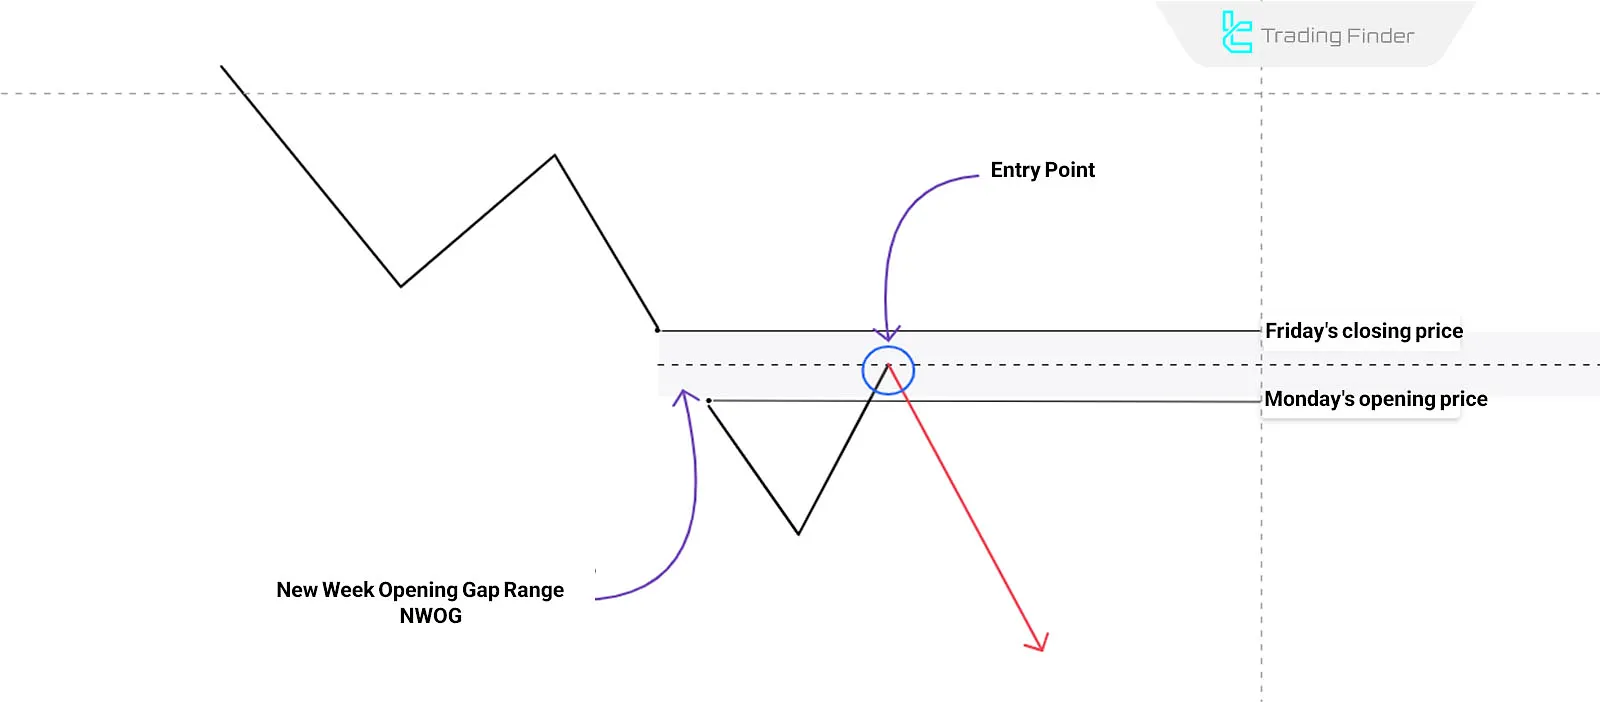
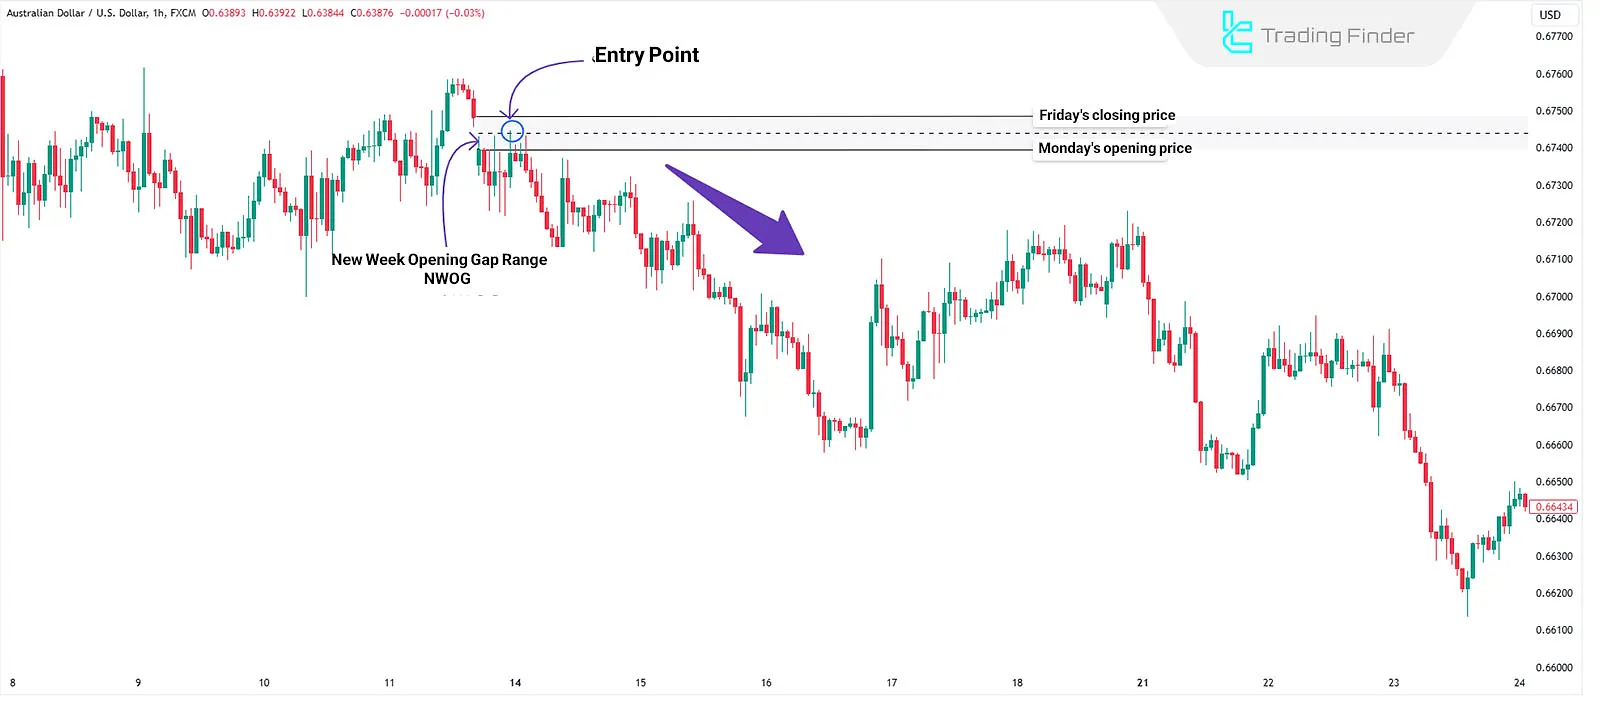
Example of Using NWOG in a Bearish Market
In this chart, the New Week Opening Gap (NWOG) is identified, and after price returns to this zone, a valid bearish reaction is formed.
The price closing below the NWOG range confirms this level as weekly resistance, and the marked entry point is selected based on a market structure break on a lower timeframe.
The continuation of the bearish move after touching the NWOG is a precise example of how this gap functions in sell scenarios and reflects liquidity behavior at the start of the week.
Challenges and Limitations of the Weekly Opening Gap (NWOG)
The weekly opening gap, or “NWOG”, is one of the common phenomena in 24-hour markets, formed due to the of price flow at the end of the week and reopening under new trading conditions.
Despite the role of these gaps in revealing liquidity jumps, inefficiencies, and price imbalances, their use in analysis and trading decision-making comes with challenges and limitations. Types of challenges and limitations of the New Week Opening Gap:
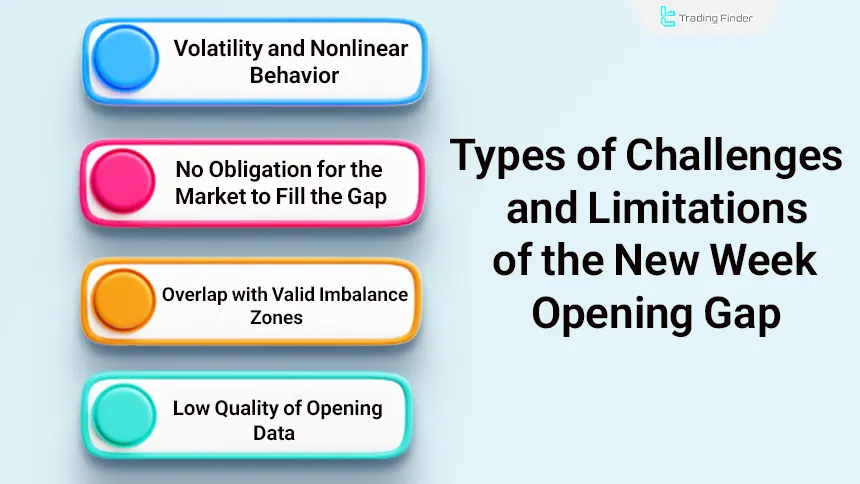
Volatility and Nonlinear Behavior
Rapid price movement in the initial moments after the market opens makes it difficult to define a valid structure and identify liquidity zones. Many of the price actions recorded in the first seconds lack real volume backing and can generate false signals.
In such conditions, early market reactions are mostly driven by order imbalance and position rebalancing. Waiting for candle stabilization and the formation of a clear structure significantly reduces the probability of misinterpreting price behavior.
No Obligation for the Market to Fill the Gap
Contrary to common belief, NWOG has no structural obligation to be fully filled or to return to its origin zone.
In many cases, the gap merely acts as a liquidity layer, and after being tapped, the market chooses a different path. Understanding this prevents unrealistic expectations for late counter-structure entries.
Overlap with Valid Imbalance Zones
The New Week Opening Gap sometimes creates a visual overlap with FVG, leading to misinterpretation of the nature of the move.
Distinguishing whether the gap is driven by order flow or is merely the result of reopening requires precision and detailed evaluation on higher timeframes.
This distinction becomes clearer when acceptance or rejection of price relative to the gap and the presence of a valid strong continuation move are examined.
Low Quality of Opening Data
The opening candle of the week usually includes sudden jumps and wide spreads that do not directly reflect institutional market behavior. Overreliance on this candle leads to calculation errors in identifying BOS, MSS, or the positioning of premium and discount zones.
It is better to evaluate valid market structure after subsequent candles stabilize and balance forms in order flow, to avoid misinterpretation of structure.
New Week Opening Indicator
The NWOG indicator is an analytical tool designed to identify and display price gaps at the beginning of a new week (NWOG). These gaps form when the market closes at the end of the day or week while order flow, news, and liquidity changes continue in the background.
The difference between the closing and opening price is known as the “Opening Gap”, and the indicator displays these zones on the chart in red for weekly gaps and green for daily gaps. Tutorial video on using the NWOG indicator:
These gaps usually act as dynamic support or resistance, and price tends to revisit or fill them; therefore, the indicator can identify suitable entry and exit points in trend-following or reversal trades.
This tool is highly useful in the Smart Money and ICT style, and by identifying initial imbalances, it simplifies daily and weekly liquidity analysis.
One of the indicator’s important features is displaying the PD Array-a concept that provides an average of NDOG and NWOG and creates a structural zone for medium-term analysis.
The indicator’s performance in bullish and bearish trends is clearly demonstrated in the provided examples.
In an uptrend, a price pullback to the NWOG can serve as a point to initiate a new move, while in a downtrend, touching the daily gap usually creates a suitable opportunity for sell trades.
The indicator settings are flexible and allow enabling or disabling daily, weekly, monthly, and yearly gaps. The number of candles used to calculate each gap is adjustable, and there is also an option to remove invalidated zones.
These settings make the indicator compatible with various markets (including Forex, stocks, commodities, crypto, and forward markets).
Overall, the NWOG–NDOG indicator is a powerful tool for ICT-style traders, and by accurately displaying gap zones, it helps improve decision-making for daily and weekly trends. This indicator is suitable for day traders, swing traders, and medium-term traders.
Links to Use the NWOG Indicator:
- Weekly Opening Gap indicator for MetaTrader 4
- Weekly Opening Gap indicator for MetaTrader 5
- Weekly Opening Gap indicator for TradingView
Comparison of Markets Using NWOG
The behavior of weekly gaps in each market is shaped by that market’s trading structure, active hours, and the type of liquidity flow.
For this reason, NWOG forms different patterns across various assets, and understanding these differences helps traders develop more realistic expectations of how price will react to the gap. NWOG's performance in different markets is as follows:
Forex | Weekly gaps tend to fill quickly |
Stock gaps | Gaps are typically tied to company-specific news |
Commodities | Global events significantly impact gaps |
Cryptocurrencies | Irregular gaps occur due to the 24-hour nature of the market |
Futures | Gaps are key indicators for identifying critical liquidity zones |
Indices | Weekly gaps are more predictable than other markets |
Conclusion
NWOG gaps help traders identify critical price levels and trading opportunities. These gaps are especially significant at the start of the week, reflecting the market's reaction to weekend events. By combining NWOG with other analytical tools, traders can capitalize on the new week's opening gaps.
Also, analyzing price behavior in the initial moments after the market opens can provide important signals about liquidity direction. Combining NWOG with market structure and multi-timeframe confirmations significantly increases analytical accuracy and the quality of entry points.


