


The ICT One Shot One Kill trading strategy is developed based on institutional trading concepts; this approach is used to identify one or two weekly setups with the goal of achieving 50 to 75 pips of profit.
In this ICT Trading model, analysts first evaluate the Weekly Bias and Draw on Liquidity. Then they wait for major economic data releases, such as the FOMC or NFP, to clear liquidity and capitalize on these opportunities.
What is The One Shot, One Kill (OSOK) Trading Strategy?
By understanding the ICT One Shot, One Kill model, traders can reduce the number of trades while improving their success rate.
The ICT One Shot One Kill (OSOK) model is a trading plan to secure 50 to 75 pips per trade (for similar assets like EUR/USD). Using this model, you can identify one or two weekly setups.
The Trader’s Viewpoint in this Strategy Includes the Following:
- Entering at moments with very high probability of success;
- Avoiding multiple consecutive trades;
- Professional waiting until price reaches liquidity zones;
- Choosing one high-quality position instead of several low-precision trades.
Key Components of Executing the "One Shot, One Kill" Setup
The ICT One Shot, One Kill strategy targets 50-75 pips per week and focuses on:
- Determining Weekly Bias and analyzing liquidity;
- Aligning with high-impact economic events;
- Strategically entering specific Kill Zones during London or New York sessions.
This strategy emphasizes patience, precision, and optimal trade entry (OTE).
Entry points are formed between 61.8% and 78.6% retracement levels. Such an approach allows traders to profit from institutional moves while maintaining strict risk management protocols.
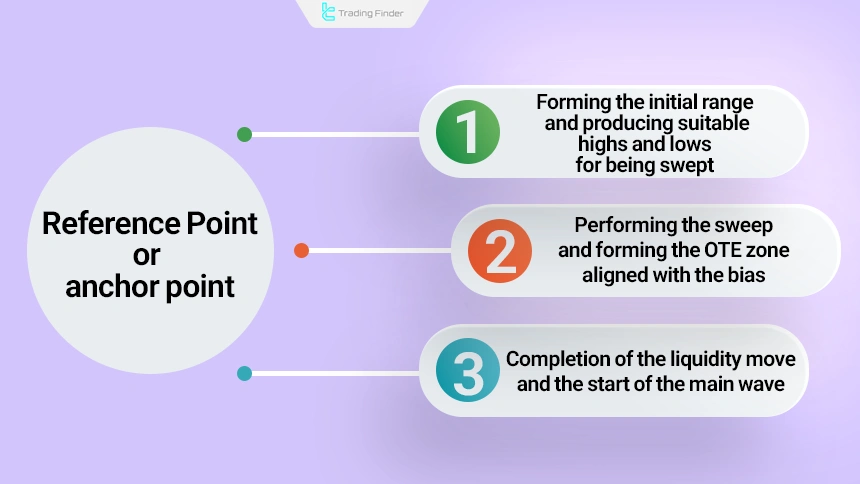
What is the Reference Point or Anchor Point and Why are Monday to Wednesday Important?
The reference point or Anchor Point is a point where the market collects the weekly liquidity fuel and forms the foundation for the start of the main move.
This point is usually formed during the first three days of the week and creates a consistent pattern within the institutional structures of ICT.
The usual flow of the Reference Point includes the following:
- Monday: Forming the initial range and producing suitable High and Low for being swept;
- Tuesday: Performing the Sweep and forming the Optimal Trade Entry (OTE) zone aligned with the bias;
- Wednesday: Completion of the liquidity move and the start of the main wave.
This sequence has been repeatedly observed in price architecture and acts as a key pillar in the OSOK structure.
Step-by-Step Guide to Mastering the ICT OSOK Strategy
To master the One Kill pullback setup, it is necessary that the predetermined steps be executed with precision and discipline so that the market structure is correctly interpreted and a lower-risk entry point is achieved.
The five stages of executing the One Shot One Kill strategy include the items whose observance in order prevents rushed entry and provides the possibility of identifying the right time to capture the main market move.
#1 Preparation
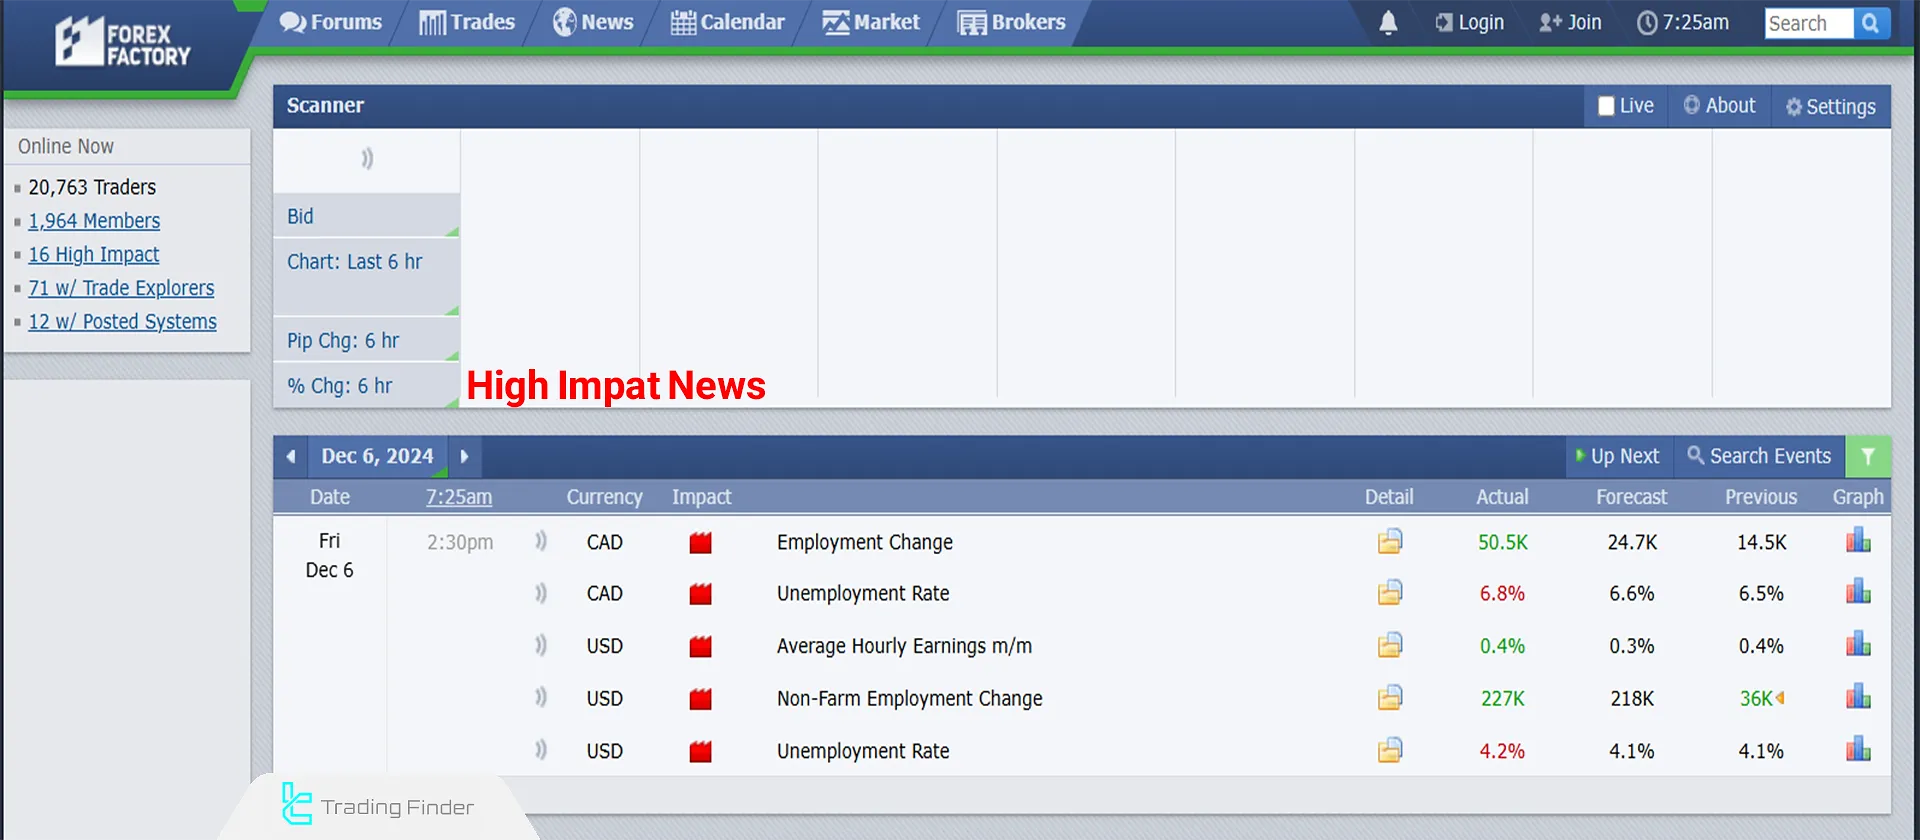
Economic data release significantly impacts market volatility and creates trading opportunities within the ICT framework.
Guidelines for utilizing economic events include:
- Note all medium and high-impact economic events for the targeted market;
- Analyze upcoming economic events and their potential influence on the current market structure. This analysis helps to identify weekly market change patterns.
Key market-impacting news includes:
- Interest rate decisions
- Inflation reports (CPI, PCE, PPI)
- Employment data
- Economic growth figures (GDP)
- Manufacturing sector surveys
The most significant market movements typically occur during the London session, particularly in the first hour after opening.
Traders using the ICT model should pay special attention to these periods to identify potential breakout or reversal opportunities.
After analyzing economic events:
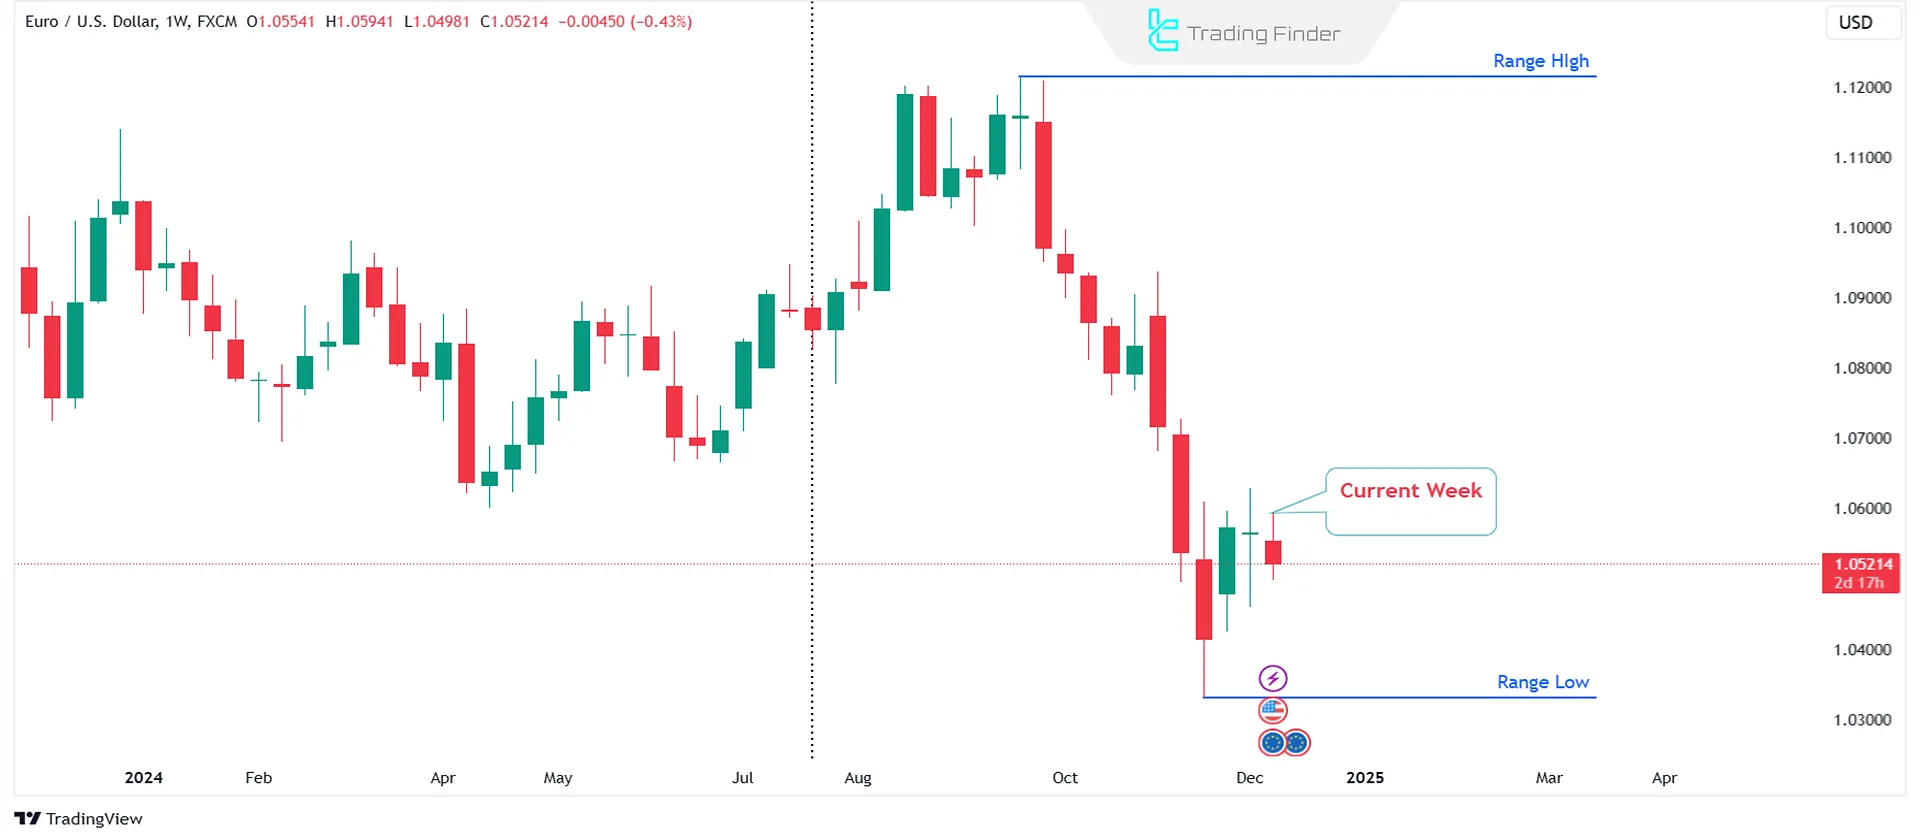
- Refer to the weekly chart
- Determine the IPDA data range for the past 20 weeks
- Identify the highest high and lowest low of the past 20 weeks
- Search for the next Draw on Liquidity within the trading range
- Look for the PD array aligned with the weekly Bias
The price will move towards the PD array in the following trading week, as influenced by economic news. This volatility injection due to the news is the event to wait for.
#2 Identifying Opportunities
Locate a range of 50 to 75 pips. In the presence of bullish order flow (OF), the target is buy-side liquidity (BSL). In bearish order flow, the target is sell-side liquidity (SSL).
#3 Trading Plan
As the market prepares to decline, find the convergence of price manipulations against the Weekly Bias.
This action is beneficial when the economic calendar indicates potential increased volatility. Then, wait for the buy-side Liquidity to be swept to execute the sell trade.
#4 Trade Execution
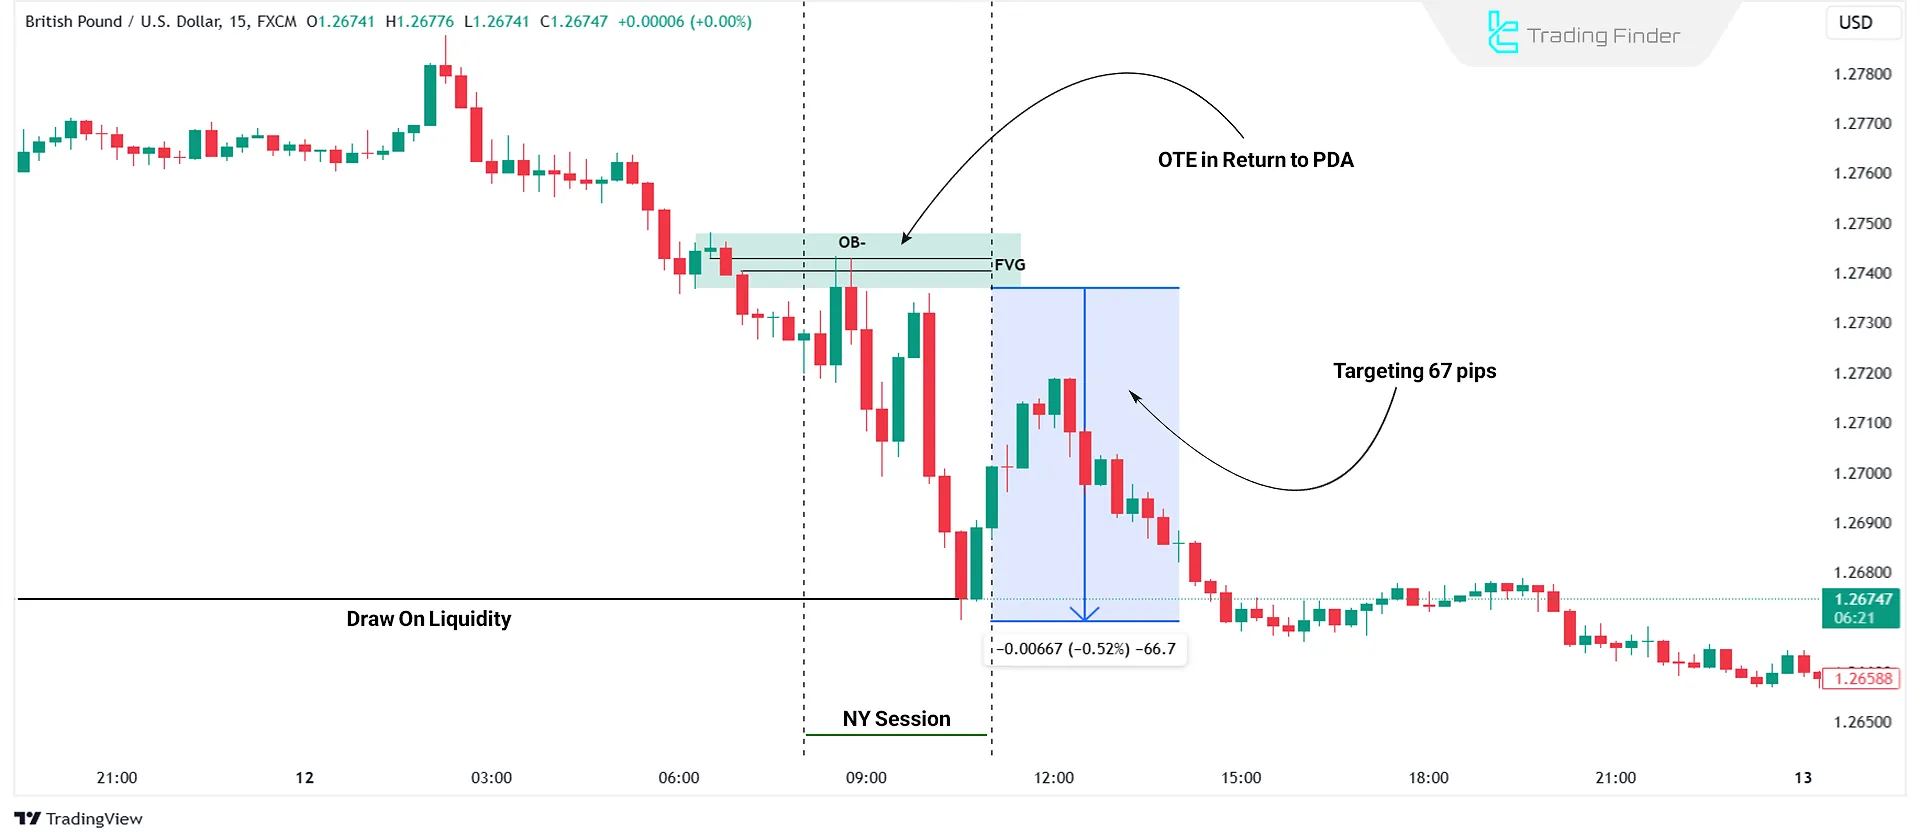
In a bearish bias scenario, expect an optimal trade entry (OTE) on the retracement towards a bearish PD array [on the 15-minute chart] during the London session or New York Kill Zone.
Alternatively, wait for an attack on buy stops to execute your short trade.
Successful trade execution requires patience, as traders often wait for precise setups aligned with pre-defined criteria.
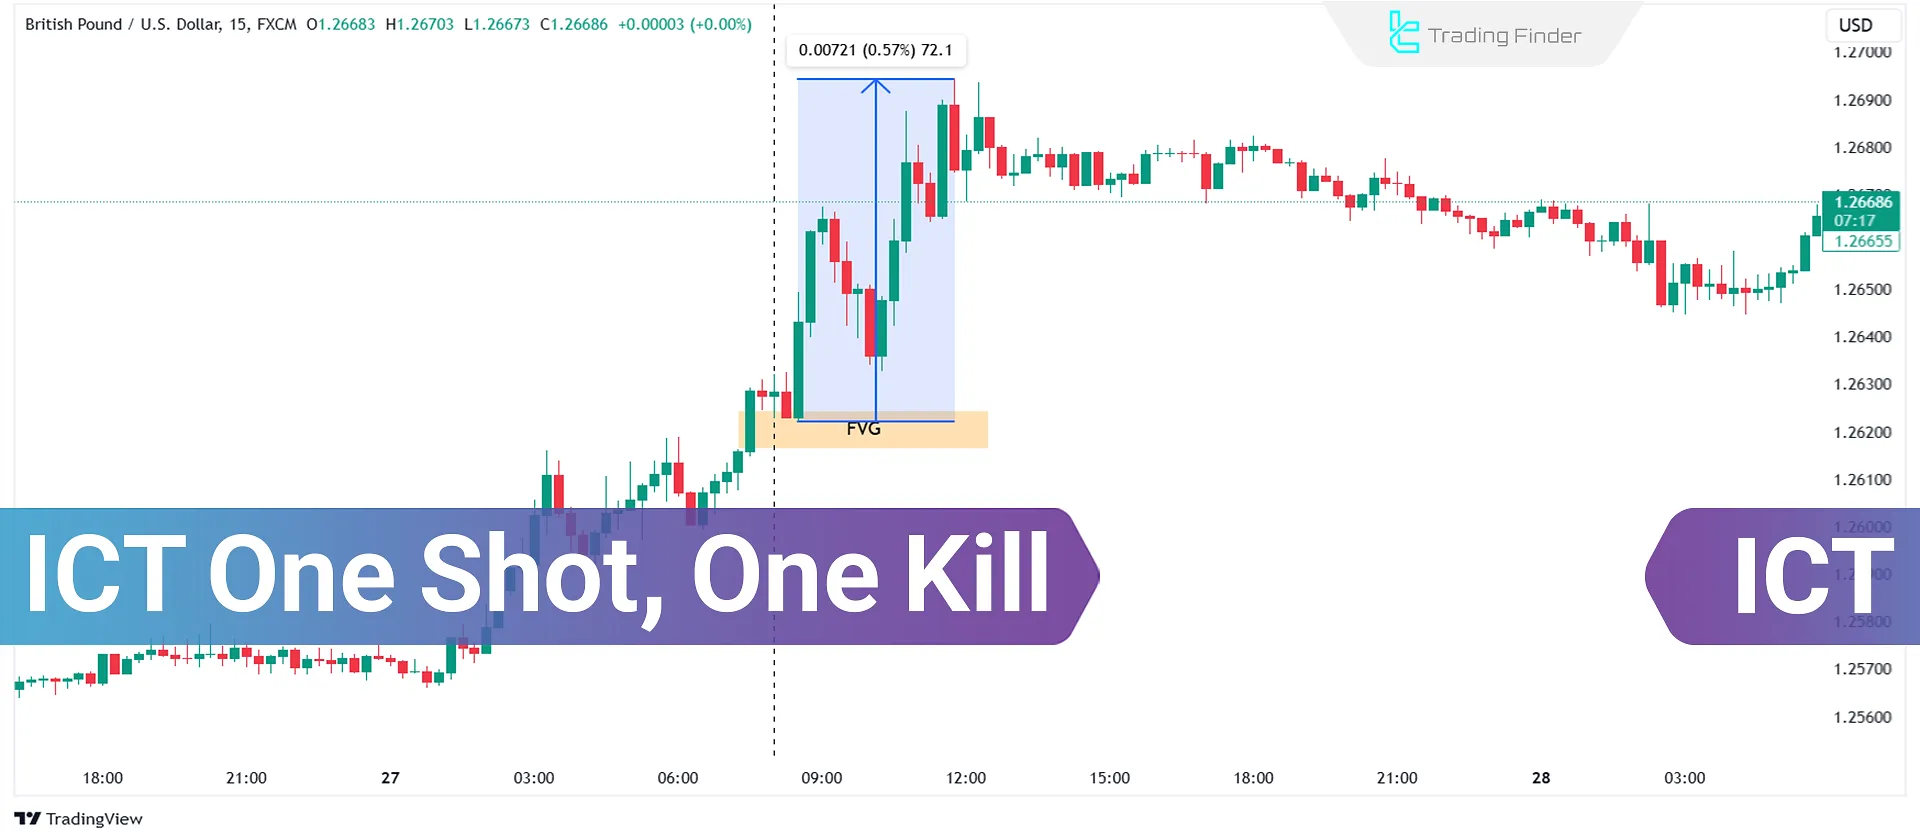
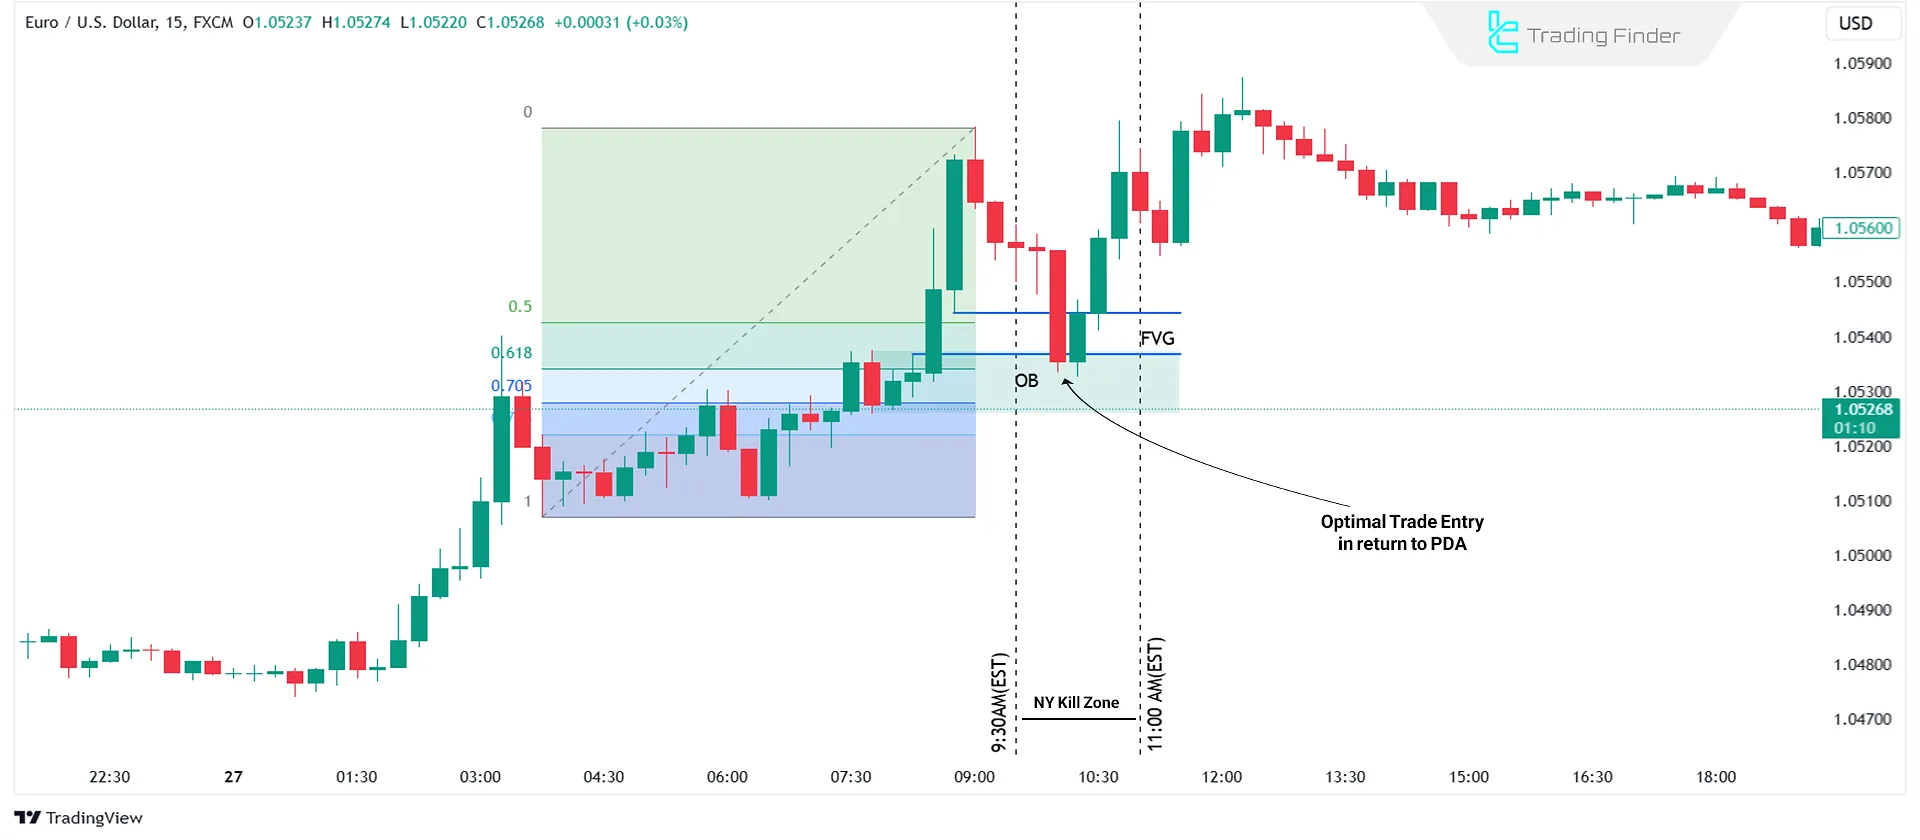
In the image below, an example of a bullish One Shot, One Kill setup on the EUR/USD chart is shown.
#5 Trade Management
Avoid placing stop losses at obvious levels that are likely to be targeted by market makers.
Instead, stops should be positioned beyond key market structure points to allow natural price movement while protecting capital.
In bullish OSOK setups, stop losses are placed below critical order blocks, while in bearish scenarios, they are placed above significant order blocks.
Set a limit order for take-profit levels to capture 50 pips as the initial target. Manage the setup using one order: close 80% of the trade volume at 50 pips profit and leave the remainder to achieve 75 pips.
The instructional video on the Londo2k channel on YouTube has reviewed the One Shot One Kill setup in real conditions. Interested traders can refer to this video for a deeper understanding of the setup.
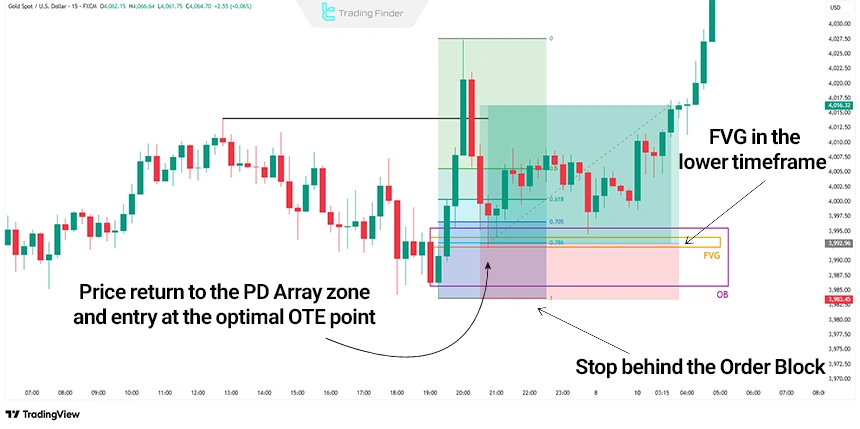
Real Example of Bullish OSOK Setup
In the chart below, the market first swept the previous high and collected the required liquidity. Then, on the 15-minute timeframe, the price retraced to the bullish PD Array zone, and the price entering the weekly Order Block stabilized the structure.
- Direct passing through the Fair Value Gap (FVG) and stabilization in the 62–78% Fibonacci (Fibonacci OTE) retracement zone;
- Placing the stop loss behind the valid Order Block (OB);
- Recording a 50-pip move in less than one London session and activation of the 75-pip target.
Advantages and Disadvantages of the One Shot One Kill Strategy
The One-Shot approach in trading, by focusing on medium-term bias, liquidity zones and price structure, targets entry quality instead of trade quantity, and this characteristic creates a set of structural advantages and limitations in its performance, which are examined in the table below:
Advantages | Disadvantages |
Reducing trading risk by focusing on low-count setups | Need for high patience for the formation of an accurate setup |
Suitable for traders with limited time and without constant monitoring ability | Limited number of weekly trading opportunities |
Increased analytical accuracy due to choosing very high-quality setups | High dependence on correct analysis of weekly bias and market structure |
Less stress due to fewer decisions and trades | Possibility of no setup formation during the week |
Common mistakes in executing the OSOK strategy
In executing the OSOK strategy, paying attention to the logical sequence of the setup and its alignment with market structure is essential; because even the smallest mistake in identifying liquidity, bias, or stop-loss placement can invalidate the entire trading idea.
The following are the most common mistakes that traders, especially beginners, make in this method:
- Entering before the liquidity sweep;
- Disregarding the weekly bias and entering against it;
- Placing the stop loss on obvious and easily hunted points instead of behind market structure;
- Ignoring the role of algorithmic price data and not examining the past 20 weeks’ range;
- Forcing setups and trying to trade in weeks where the standard OSOK conditions are not present.
The educational article on the One Shot One Kill setup in ICT style on the writofinance.com website provides further explanations about this trading model, which interested readers can use.
One Shot One Kill Indicator in TradingView and Metatrader
The OSOK indicator on the MetaTrader and TradingView platforms is one of the advanced tools for analyzing price behavior in ICT style.
It identifies important market zones by combining price action, liquidity structure, and the impact of economic data such as NFP and CPI.
By examining the highs and lows of several past candles and analyzing the price reaction relative to the CISD line, this indicator makes it possible to identify probable reversal or trend continuation points.
- Add the One Shot One Kill ICT indicator in TradingView
- Download the One Shot One Kill indicator in Metatrader5
- Download the One Shot One Kill indicator in Metatrader4
This tool is categorized among smart money, liquidity, reversal, and structural breakout indicators, and is suitable for advanced traders active in forex, cryptocurrency, indices, commodities, and stocks markets
One Shot One Kill usually signals with colored arrows that indicate the price entering key liquidity levels.
In a bullish scenario, when a minor news release occurs and the market breaks the last minor high in the downtrend, after the price returns to the CISD level, the indicator displays an upward arrow and issues a Buy trading signal.
This movement model indicates liquidity extraction above the highs and the market shifting toward a bullish flow.
In a bearish scenario, when the price breaks the previous low and then returns to the same zone, the indicator displays a downward arrow and provides a Sell warning.
According to ICT logic, this behavior indicates activation of liquidity under the lows and the probability of either the continuation of the bearish move or the beginning of a corrective swing.
One Shot One Kill has multiple settings including selecting the color theme, determining the daily review time, specifying the number of days related to the highs/lows, applying a volume or candle size filter, and making time difference adjustments.
These settings enable precise customization of the indicator’s behavior.
The One Shot One Kill ICT indicator, by focusing on liquidity, market structure, and economic news published on Forex Factory, precisely identifies suitable zones for entry.
As a specialized tool, it guides the trader in identifying key points of trend reversals or continuation.
Conclusion
Within the ICT One Shot, One Kill strategy, traders achieve profitability through detailed analysis of fair value gaps, liquidity voids, and market manipulation patterns.
This strategic approach, with strict risk management and precise execution, provides a robust framework for weekly profits. Success in the ICT One Shot, One Kill setup demands diligence, patience, and deep market comprehension.
You can also use the One Shot One Kill Indicator, offered exclusively by TradingFinder, which enables a seamless combination of the One Shot, One Kill strategy with the Market Maker model.
This unique integration not only simplifies the identification of key market structures but also enhances precision in trade execution, making it a powerful tool for achieving consistent profitability.


