


A swing high refers to the highest price level that forms after an upward move and is followed by a downward market movement. This area signals the beginning of a price correction or a major trend reversal.
Swings are typically recognized as points where buying pressure decreases. Price behavior in this area often indicates a shift in order flow and the market preparing to form a bearish structure or enter a corrective phase.
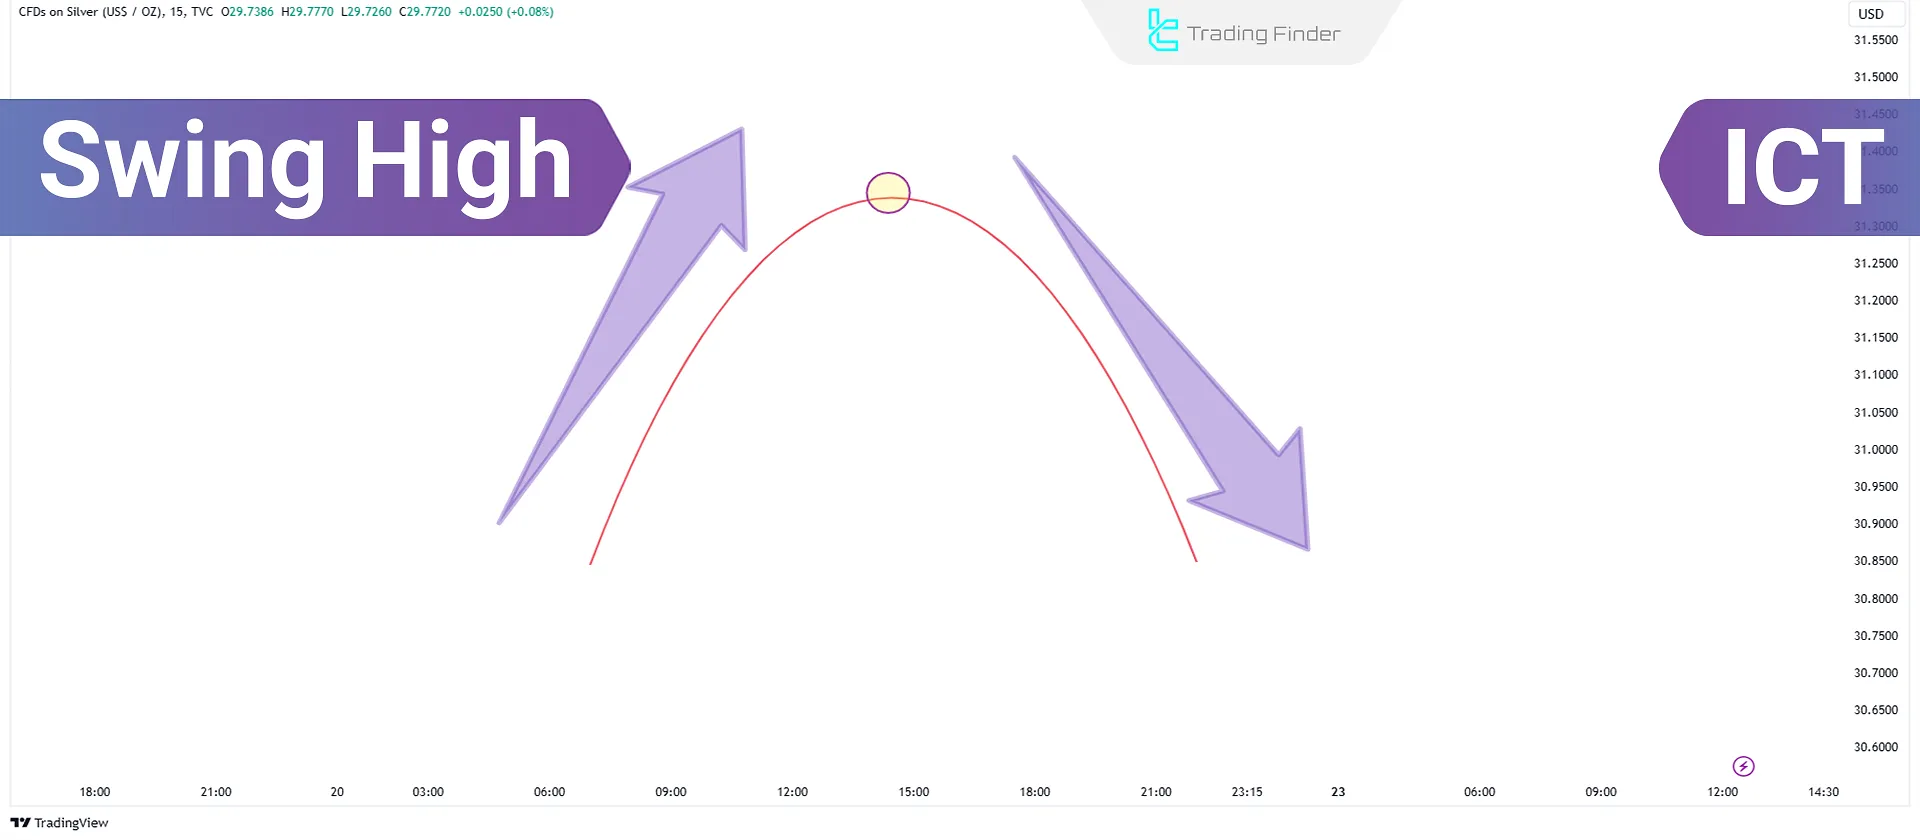
What is Swing High?
A swing high is a point in the market where the trend direction changes after reaching a peak price, and a downward move begins.
This pattern is commonly observed in technical analysis [especially in the ICT style] across various timeframes and helps understand market structure changes.
Identifying swing points training from IG.com:
Comparison of Swing Highs and Swing Lows
In technical analysis especially within the ICT methodology market swings form the foundation for identifying structure, trend, and liquidity behavior.
Although swing highs and swing lows both act as price turning points, they play different roles in order flow, liquidity, break of structure, and change of character.
The table below presents the key technical differences between these two structures. Comparison Table of Swing High vs Swing Low:
Feature | Swing High | Swing Low |
Structural Definition | The highest point in a bullish phase, with two surrounding candles having lower highs | The lowest point in a bearish phase, with two surrounding candles having higher lows |
Dominant Type of Liquidity | Sellers’ stop-losses and breakout buy orders | Buyers’ stop-losses and breakout sell orders |
Role in Market Structure | Defines structural resistance and trend highs | Defines main support levels and trend lows |
Impact on Break of Structure (BOS) | Its break confirms continuation of an uptrend | Its break confirms continuation of a downtrend |
Impact on Change of Character (CHoCH) | Breaking the last swing high in a downtrend gives an early trend-reversal signal | Breaking the last swing low in an uptrend gives an early trend-reversal signal |
Price Behavior After Tap | Often leads to a pullback or liquidity grab above the high | Often leads to a bounce or liquidity sweep below the low |
Importance in Smart Money Concepts | Area of clustered seller stop-losses and buyer targets | Area of clustered buyer stop-losses and seller targets |
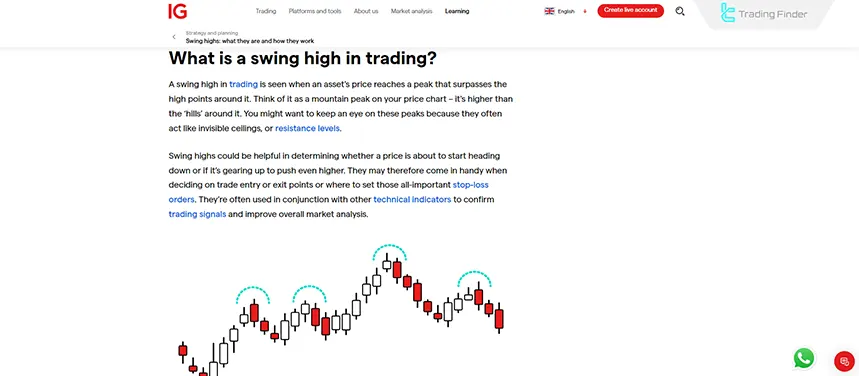
Swing High Structure
The swing high pattern resembles a triangle and is composed of three candles. The second candle has a higher high than the first and third candles, while the first and third candles have lower lows compared to the second candle.
Training video on using swing highs from the Dyer Dips Trading YouTube channel:
The pattern indicates the start of a bearish move and is used in market analysis to identify trend changes.
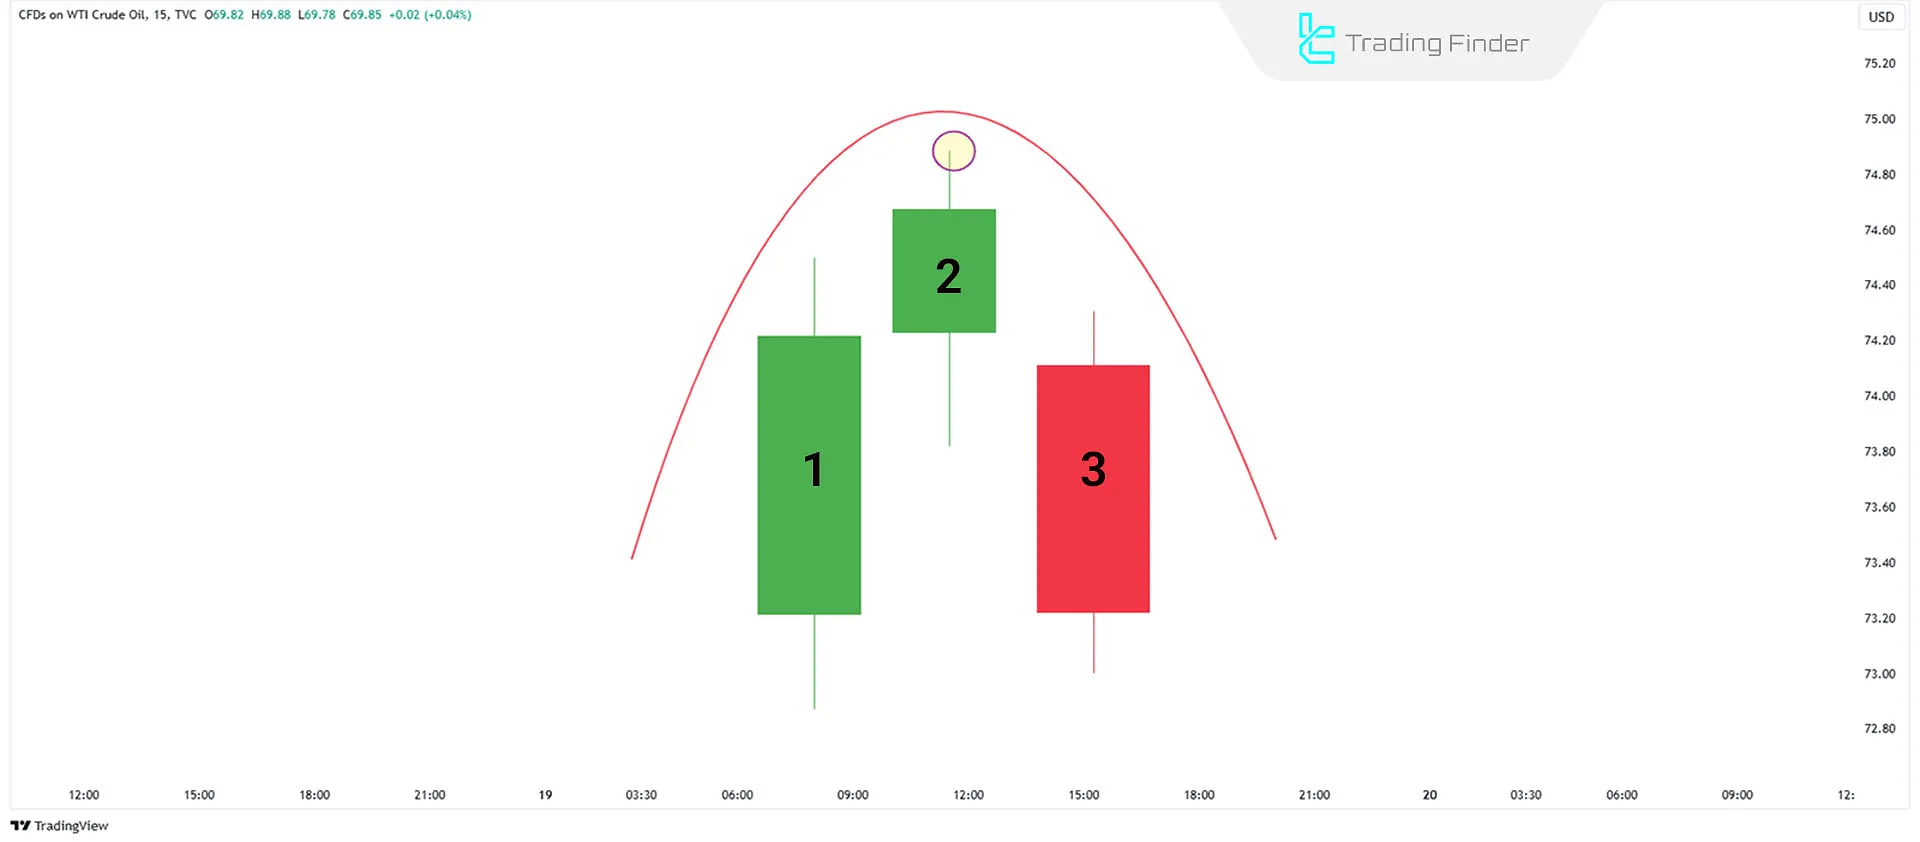
How to Identify a Swing High?
To identify a swing high, follow this step-by-step instruction:
- Identify the highest price point: Mark the highest point that the price has reached;
- Select the middle candle: Mark the candle formed at this point;
- Examine surrounding candles: The highs of the left and right candles must be lower than the high of the middle candle;
- Confirm the swing high: If the above conditions are met, the middle candle is recognized as a swing high.
Swing Highs in Market Structure
In the ICT methodology, swing highs serve as one of the core components of market structure. The break or defense of these levels determines order-flow direction, liquidity behavior, and phase transitions in the market.
A break of a swing high does not always confirm trend continuation; sometimes it is simply a liquidity grab or the beginning of a structural shift. Roles of swing highs in market structure:
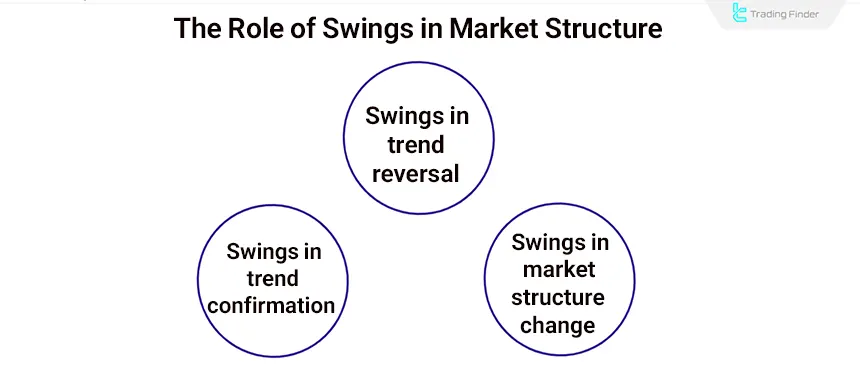
Swing Highs in Trend Confirmation
Trend confirmation is considered valid when price breaks above previous swing highs with a strong candle body. This type of break indicates that the dominant market direction is being maintained.
Characteristics of a valid BOS (Break of Structure) at swing highs:
- Candle closes above the swing high
- No rapid pullback after the breakout
- Lack of long rejection wicks
- Sufficient momentum and liquidity accompanying the move
Swing Highs in Trend Reversal
A change of character (CHoCH) is the first signal of a structural reversal.
This becomes reliable when the market breaks the last swing high connected to the current trend, specifically the swing high that defines the structure line of that trend.
Once this level is broken, order-flow dominance shifts, and the market transitions from a trending phase into a transitional phase.
Swing Highs in Market Structure Shift (MSS)
In a Market Structure Shift (MSS), the market does more than simply break one swing high. This usually occurs after liquidity has been collected above a swing high (a manipulation phase).
ICT Market Structure Shift (MSS) algorithm:
- Price takes the liquidity above the swing high (Stop Hunt);
- It quickly reverses with strong candles;
- It breaks the first swing high in the opposite direction of the previous trend;
- That break establishes the market structure shift.
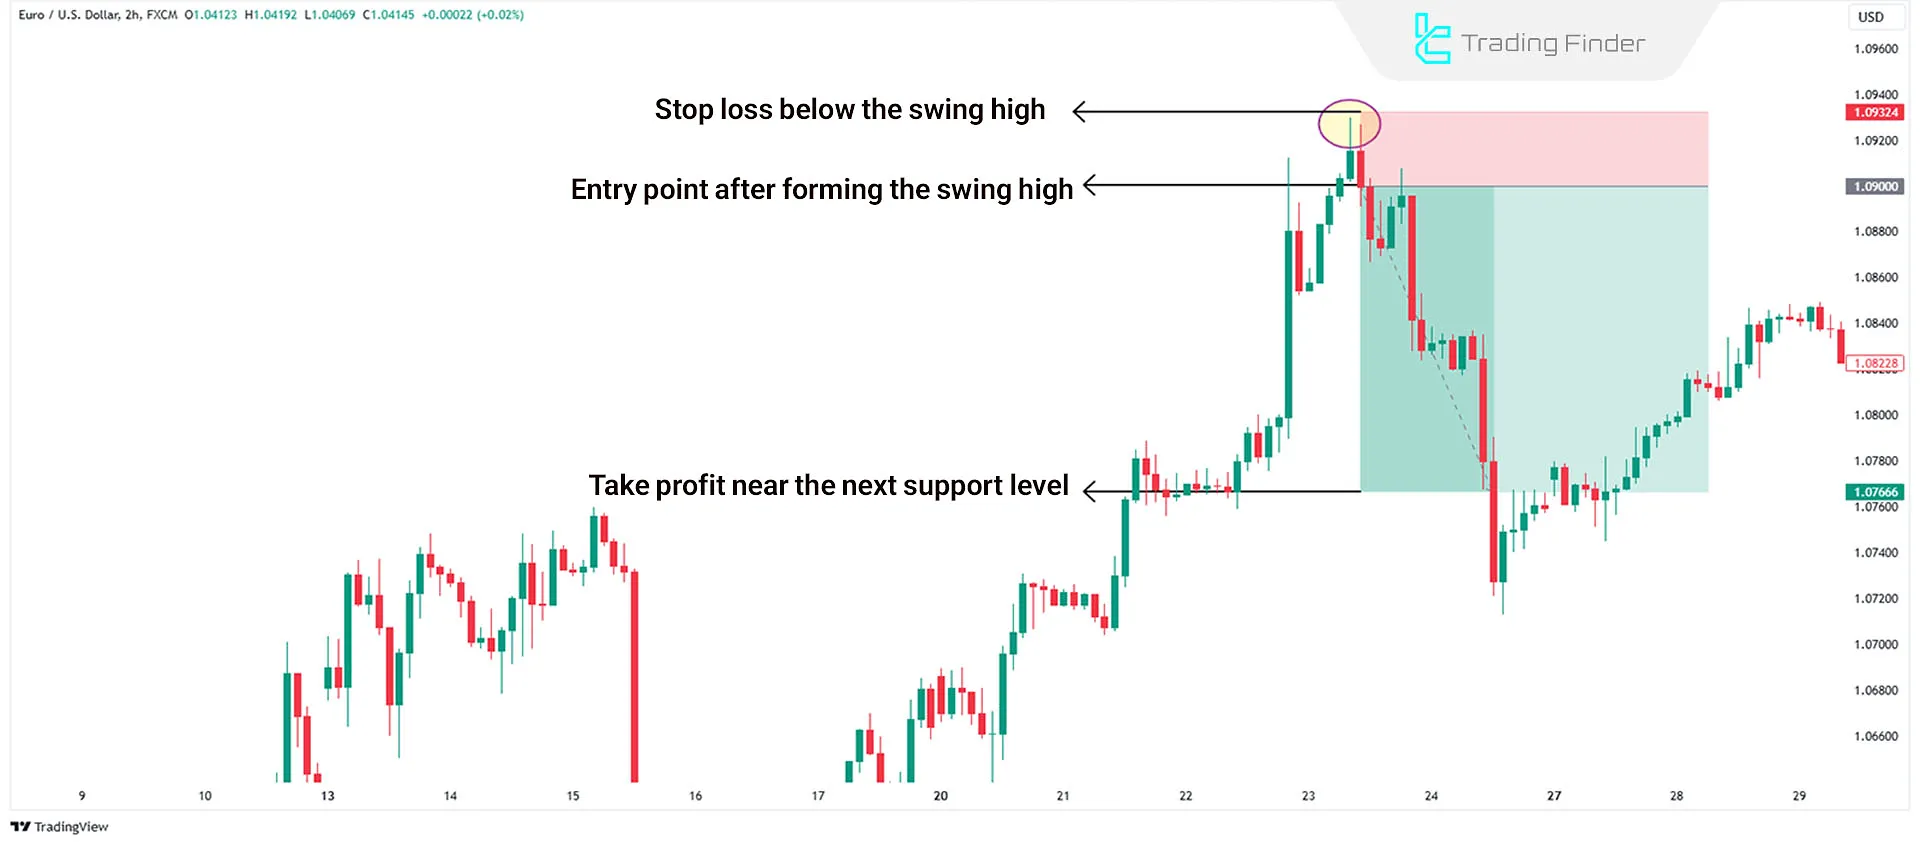
Example of trading using a Swing High
Trading based on swing highs can be done as follows:
- Identify the swing high on the chart: It usually forms in market resistance areas and is easily visible on the chart;
- Examine the bearish trend: In a downtrend, after forming a swing high and breaking the support level, conditions are set for a sell trade;
- Set the stop loss: The stop loss should be placed above the swing high to prevent excessive risk;
- Set the take profit: Place the take profit near the next support level to define your trading targets.
What Are the Applications of Swing Highs?
You can identify support and resistance levels using swing highs, because each swing high represents an area where selling pressure has overpowered buyers and price has been unable to continue its upward movement.
In addition, other applications of swing highs include:
#1 The Role of Swing Highs in Trend Analysis
Swing highs are one of the key methods for evaluating market trend changes and strength.
Because each swing reveals the intensity of buying and selling pressure, it shows where the market has experienced hesitation, weakness, or a potential change in direction.
#2 Downtrend with Lower Swing Highs
When swing highs form at lower levels (forming Lower Highs), it indicates weakening buyer strength and the potential continuation of a downtrend.
Because every new peak that forms lower than the previous one indicates weakening bullish momentum and a gradual increase in selling pressure within the market structure.
#3 Uptrend with Higher Swing Highs
If swing highs appear at higher levels than before (forming Higher Highs), this pattern indicates the strengthening of the uptrend.
Because the formation of higher highs and higher lows indicates that buying flow is active and that buyers have enough strength to push price to new levels.
#4 Distance Between Swing Highs
Analyzing the distance between swing highs provides valuable insights into the speed and intensity of the trend, aiding in a better understanding of market structure.
A decrease or increase in the distance between swings reflects the acceleration of price movement, changes in momentum, and the likelihood of the market entering a corrective phase, weakening, or accelerating its trend.
#5 Swing High as a Key Point
These points often mark significant market changes, reflecting the start or end of a price trend.
Swings represent moments when the balance between buyers and sellers shifts, and the dominant market flow becomes ready to enter a new phase of movement or correction.
How to Distinguish Valid Swing Highs from Fake Swing Highs
Valid swing highs are part of the market’s true structure and reflect the natural continuation of order flow.
In contrast, fake swing highs are the result of short-term manipulation designed to capture liquidity and are usually formed right before a sharp reversal.
Distinguishing between the two is essential in the ICT methodology, as misidentifying them leads to premature entries and repeated stop-loss hits.
Below are the methods for identifying valid vs. invalid swing highs:
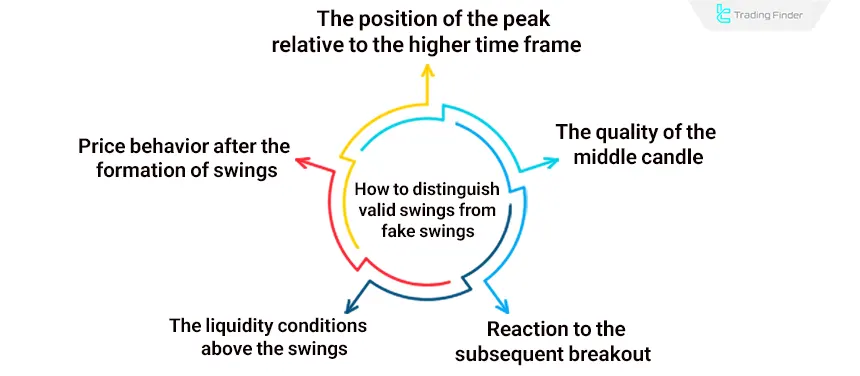
Price Behavior After the Swing High Forms
In a valid swing high, price enters a corrective move with orderly candles and without a sudden spike. The trend structure remains intact. In an invalid swing high, price reacts sharply and immediately after touching the high, generating a fast, impulsive move.
Liquidity Conditions Above the Swing High
A valid swing high does not accumulate a large cluster of orders above it, and the market does not aggressively push toward that level for a liquidity grab.
A fake swing high acts as an area filled with buy-stop liquidity, where the market intentionally attacks the level to collect liquidity and quickly reverses afterward.
Position of the High Relative to Higher Time Frames
Valid swing highs usually align with major HTF peaks and form within primary structural zones—areas that play significant roles in order flow.
Fake swing highs tend to form in mid-range areas and carry no structural weight on the HTF. They often act as noise or temporary price deviations.
Quality of the Middle Candle (Candle Anatomy)
In a valid swing high, the middle candle has a clear body and consistent behavior; no abnormal wicks or erratic movements appear. In a fake swing high, you often see long wicks, sudden volatility, and asymmetrical candle structures.
Reaction to the Subsequent Breakout
A valid swing high, once broken with a candle close above it, leads to a real BOS (Break of Structure) and continuation of the trend. A fake swing high often breaks only with a wick, fails to close above the level, and price quickly reverses from it.
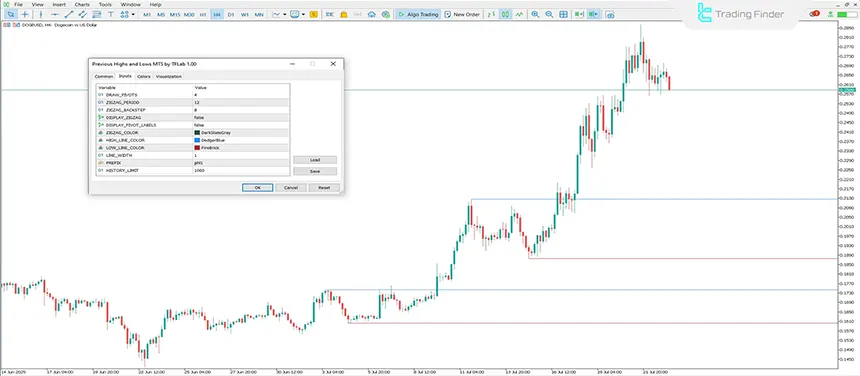
Previous High and Low Indicator in Identifying Swing Highs
The previous high–low indicator is a tool that extracts and displays market structure based on historical highs and lows.
Using raw candle data, it marks levels where the market previously formed a swing high or swing low and draws them as fixed or dynamic horizontal lines on the chart.
These lines represent areas where significant price reactions occurred in the past and are likely to act as support or resistance in the future. Educational videos for the previous high & low indicator:
In price-action logic and structure-based methods especially ICT past highs and lows correspond to swings. Swing highs are typically buy-side liquidity, and swing lows are sell-side liquidity .
Therefore, the indicator helps identify exact liquidity pools and supports analysis of trend structure, CHoCH (Change of Character), BOS (Break of Structure), and MSS (Market Structure Shift).
This tool is also useful for traders who analyze multiple time frames, as it can display HTF highs and lows on the current chart. This feature allows the trader to evaluate HTF swing positions and their influence on lower-time-frame movements.
The indicator’s settings menu provides full control over how levels are calculated and displayed such as zigzag period, labeling style, line color and thickness, pivot activation, and maximum candle history.
These options allow complete customization of swing-level detection.
Overall, the previous high–low indicator is a structural, price-based tool that identifies swings accurately, highlights reactive market levels and liquidity zones, and provides a clear view of trend structure.
It also helps identify potential entry and exit areas using swing-based logic.Download links for the Previous High and Low indicator:
Where Do Swing Highs Form?
Unlike swing lows, swing highs form at market points where the price encounters resistance and, under selling pressure, halts its upward movement.
- In uptrends: Swing highs mark temporary price halts and the start of a corrective move downward;
- In downtrends: Forming swing highs leads to continued price declines, pushing the market to lower levels.
Conclusion
Swing highs provide a simple method for identifying potential trend changes or continuation points. In other words, using swing highs helps traders identify suitable trading opportunities in bullish and bearish markets.
This structure enables the trader to identify liquidity pools and the placement of pending orders, allowing for more precise decision-making regarding entry and exit points.
Additionally, analyzing the sequence of swing highs alongside candle behavior provides a clear picture of momentum strength and the current state of market structure.


