


- TradingFinder
- Education
- Forex Education
- Indicators Education
Indicators Education
Indicators use price data, volume, and mathematical calculations to provide insights into market trends, momentum, and overbought or oversold conditions. However, improper use can lead to false signals and poor trading decisions. While some traders rely heavily on indicators, others consider them lagging tools. A moving average or divergence in the relative strength index (RSI) alone cannot generate a definitive buy or sell signal. However, combining indicators strategically with other analytical tools provides deeper market insights. On TradingFinder, advanced custom indicators are available for MetaTrader 4 & 5 (MT4 & MT5) and TradingView. Additionally, traders can access detailed tutorials on how to use trend indicators like moving averages and Ichimoku Cloud, apply oscillators such as RSI and MACD, and interpret volume indicators to gauge market strength.
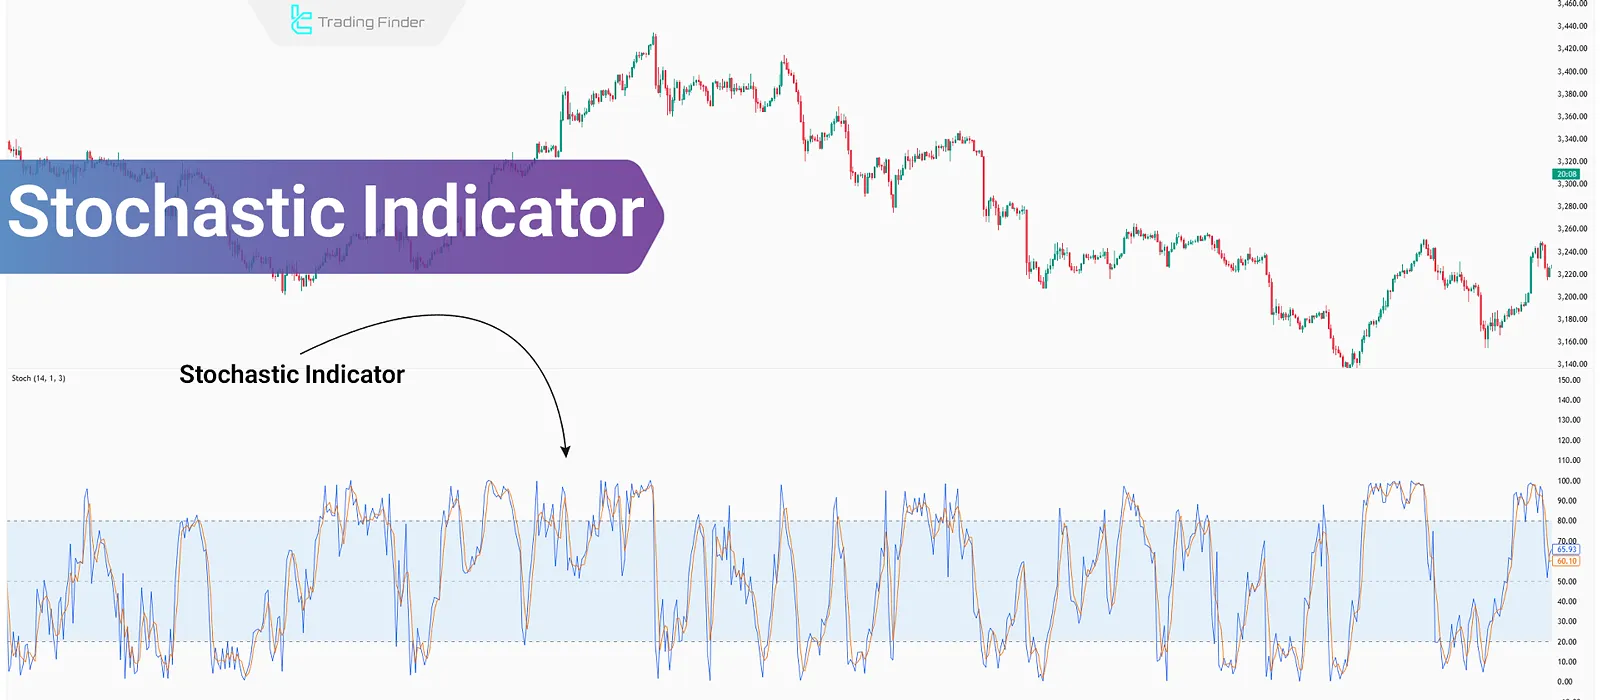
Stochastic Indicator – Stochastic Indicator Settings and Formula
The stochastic indicator analyzes price momentum by examining price movements over a specific time period. This stochastic oscillator...
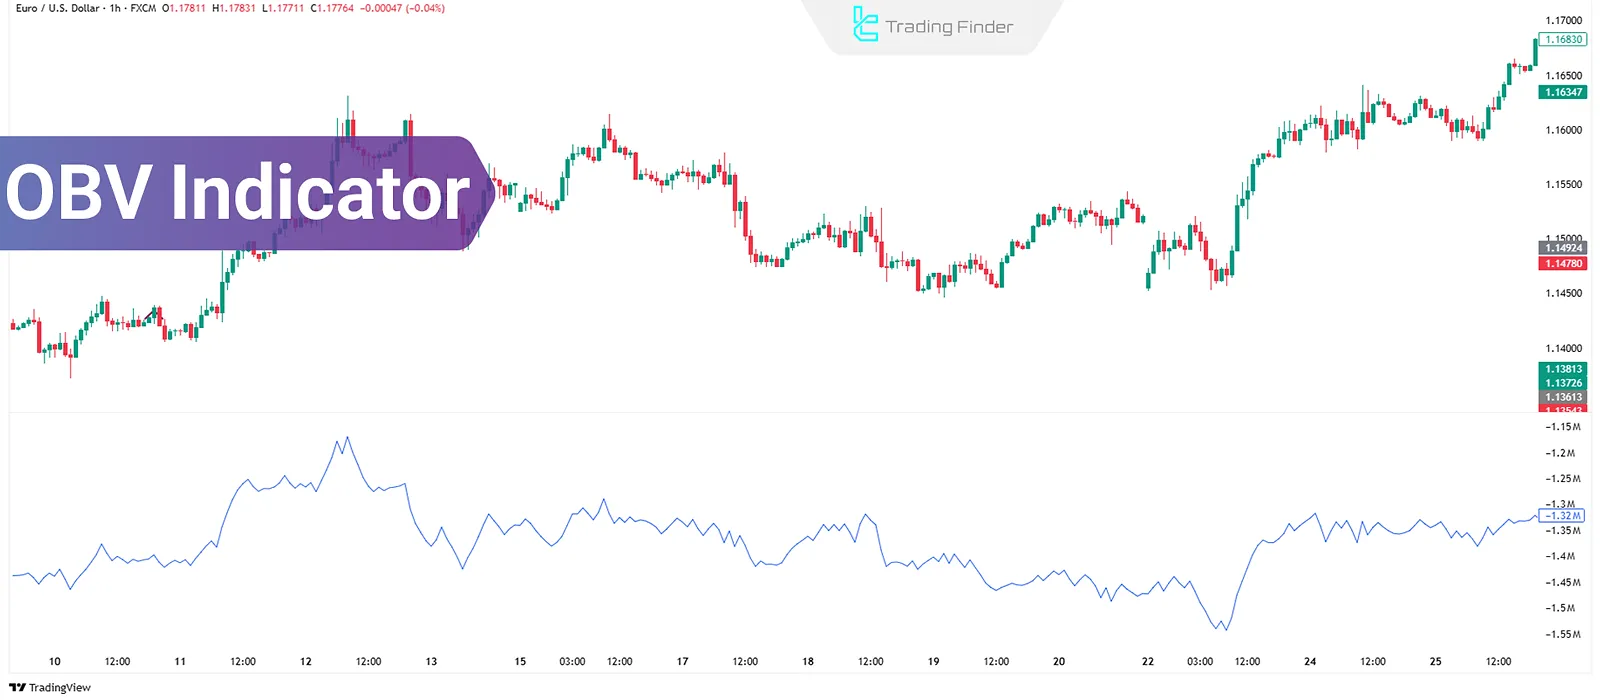
OBV Indicator Training in Trading; Analyzing Volume Shifts Before Price Movement
In technical analysis, volume plays a crucial role in identifying the true strength of price movements. The OBV indicator...
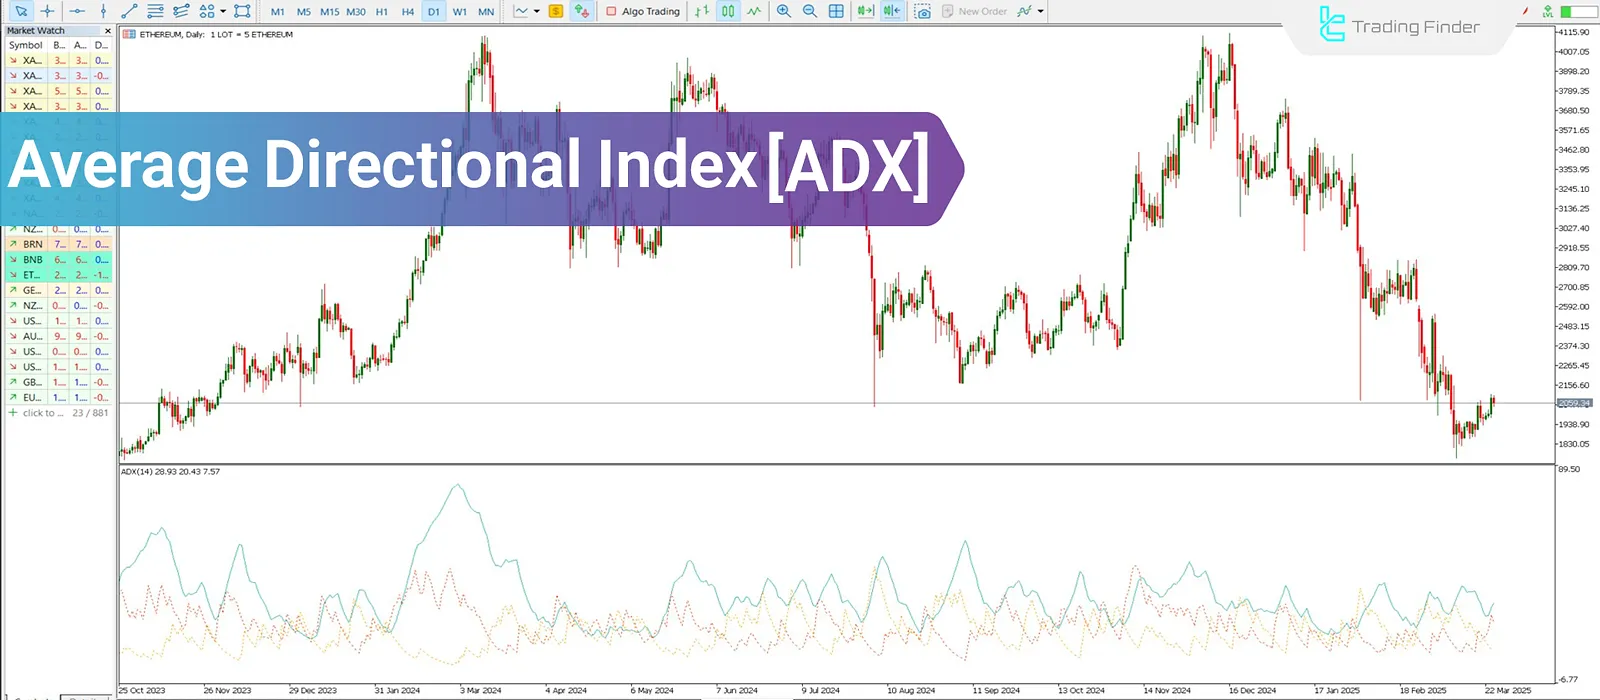
ADX Indicator: Average Directional Index for Trend and Range Detection
In technical analysis, identifying the strength of a trend is just as important as recognizing its direction. The ADX Indicator...
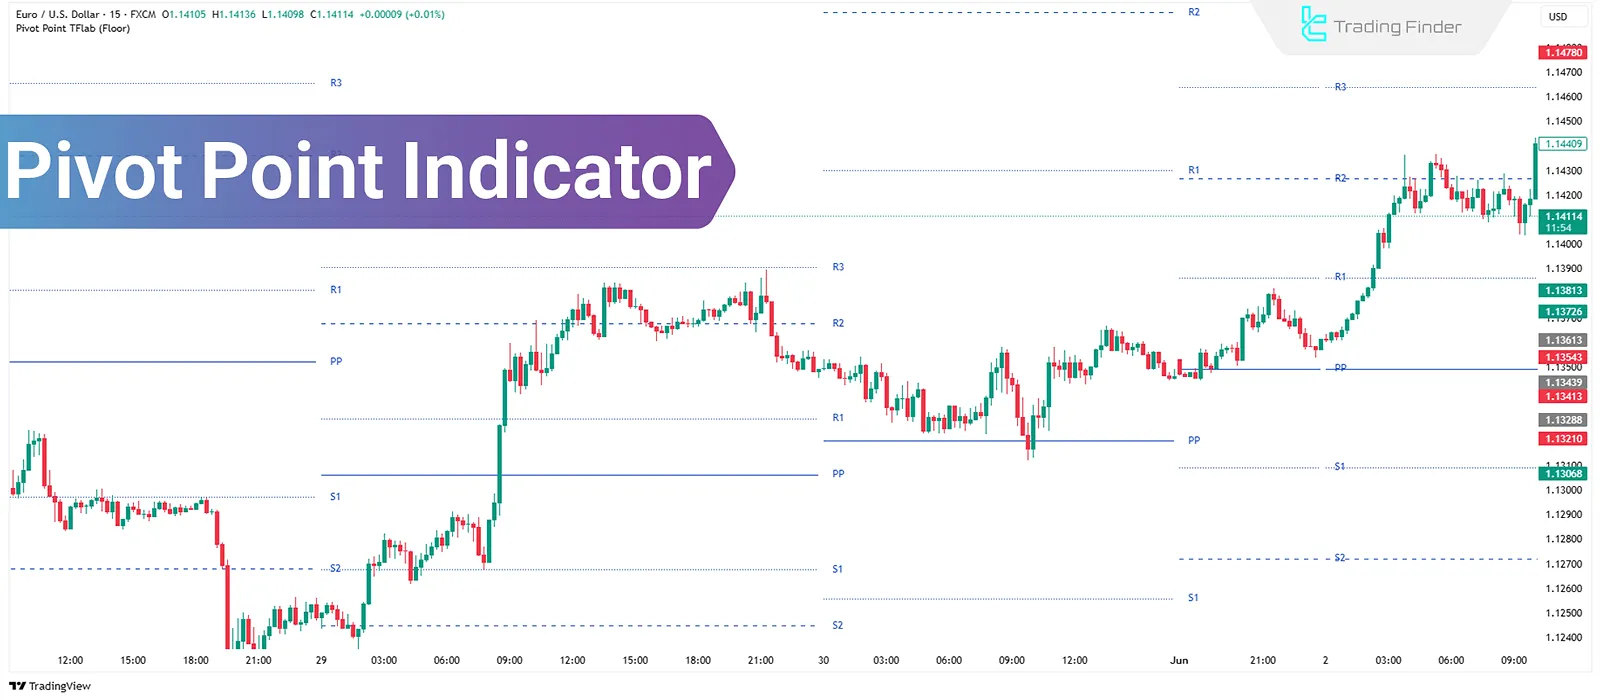
Pivot Point Indicator: Calculation Via Floor, Camarilla, Woodie, and Fibonacci
In technical analysis, trading requires defined levels where price behavior is predictable. The Pivot Point Indicator is designed...
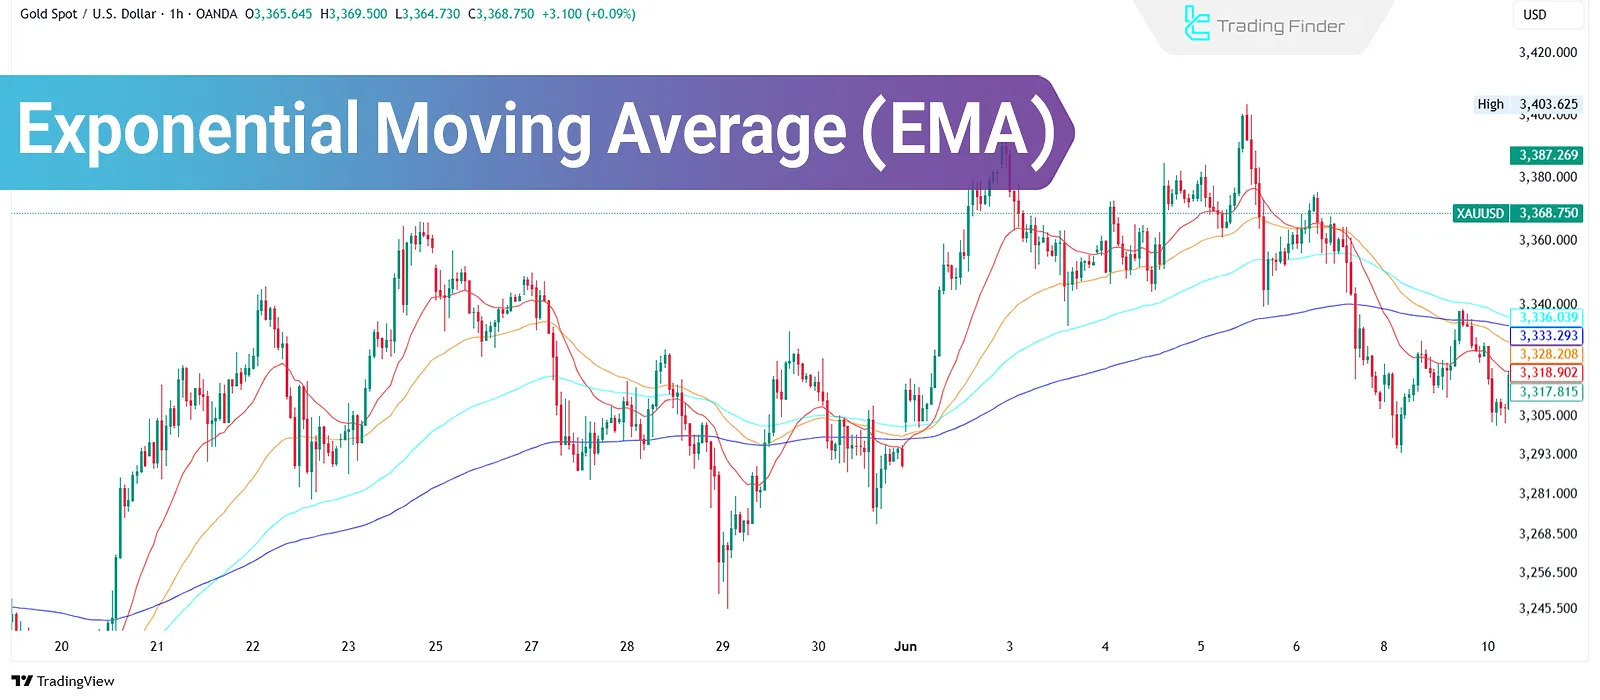
Exponential Moving Average (EMA): How to Use & The Best Settings
The Exponential Moving Average (EMA) indicator is a lagging indicator that responds quickly to price movements in financial...
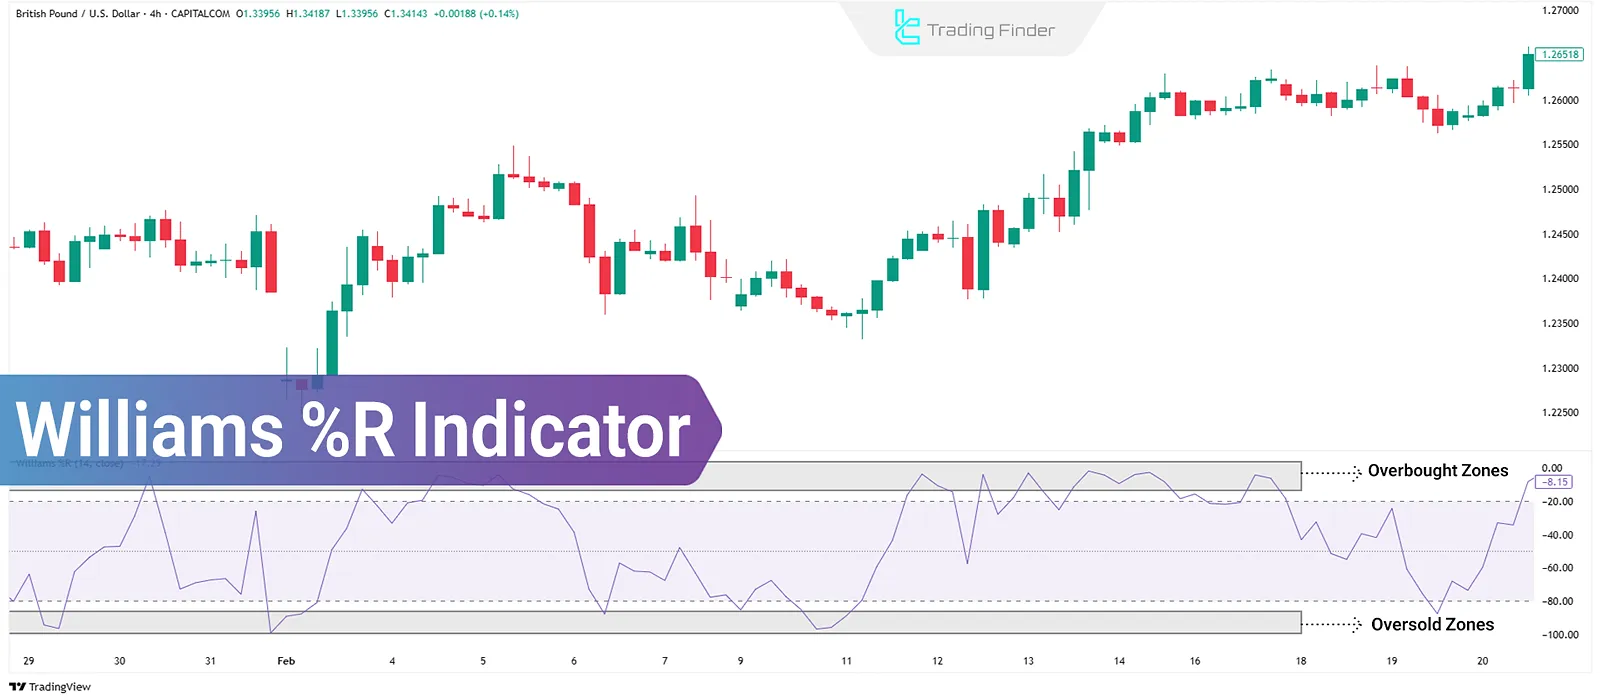
Williams %R Indicator: Overbought/Oversold Detection, Reversal Signals
Indicators are computational tools based on price and volume data, used for technical analysis and generating trading signals....
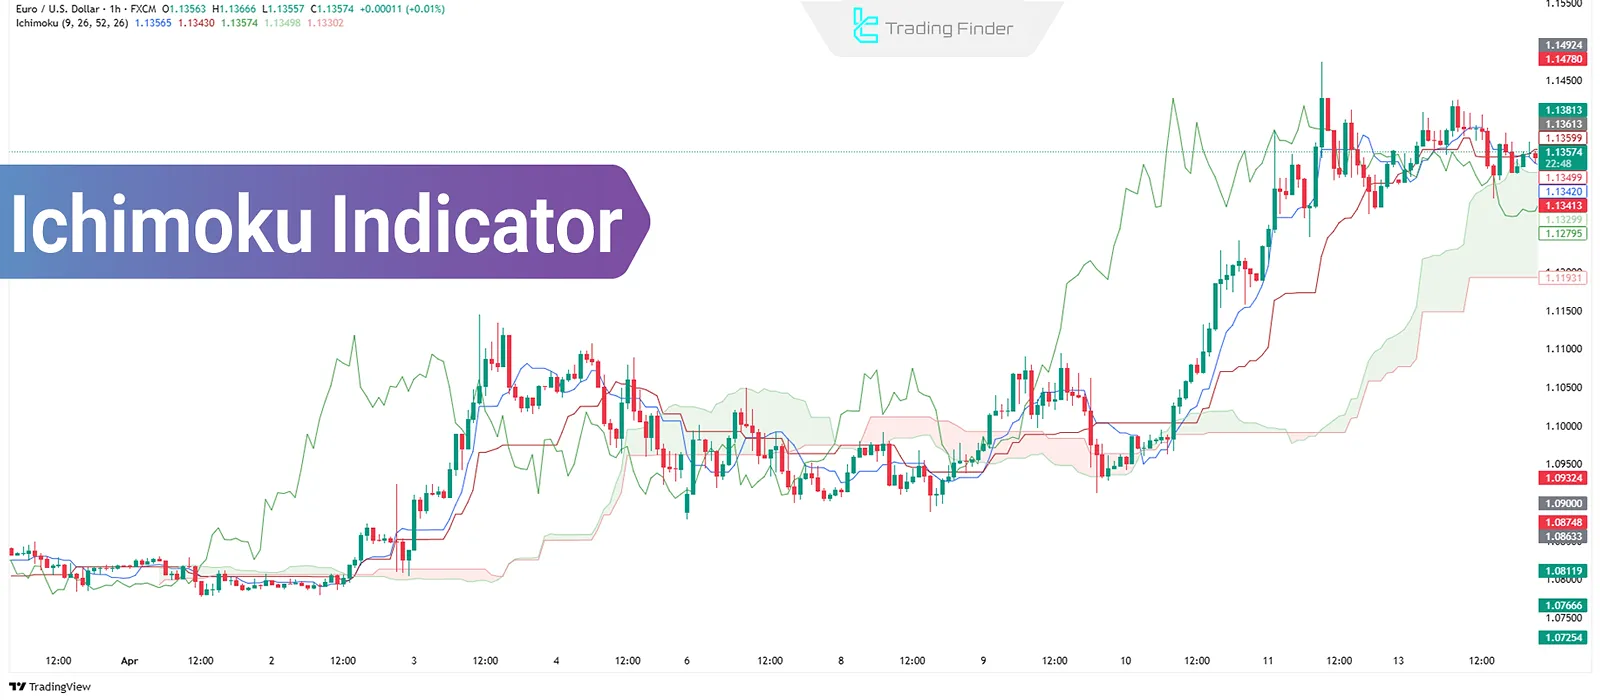
What is Ichimoku? Tenkan-sen, Kijun-sen, Chikou Span, Senkou Span A & B
Ichimoku, as both an indicator and a complete trading system in technical analysis, simultaneously provides information about the...
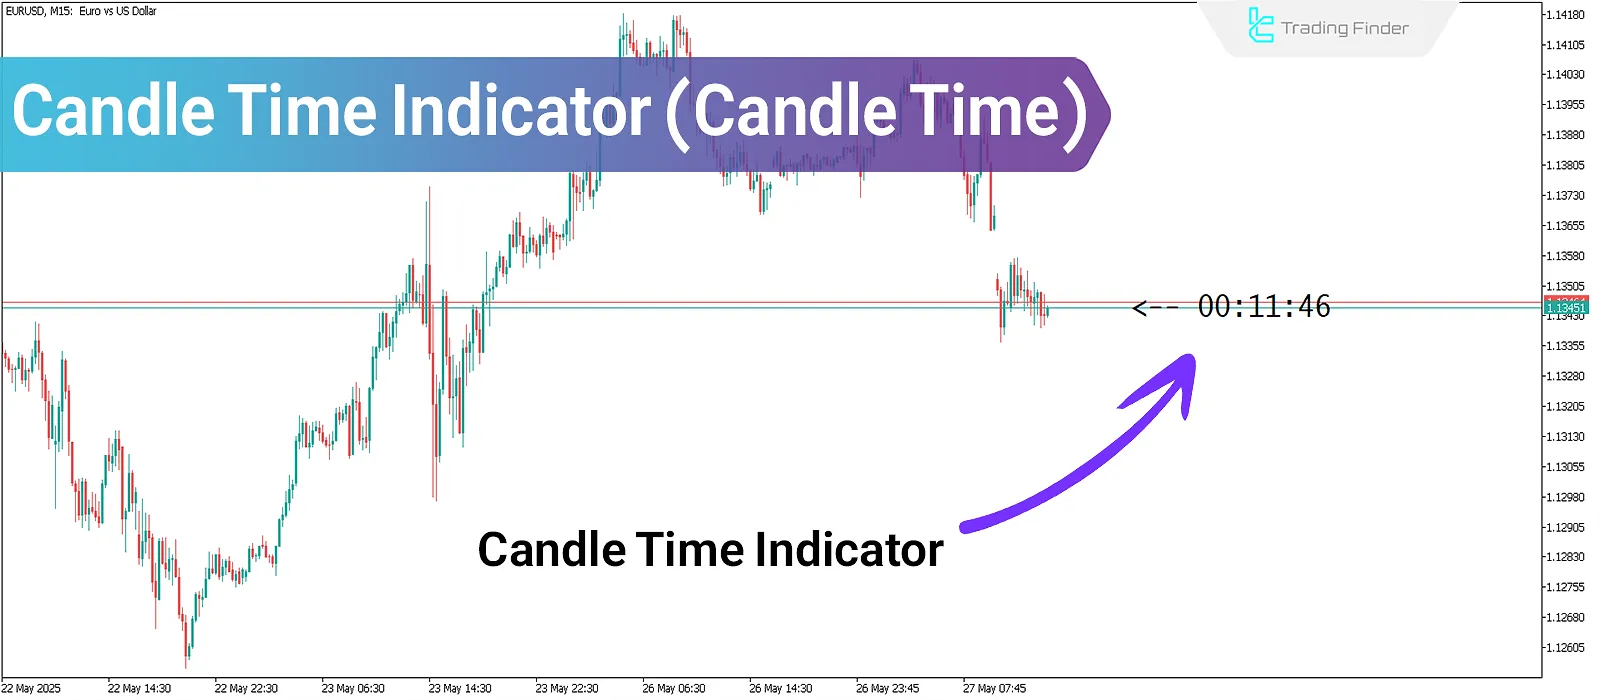
Candle Time Indicator: Free download and installation on MetaTrader
The Candle Time Indicator enhances trading accuracy across various timeframes and strategies, including scalping. With the Candlestick...
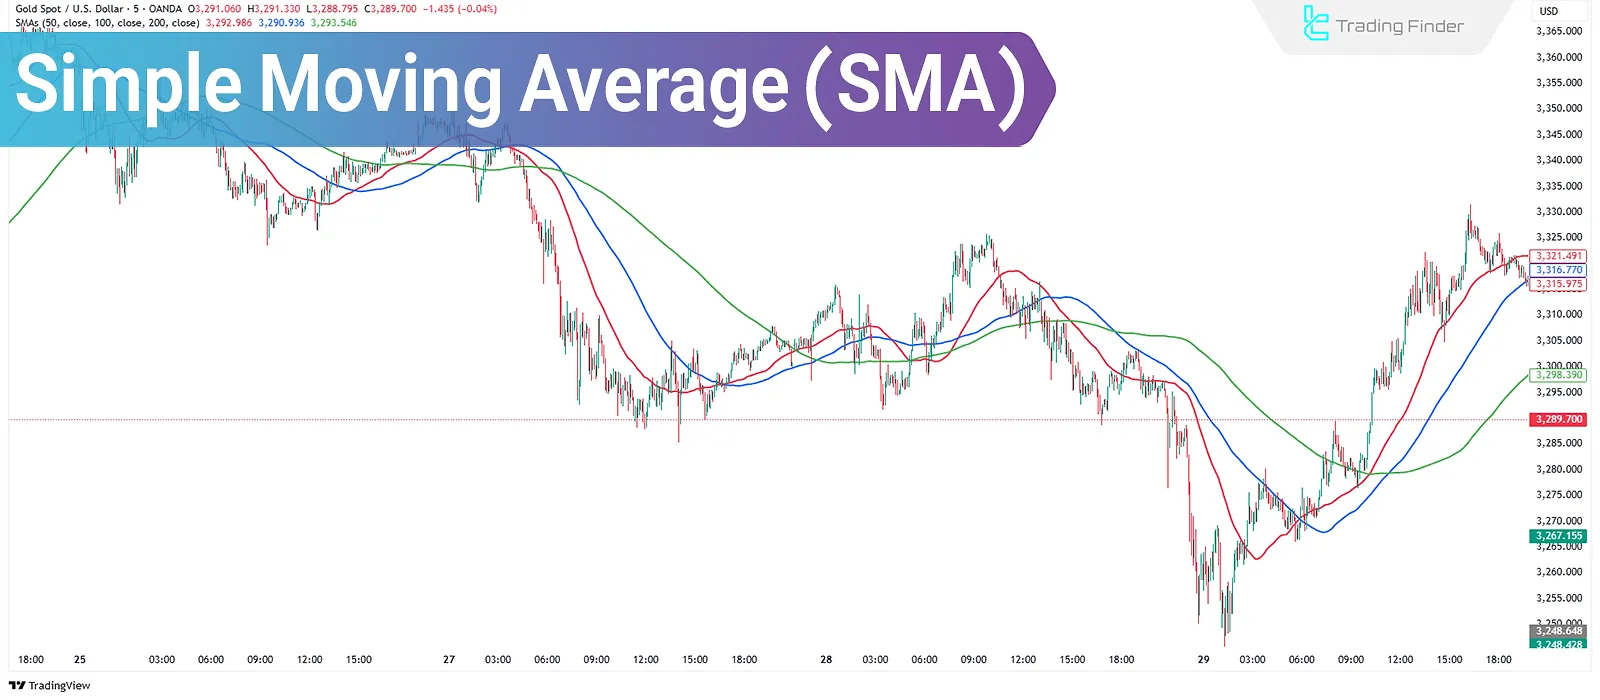
Simple Moving Average (SMA) - How to Calculate
The Simple Moving Average(SMA) is a trend-following indicator in technical analysis that smooths price data and reduces market...
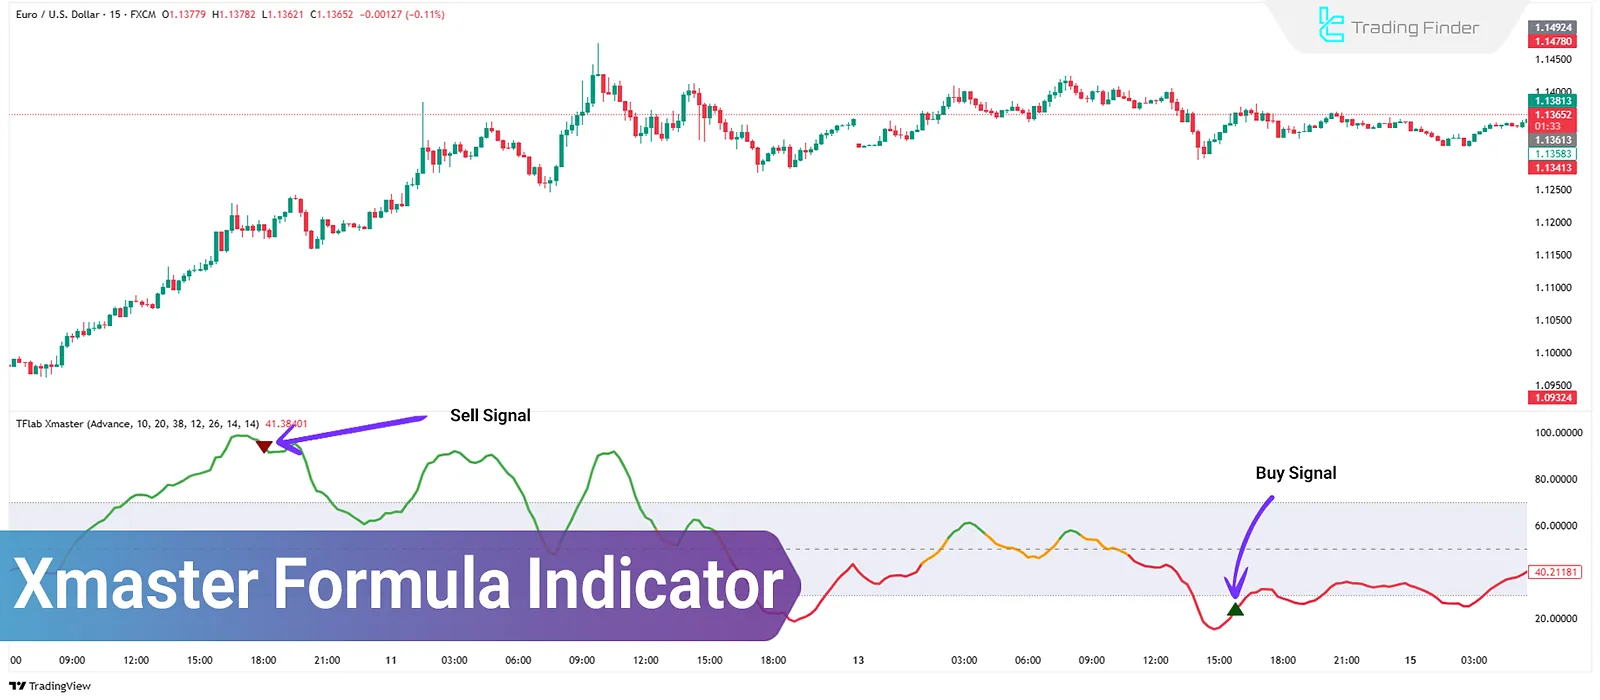
Xmaster (XHMaster) Formula Indicator: Identifying Start/End of Trends
The Xmaster Formula Forex Indicator issuesentry signals based on overbought and oversold zones. A key advantage of this indicator...
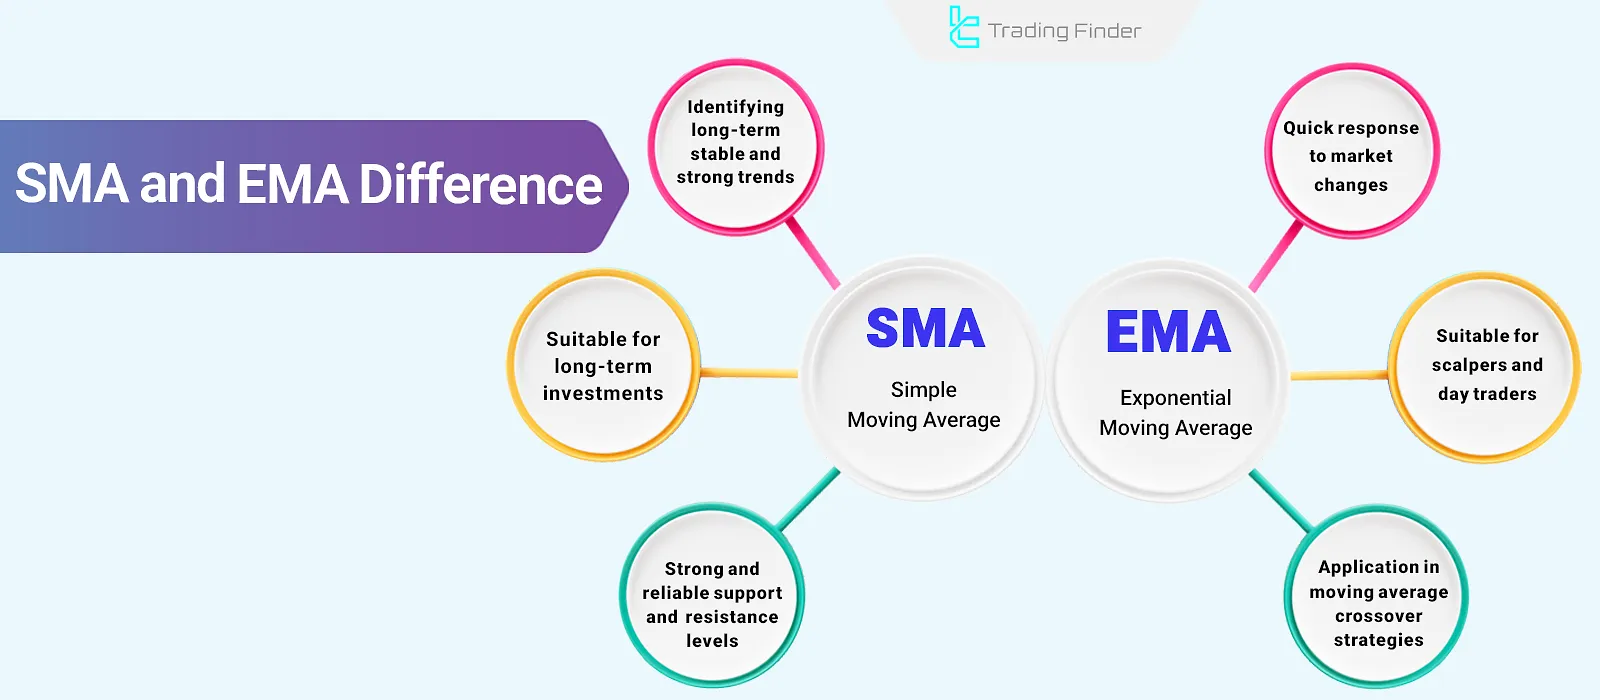
Simple vs Exponential Moving Average + Golden Cross and Death Cross
Price trend analysis indicators like Moving Averages smooth out market fluctuations and reveal the overall price movement structure....
![What is MACD? [Combining Exponential Moving Averages (EMA)]](https://cdn.tradingfinder.com/image/362923/03-19-tf-en-macd-01.webp)
What is MACD? [Combining Exponential Moving Averages (EMA)]
The MACD indicator (Moving Average Convergence Divergence) is a trend-following indicator used across all financial markets,...


