


- TradingFinder
- Education
- Forex Education
- Indicators Education
Indicators Education
Indicators use price data, volume, and mathematical calculations to provide insights into market trends, momentum, and overbought or oversold conditions. However, improper use can lead to false signals and poor trading decisions. While some traders rely heavily on indicators, others consider them lagging tools. A moving average or divergence in the relative strength index (RSI) alone cannot generate a definitive buy or sell signal. However, combining indicators strategically with other analytical tools provides deeper market insights. On TradingFinder, advanced custom indicators are available for MetaTrader 4 & 5 (MT4 & MT5) and TradingView. Additionally, traders can access detailed tutorials on how to use trend indicators like moving averages and Ichimoku Cloud, apply oscillators such as RSI and MACD, and interpret volume indicators to gauge market strength.
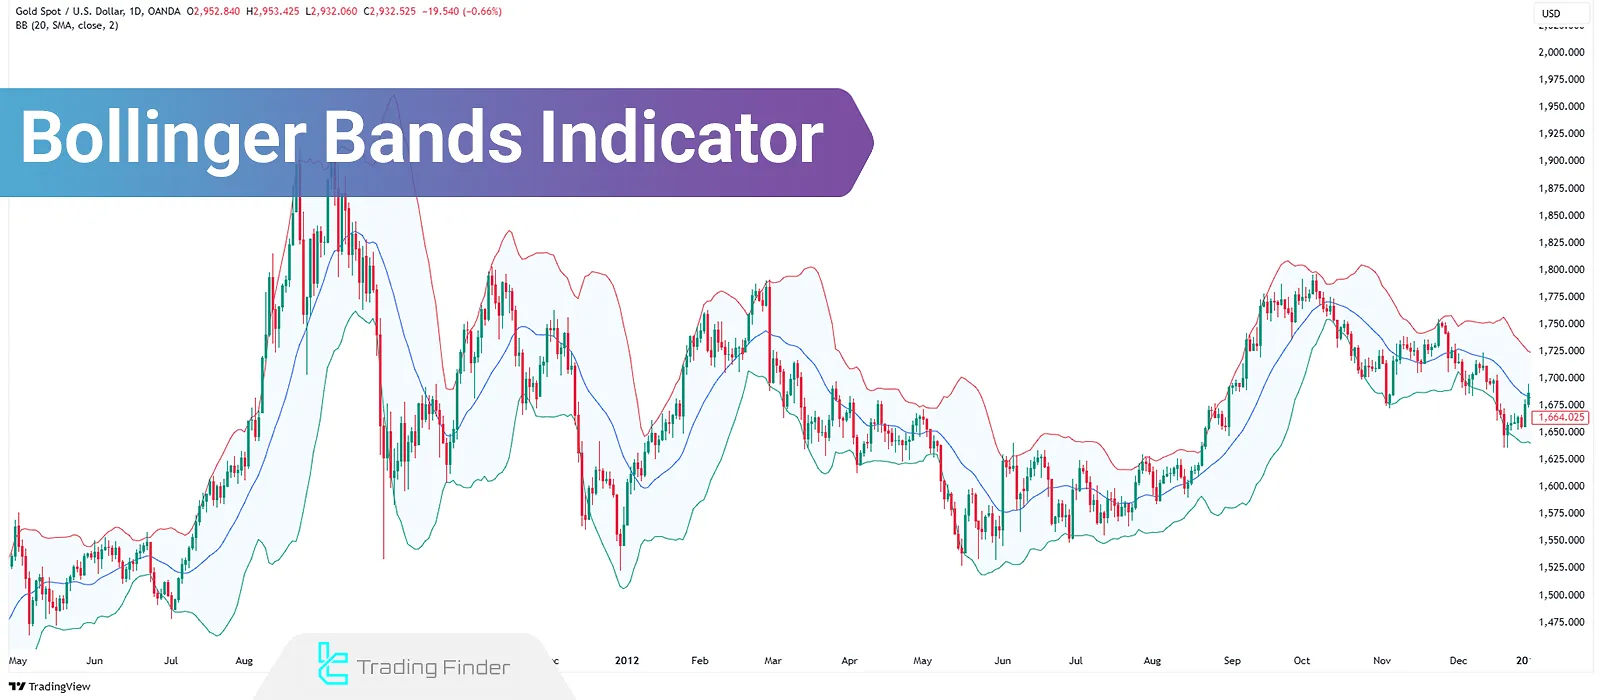
Bollinger Bands Indicator; Best Settings Based on Timeframe
The Bollinger Bands indicator is a powerful technical analysis tool that uses a simple moving average to evaluate...
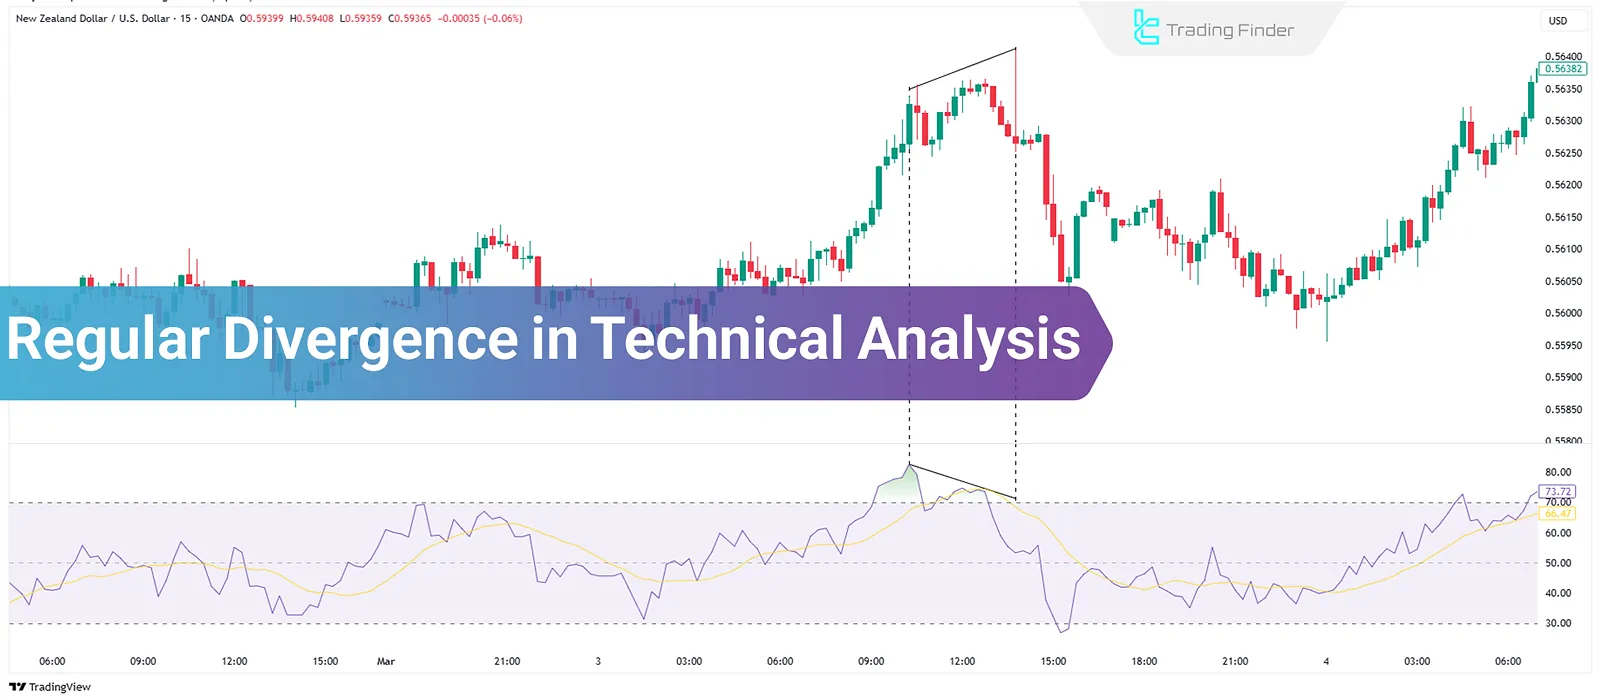
Regular Divergence in Technical Analysis; Bullish and Bearish Normal Divergence
Regular Divergence in technical analysis is one of the methods used to identify potential trend reversal points. This concept uses...
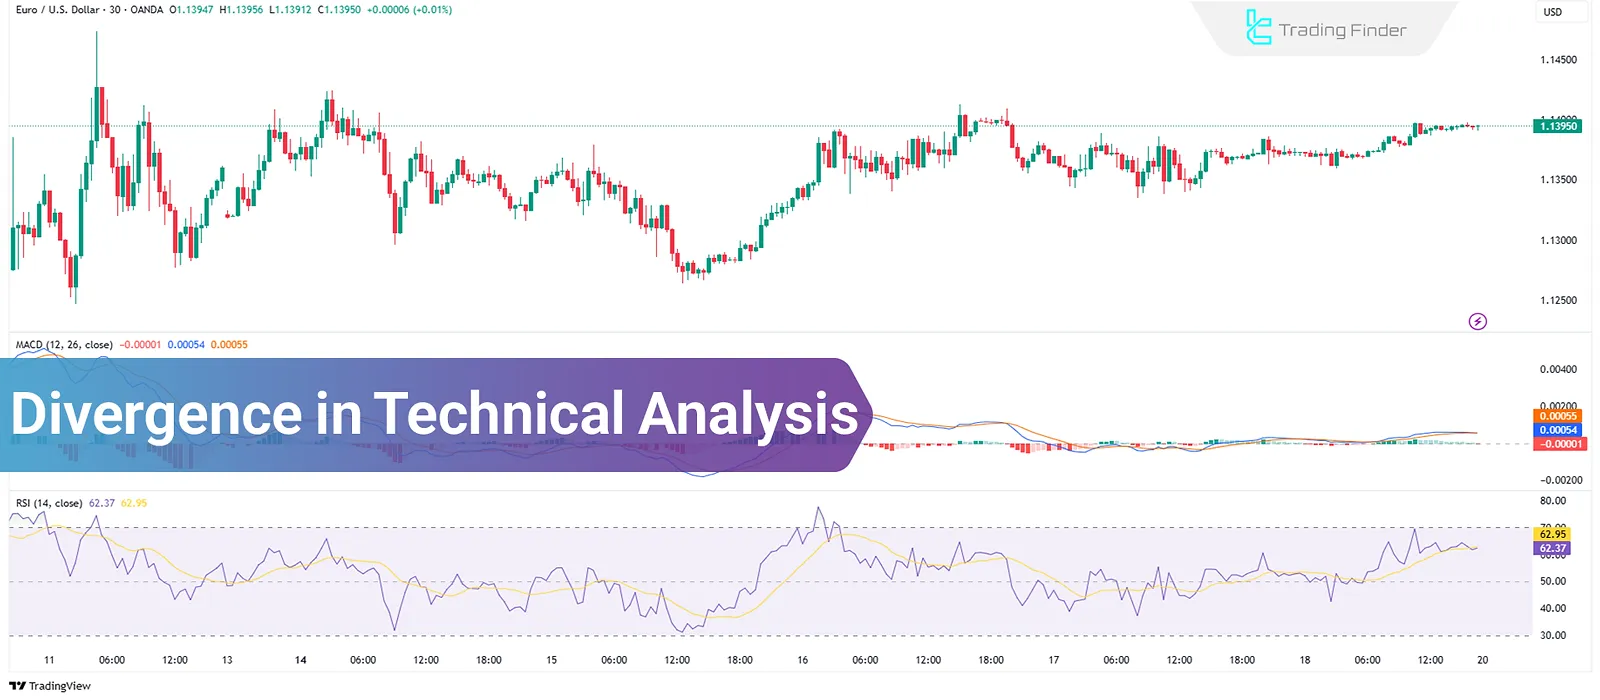
Trading with Divergence in Technical Analysis: Regular and Hidden Divergence
Divergence in technical analysis is a tool used to identify potential changes in price trends. It utilizes indicators to detect...
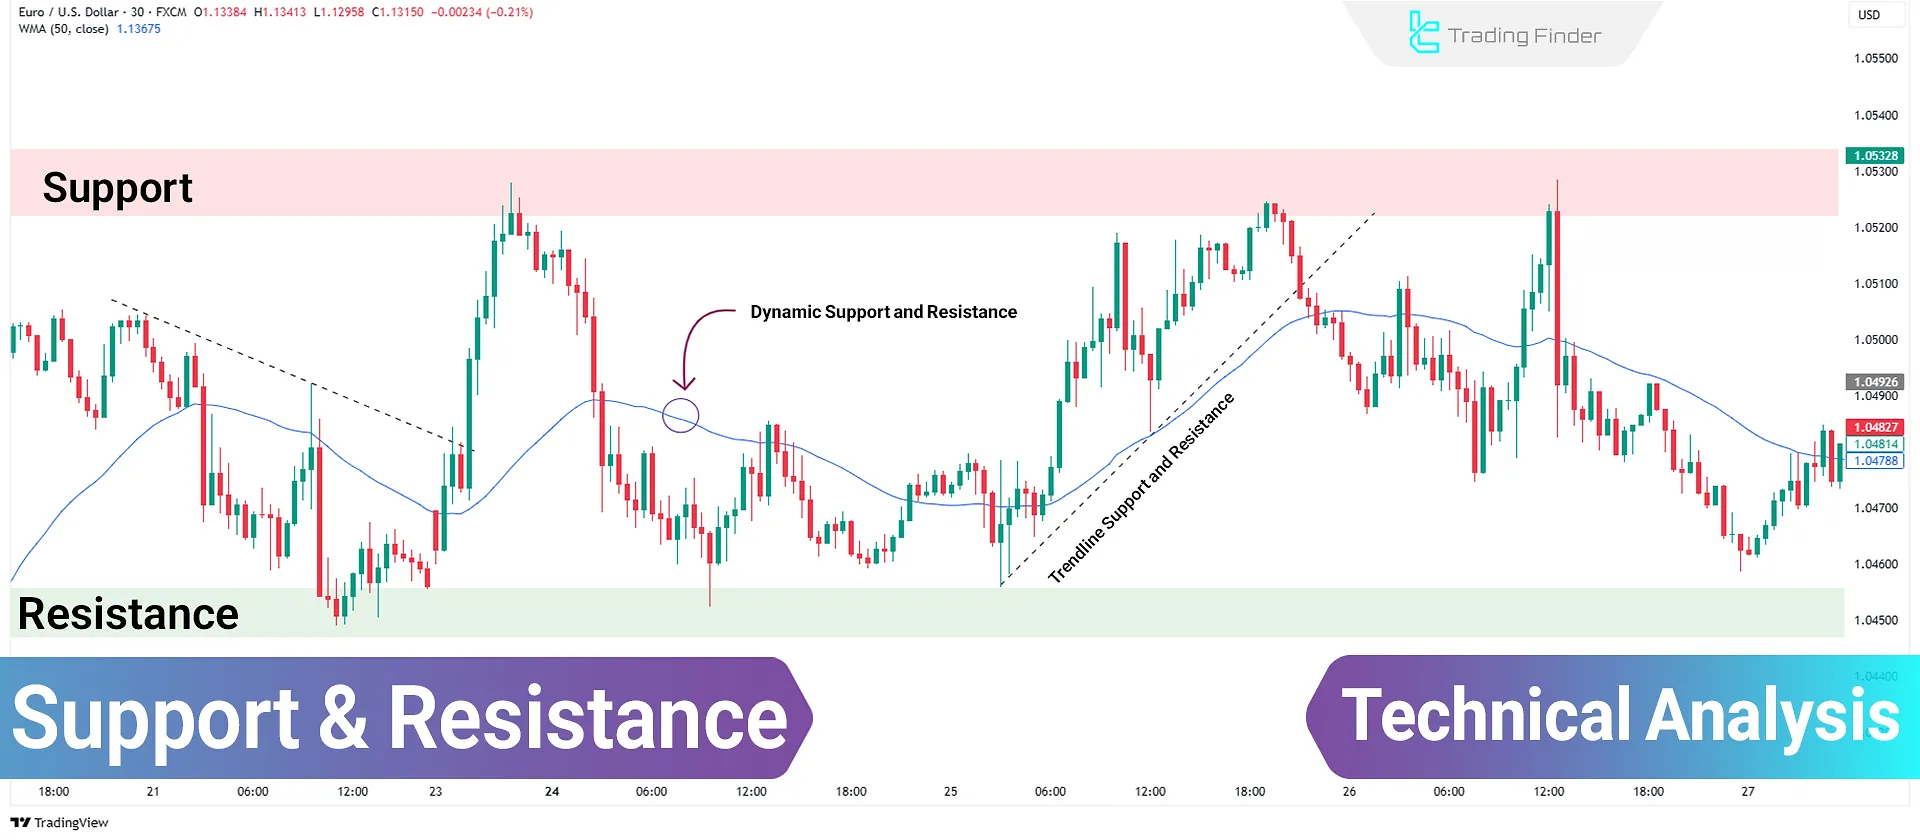
Support and Resistance Levels: Reversal Zones in Technical Analysis
Support and resistance are foundational concepts in technical analysis used in markets like Forex Market, stocks, Cryptocurrency, and...
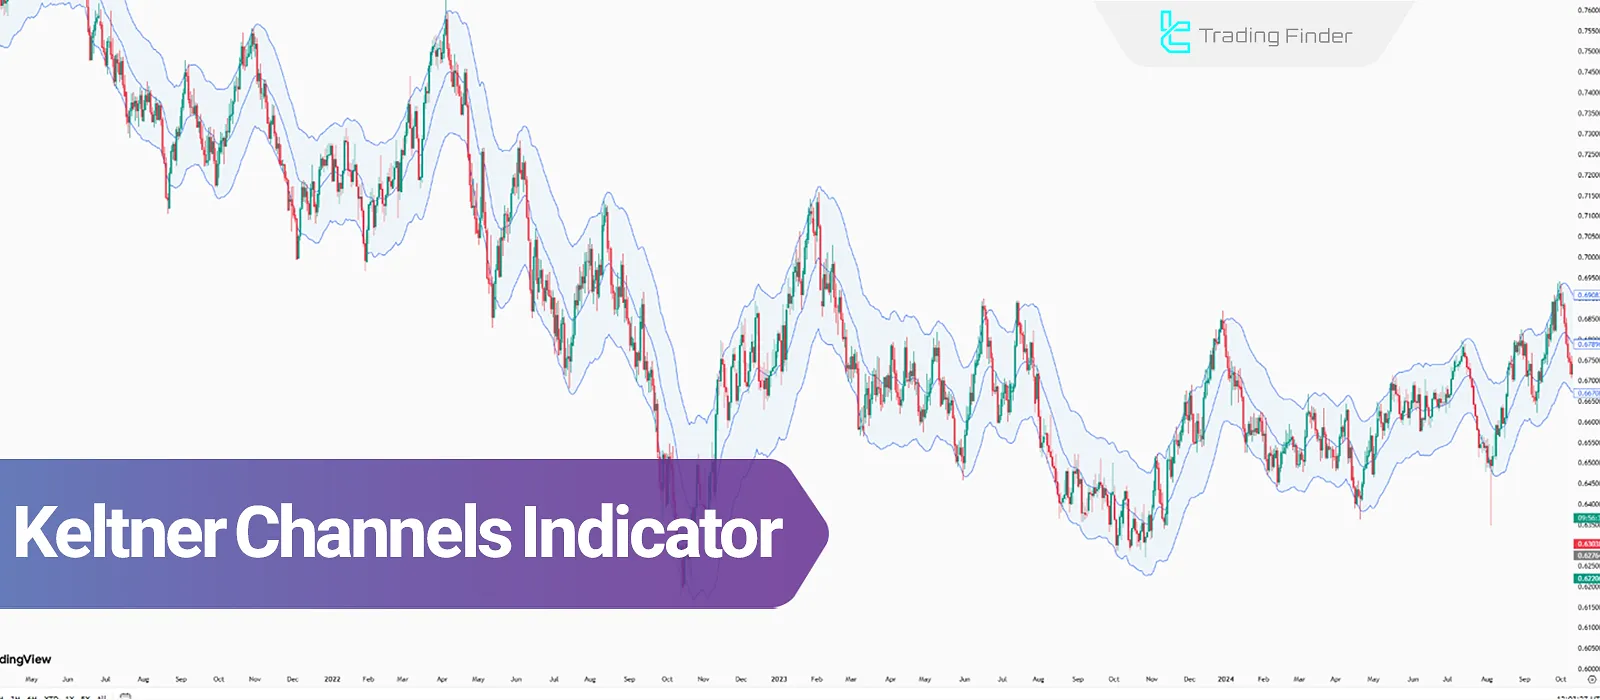
Keltner Channel Indicator – The Use of the Keltner Channel in Technical Analysis
The Keltner Channel Indicator (KC) is constructed using the Exponential Moving Average (EMA) as the middle line, with the channel...
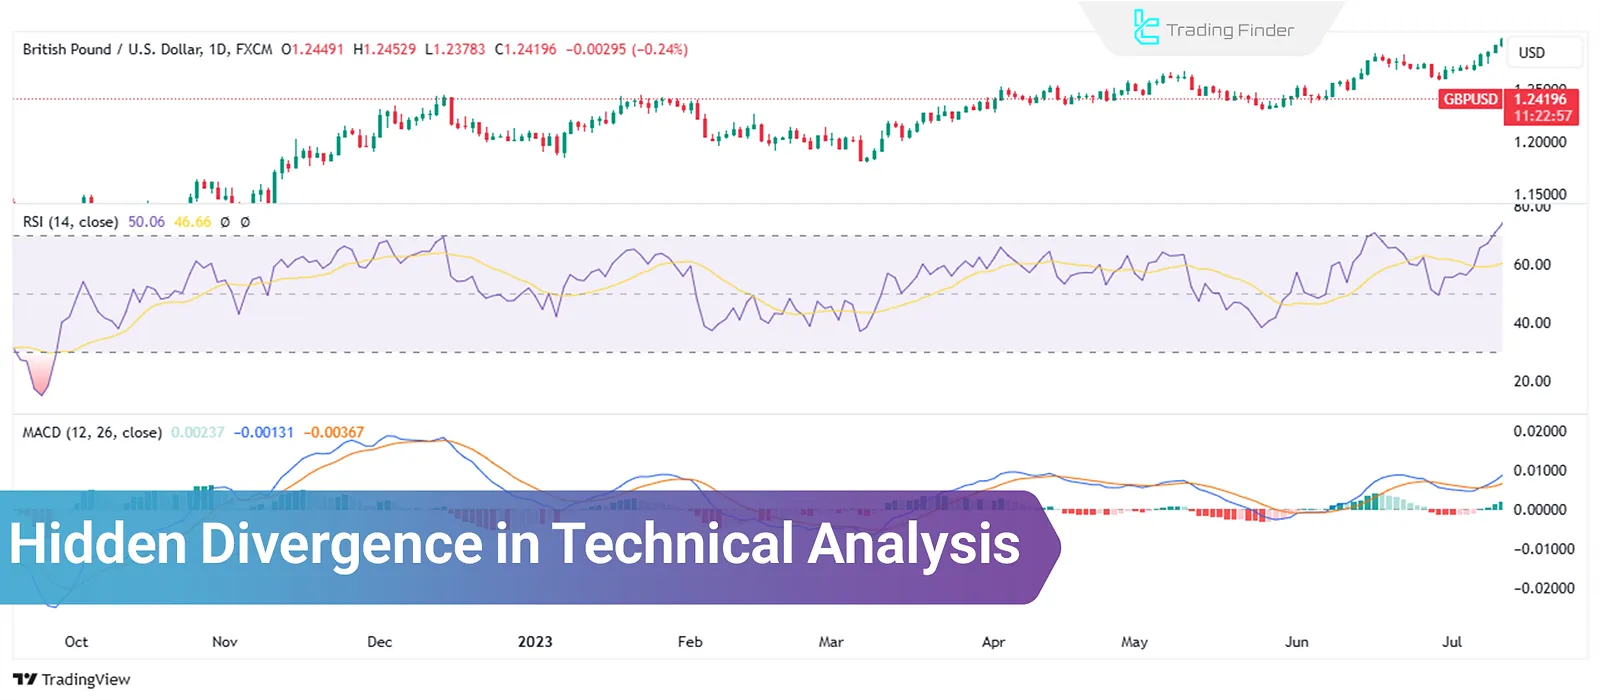
Trading with Hidden Divergence in Technical Analysis; Bullish and Bearish
Hidden divergence is a concept in technical analysis defined based on indicators. Traders use it to identify trend continuation....
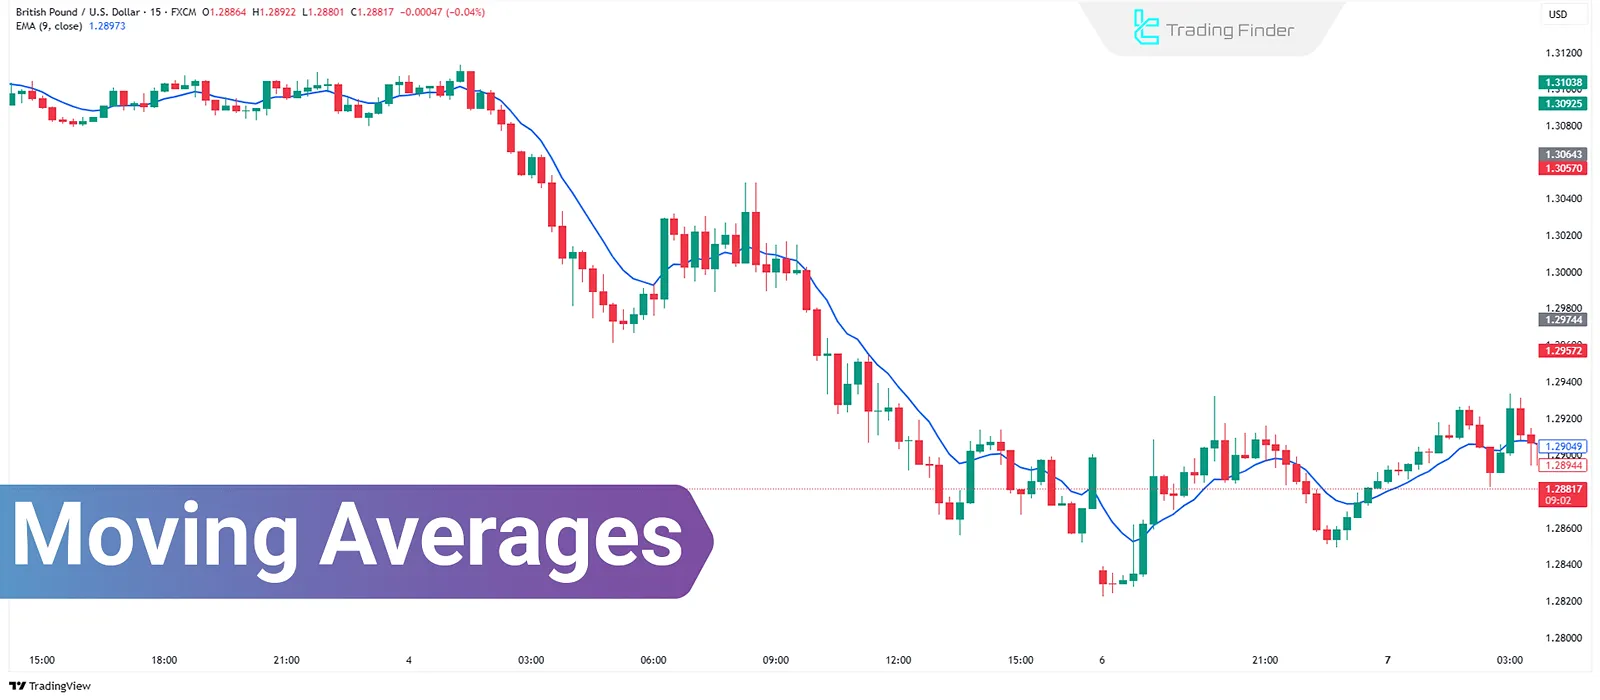
Moving Averages (MA) in Technical Analysis: Application in Trend Identification
The moving average in technical analysis, calculates the average price over a specified time period, enabling trend...
![MACD Trading Strategy – 6 MACD Strategies [Zero Crosses, Histogram, Divergence]](https://cdn.tradingfinder.com/image/322659/03-014-tf-en-macd-strategy-01.webp)
MACD Trading Strategy – 6 MACD Strategies [Zero Crosses, Histogram, Divergence]
MACD stands fo rin trading “Moving Average Convergence Divergence”. This indicator utilizes moving averages, historical data,...
![ICT Average Daily Range [Average Daily Range] - Application in Forex and Crypto](https://cdn.tradingfinder.com/image/352367/14-22-ict-average-daily-range-adr-01.webp)
ICT Average Daily Range [Average Daily Range] - Application in Forex and Crypto
The average daily range is a core volatility metric in price analysis and within the adr ict framework, it refers to the amount...
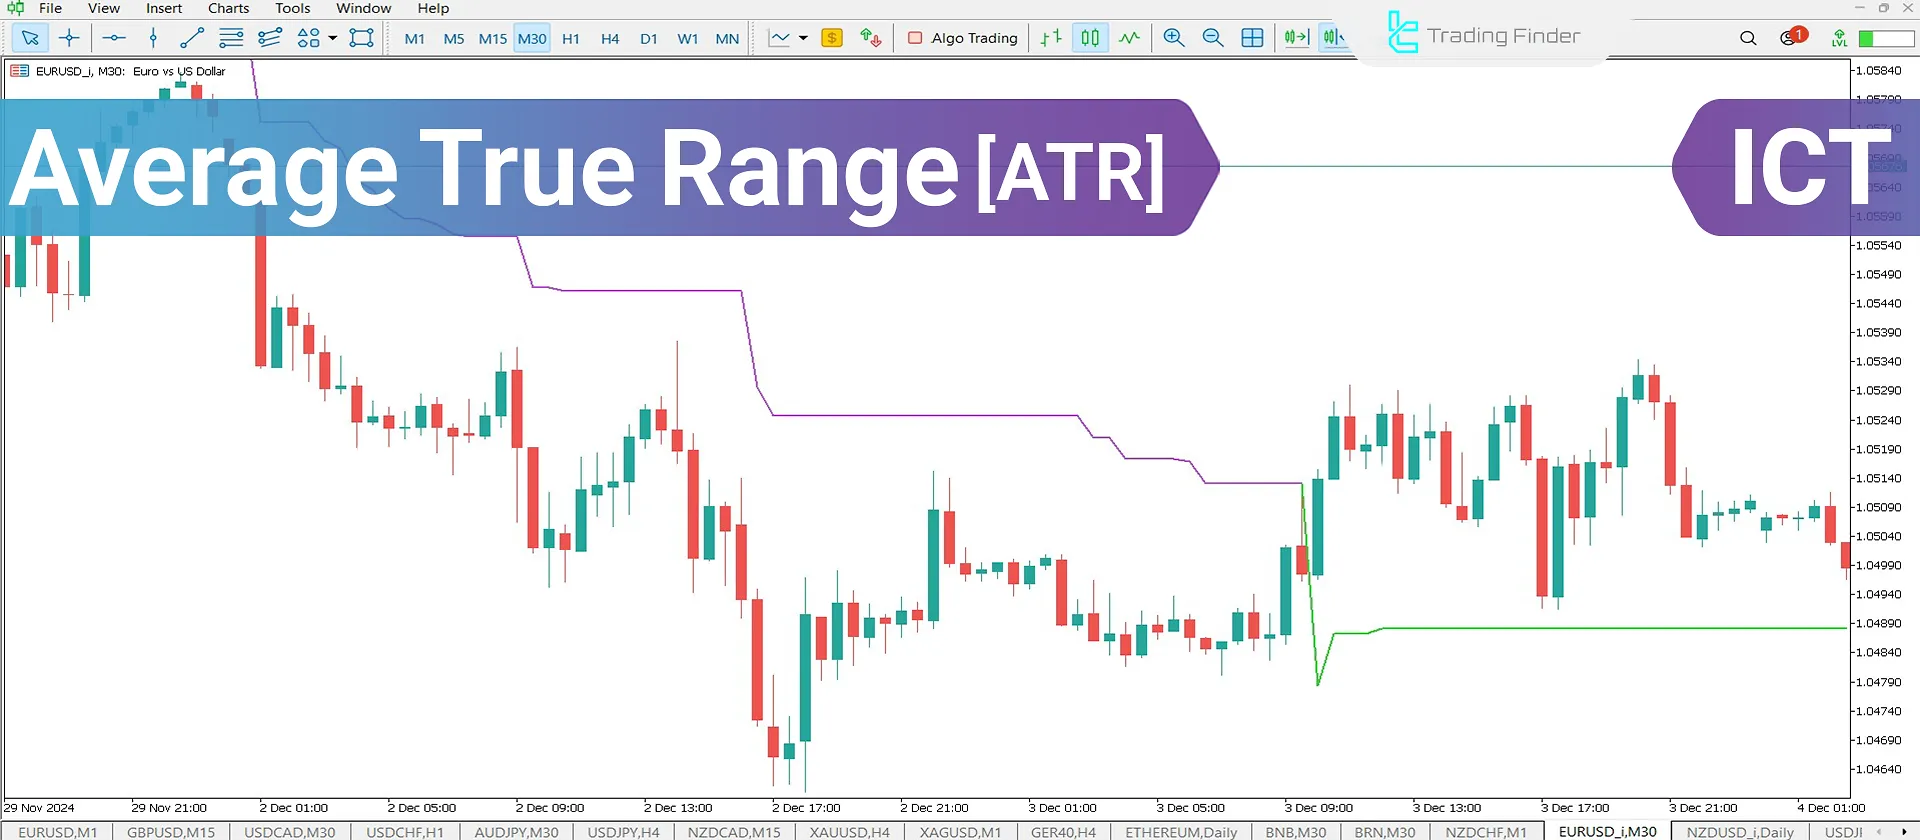
Average True Range/ATR; Measuring Volatility - ICT
Average True Range (ATR) is a tool that shows how much a price moves within a specific timeframe (e.g., one day). How to...


