


Inducement in Forex and financial markets refers to a form of market manipulation by large players (including institutional investors or "smart money").
This move is designed to mislead traders about the market's direction; in other words, smart money lures retail traders or inexperienced participants into positions opposite to their actual intent.
What is Inducement (Liquidity Inducement)?
In Smart Money and ICT trading Style, Inducement Levels are seen as liquidity traps designed to hunt retail traders' stop-losses. Many new traders enter trades at these levels, believing they are optimal entry points.
However, the price moves against them triggers their stop-losses, and then returns to the intended direction. This is why these zones are called Inducement Levels (Liquidity Inducement).
Due to the high volatility of the Forex market, this concept is observed more frequently in Forex trading.
Educational video on Inducement from the YouTube channel TTrades:
How Does Inducement Work?
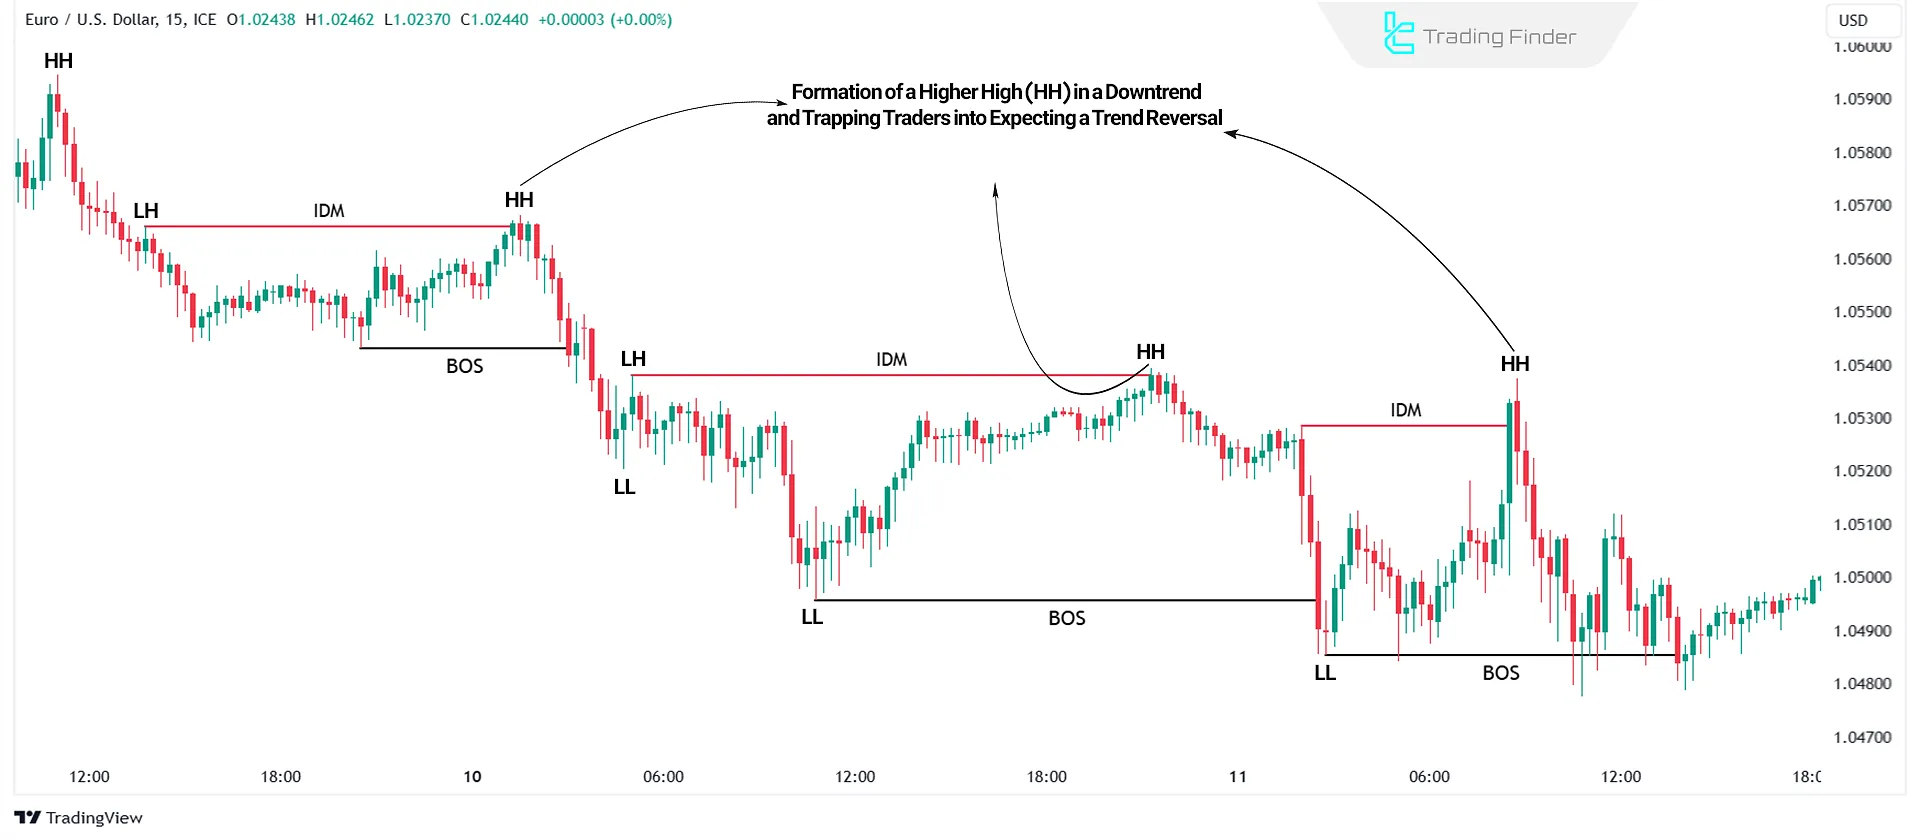
To understand how liquidity inducement operates, traders must first grasp the market structure.
- In an uptrend, the market forms higher highs and higher lows. When the previous high breaks, a new high forms, and the price is expected to pull back to the new low and then continue upwards, breaking the latest high;
- In a downtrend, the market forms lower lows and lower highs. When the previous low breaks, the price is expected to pull back to the new lower high, then drop and break a new low, continuing the trend.
Inducement trading tutorial from the website Trading Strategy Guides:
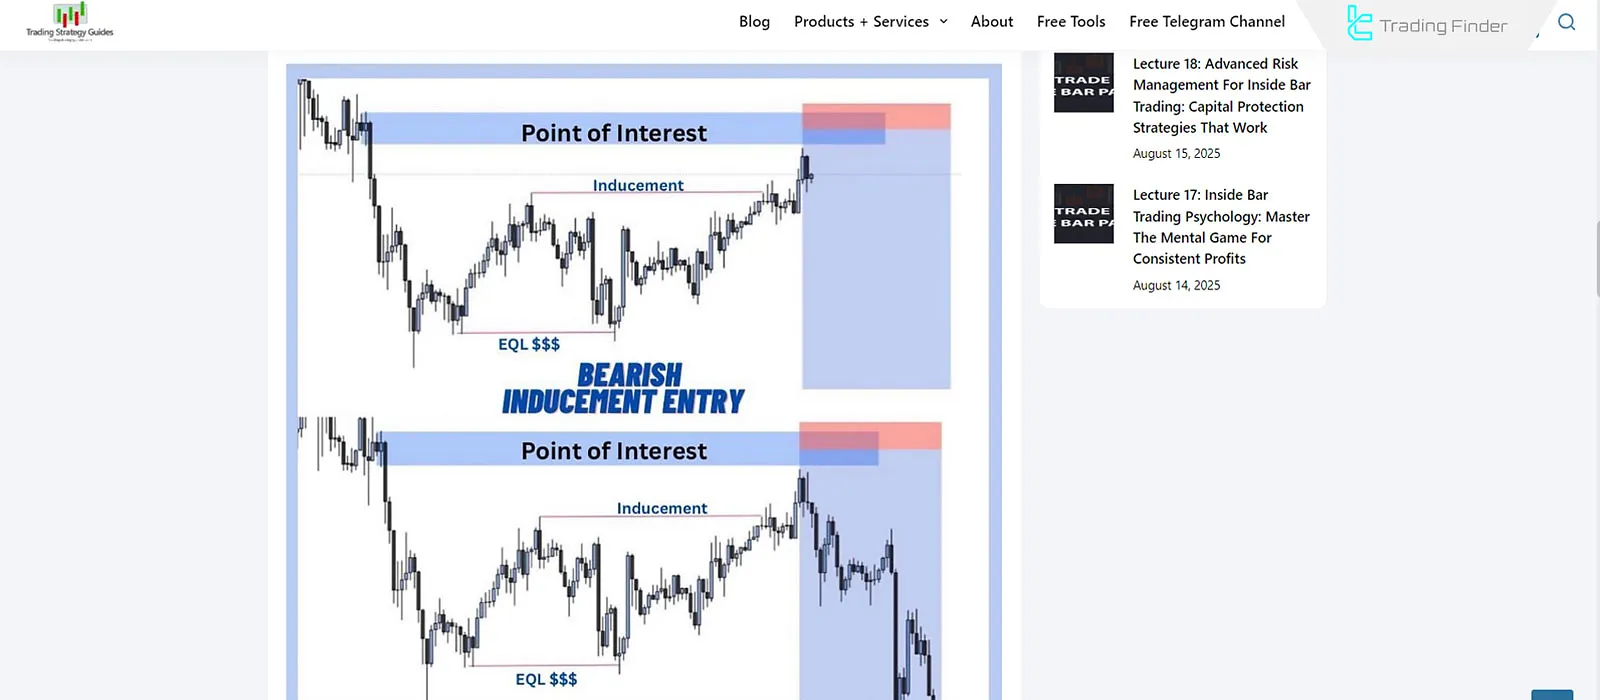
Among these levels, only one point is the real reversal level the others are Inducement Levels (Liquidity Traps).
These trick traders into entering positions, triggering their stop-losses before the market continues in its primary direction.
Types of Inducement in Trading
Inducement can be categorized based on how it forms on the chart:
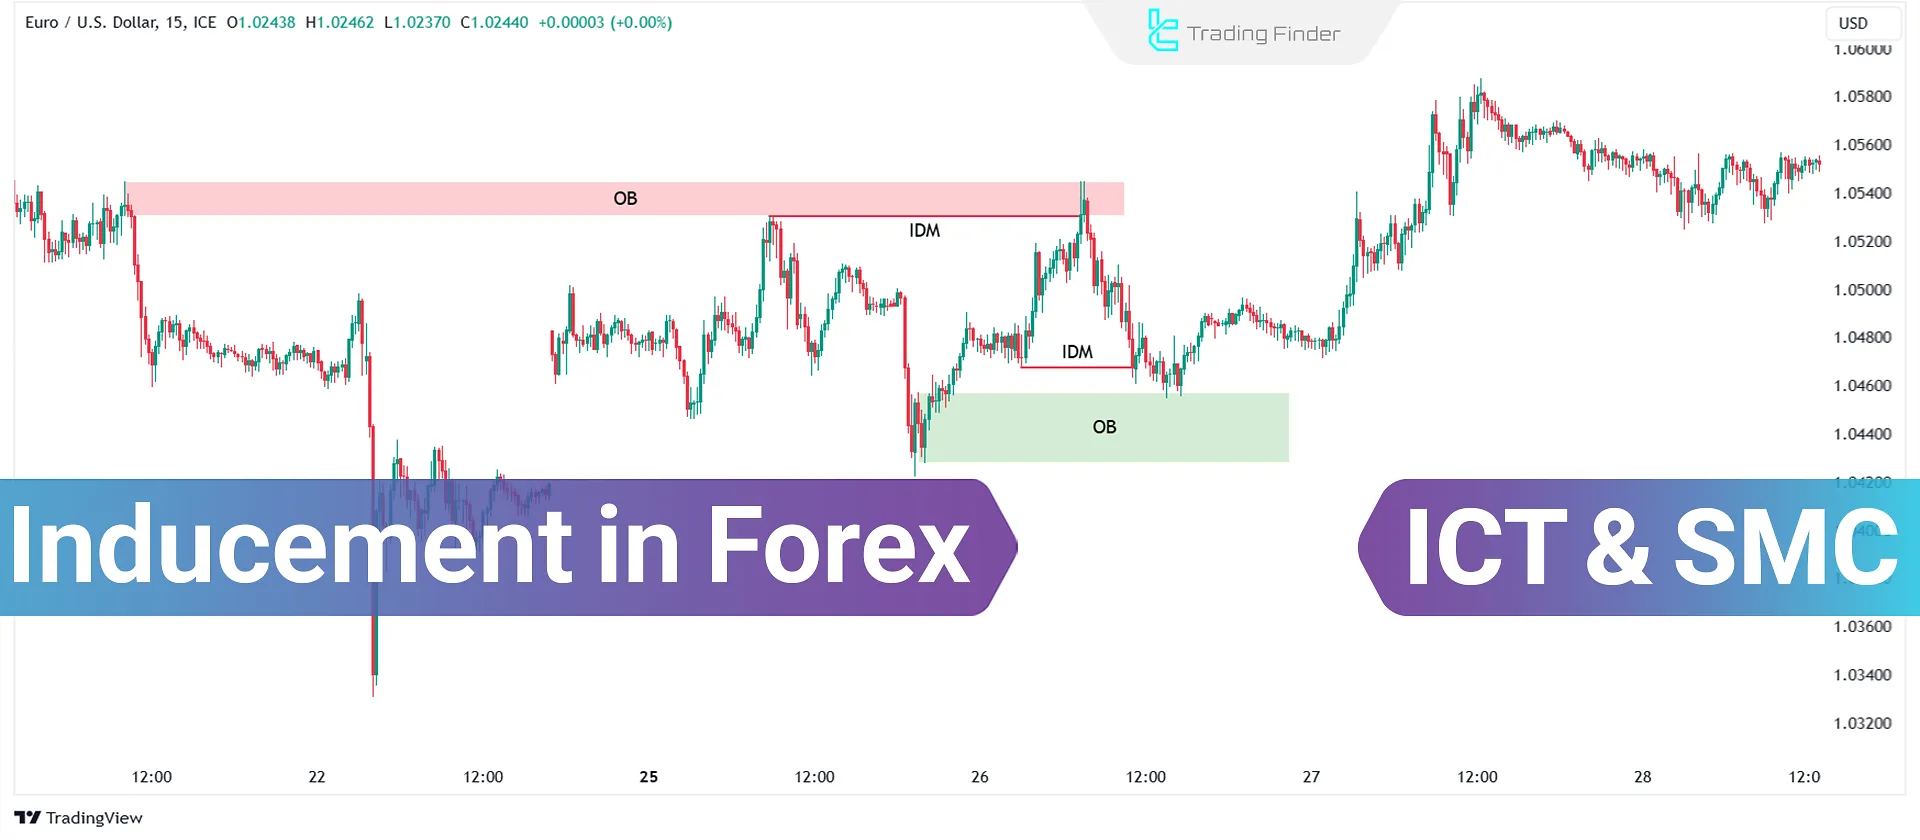
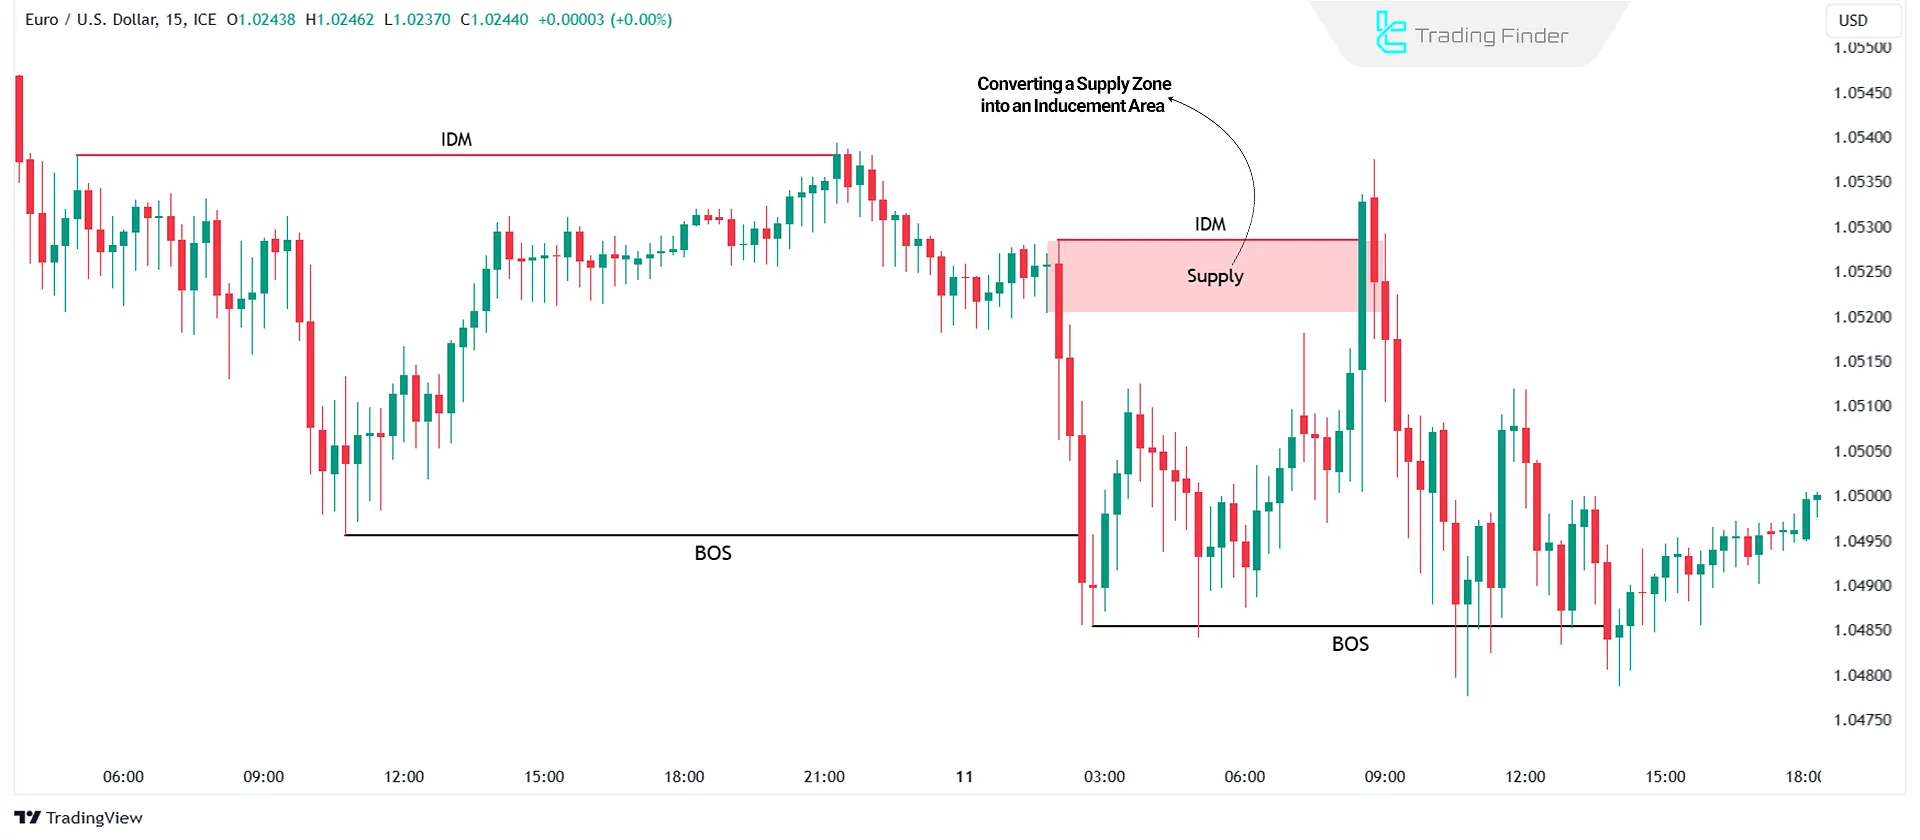
Inducement in Supply & Demand Zones
This type of liquidity inducement is common among supply and demand traders. It happens when the price returns to a key supply or demand zone, but instead of reversing, it breaks through the zone and activates stop-losses. Immediately after this, the price reverses back in the intended direction.
Example of Using Inducement in Supply and Demand Zones
In an uptrend, traders expect the price to reverse from a demand zone after a pullback, continuing the uptrend.
However, the price breaks through the demand zone instead of triggering their stop-losses before reversing.
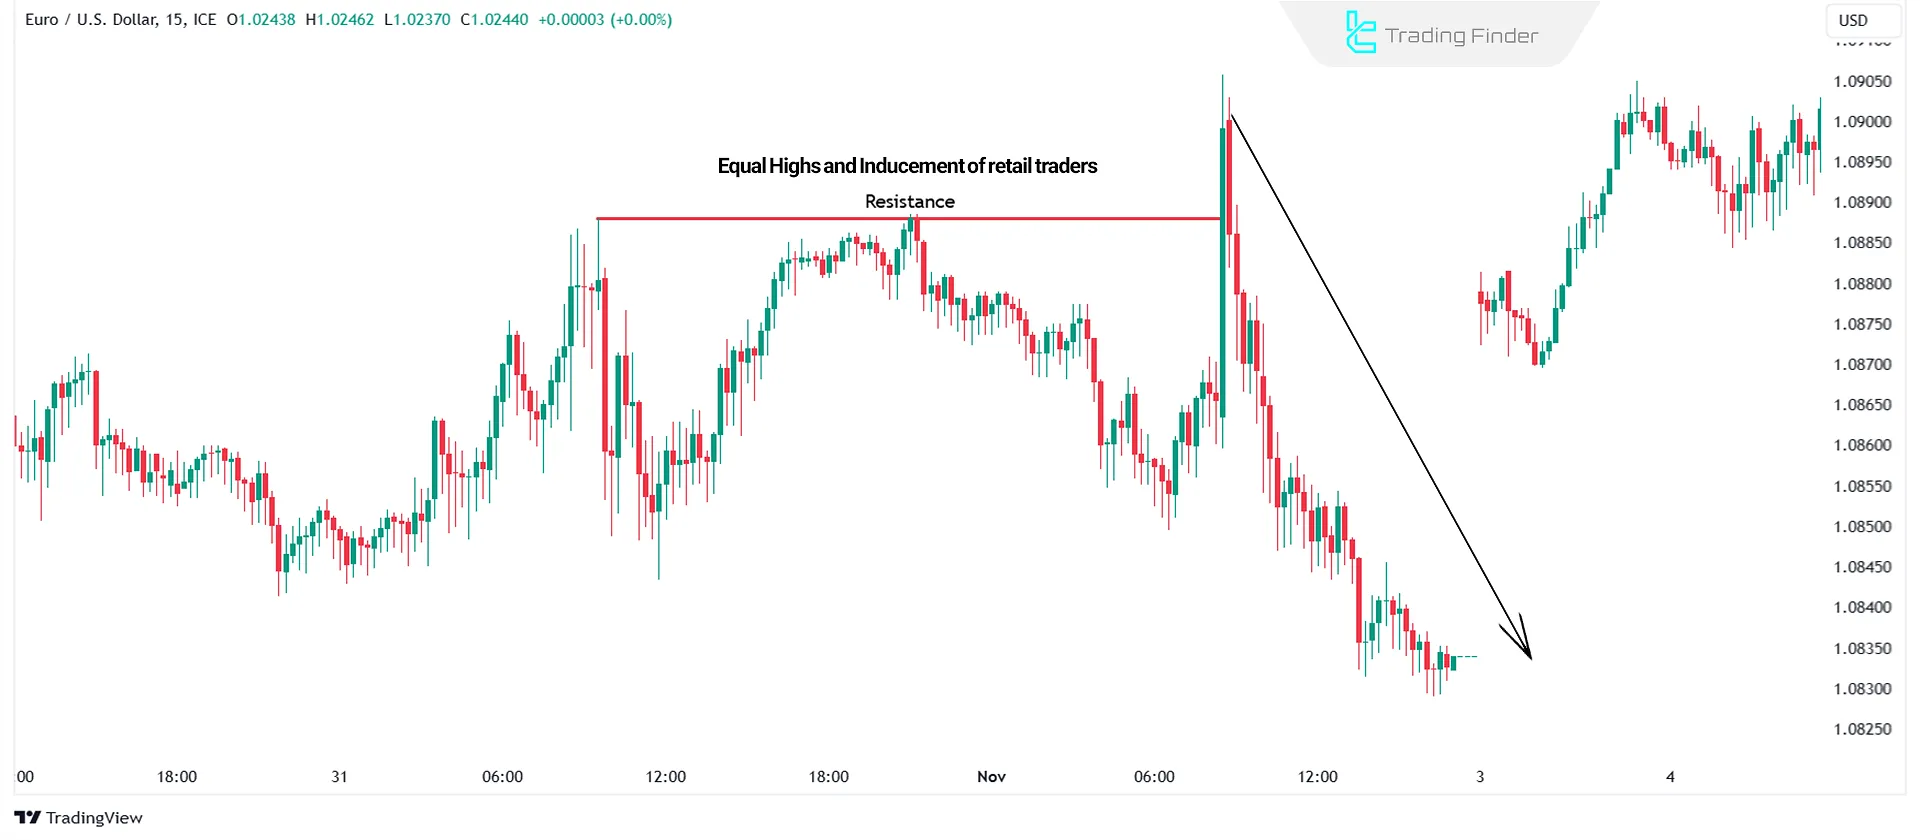
Inducement in Support & Resistance
Support and resistance levels are often liquidity inducement zones.
- When the price approaches support, traders expect it to bounce upward;
- When the price approaches resistance, traders expect it to reverse downward.
However, instead of reversing, these levels become liquidity traps, leading to stop-loss hunts followed by a price reversal in the opposite direction. This is known as False Breakouts.
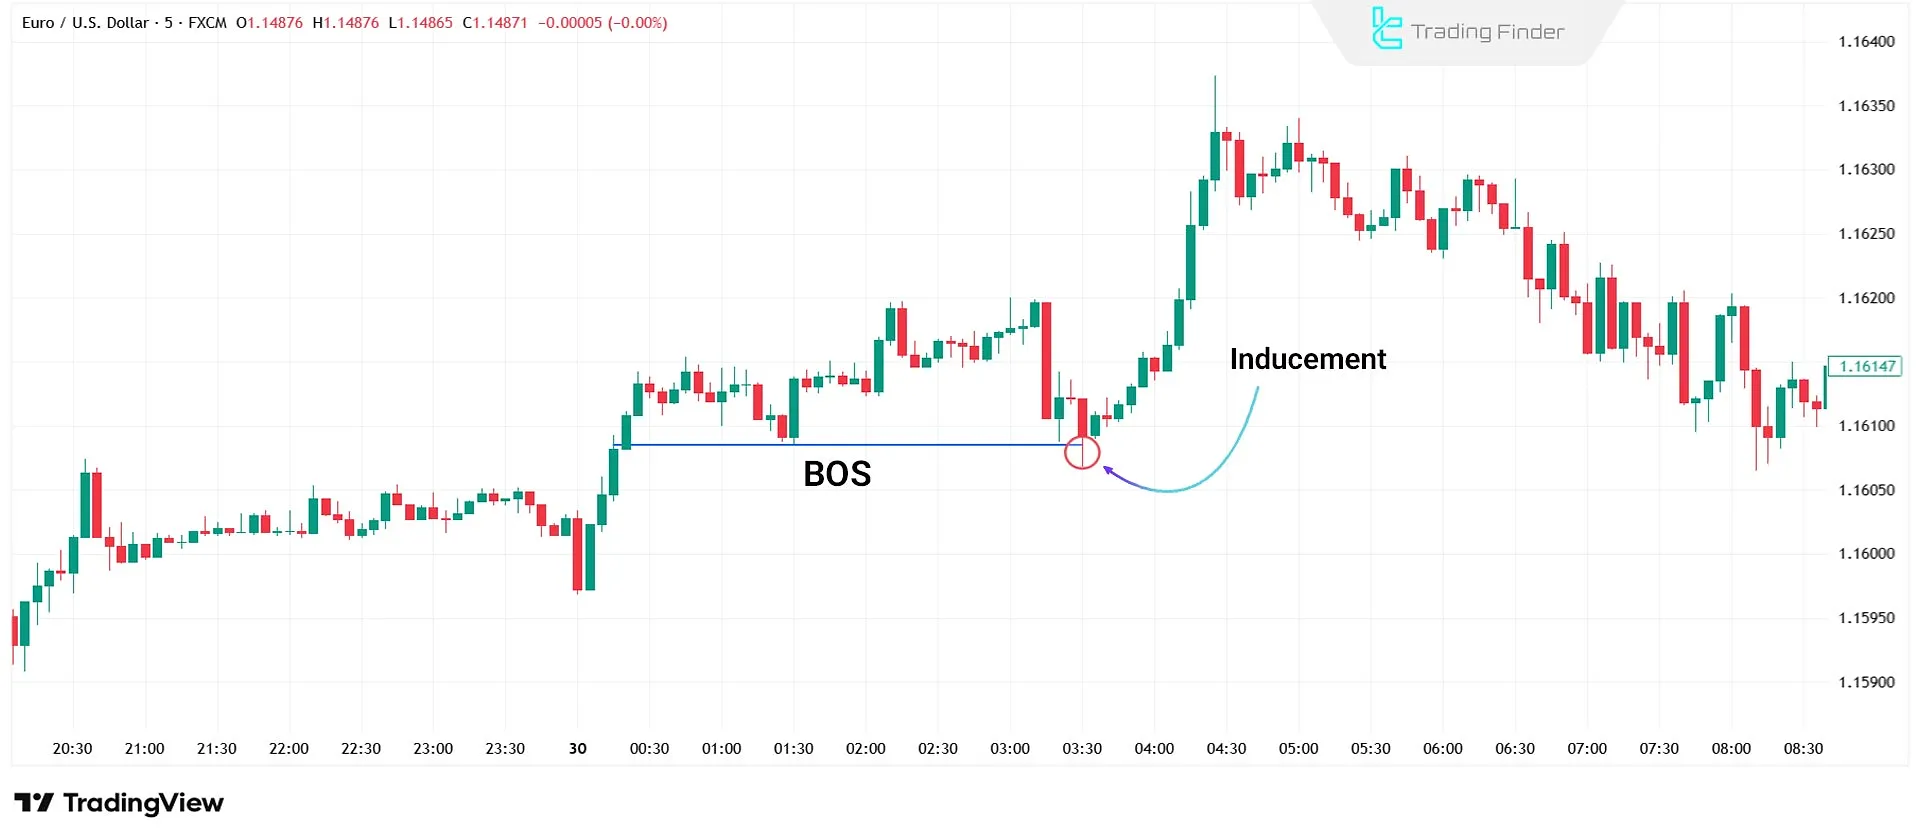
Inducement After Market Structure Break
The Inducement After Break of Structure (BOS Inducement) occurs when, after breaking a key level, the price makes a short retracement before continuing the main trend to absorb the remaining liquidity around the breakout area.
This seemingly corrective move encourages many traders to enter false positions, while in reality, it is a stage of liquidity inducement designed to continue movement in the direction of the prevailing trend.
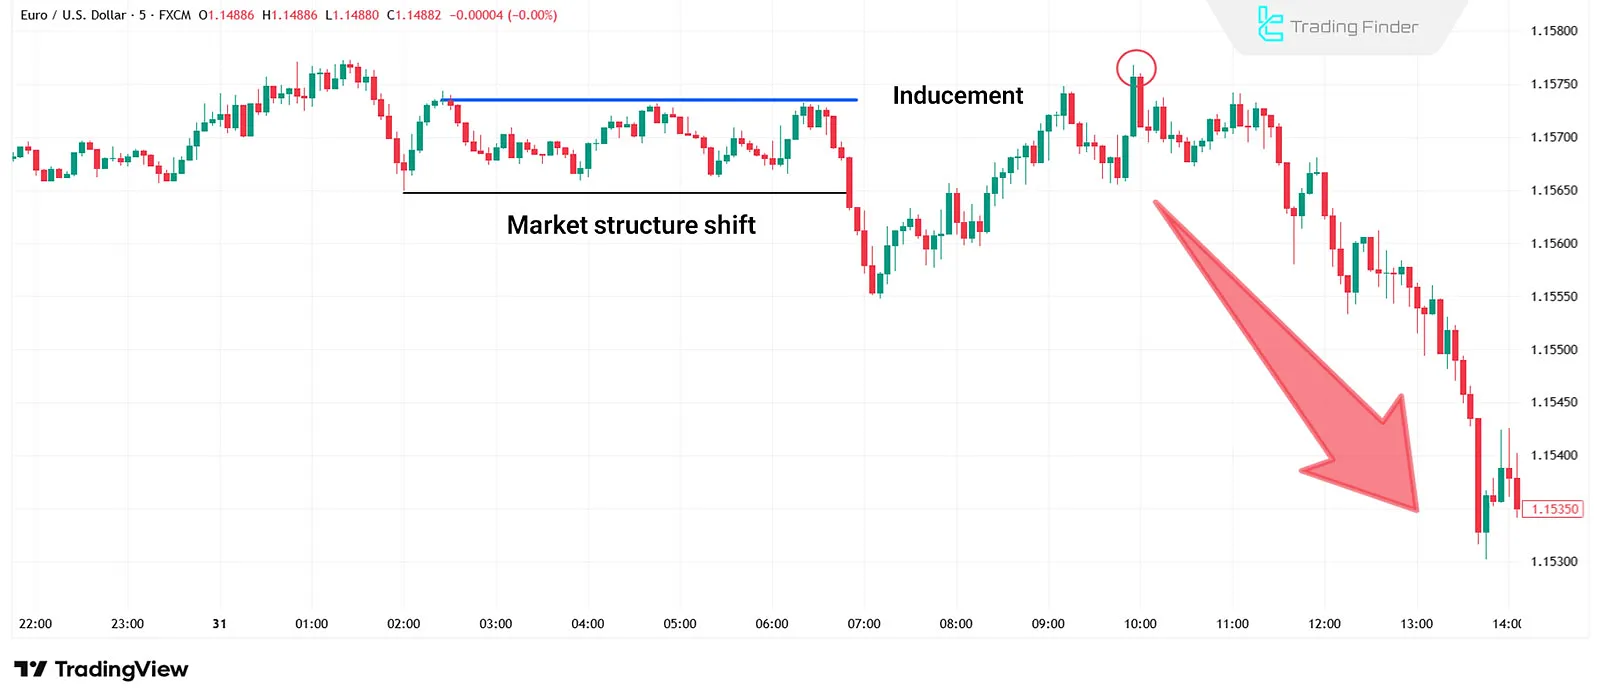
Inducement After Market Shift
The Inducement After Market Shift occurs when the market, after changing its overall direction (for example, from bullish to bearish), makes a corrective move to absorb the remaining liquidity from theprevious direction.
At this stage, many traders mistakenly believe that the previous trend has resumed and enter the wrong position. This temporary pullback is actually a trap to collect liquidity and usually happens before the market continues in the direction of the new trend.
Inducement in Ranging (Consolidation) Markets
Another form of Inducement (IDM) occurs when the price consolidates between support and resistance levels. Retail traders often buy at support and sell at resistance.
However, these levels sometimes act as liquidity traps. Price may break one side of the range, sweep liquidity, then reverse and break the other, collecting more liquidity.
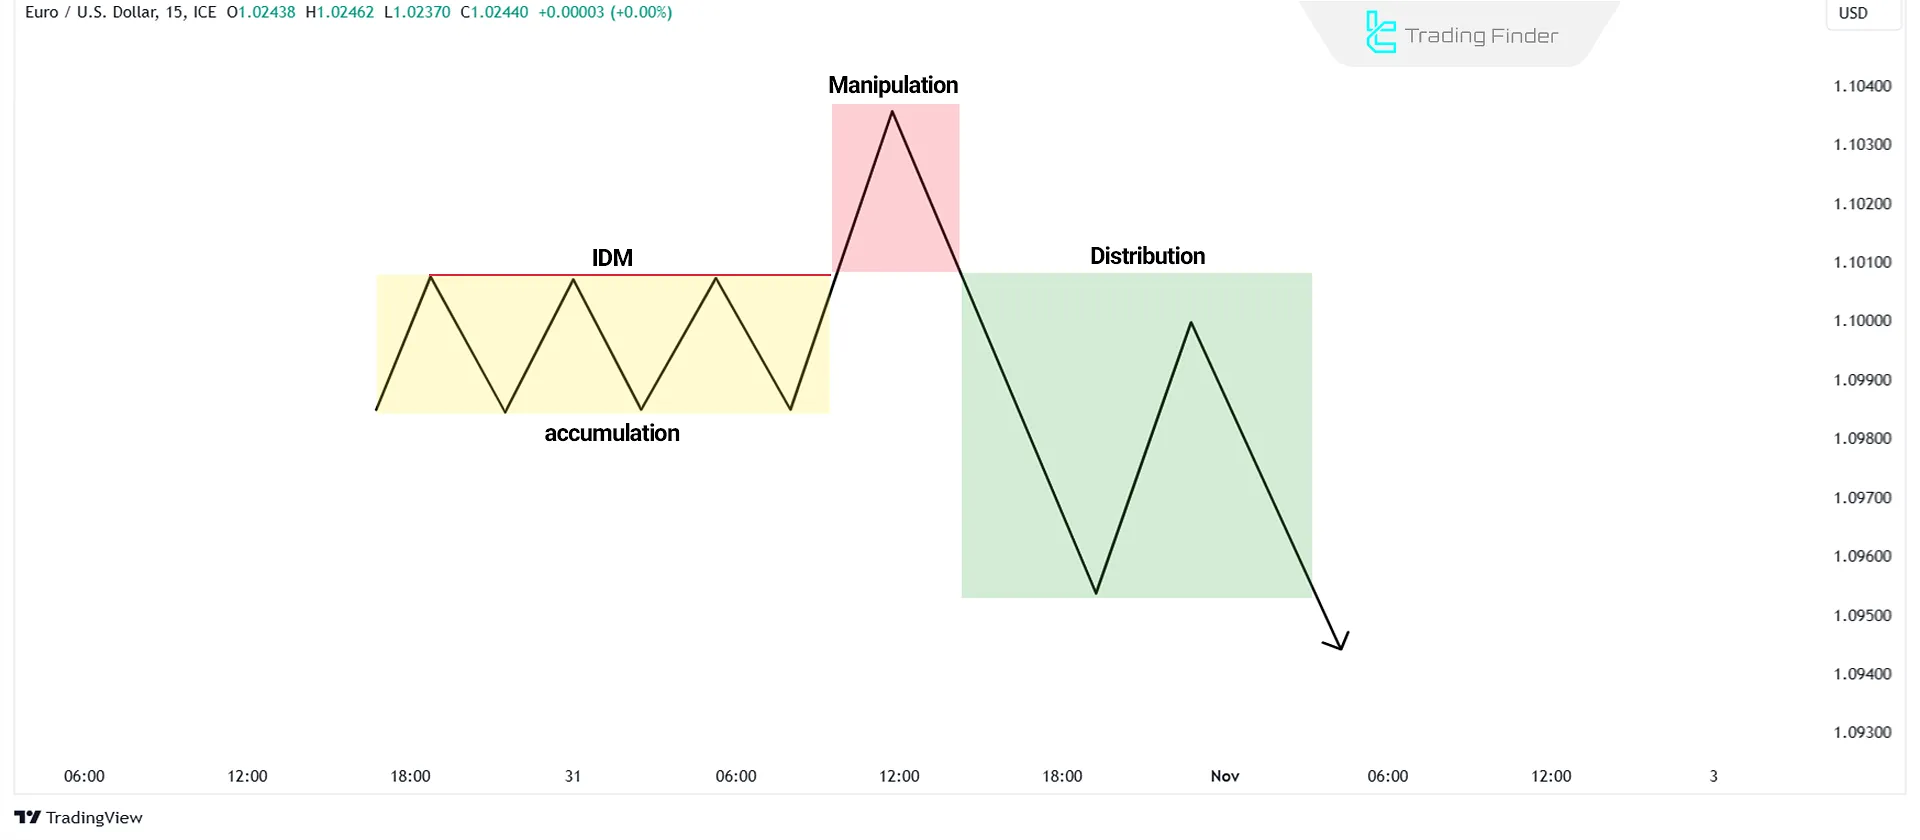
This pattern is also known as "External-to-External Inducement." Some traders call it the Power of Three (Accumulation, Manipulation, Distribution).
How to Identify Inducement in Charts?
Identifying past inducement zones is easier since major breakouts often indicate past liquidity traps. However, spotting Inducement in real-time trading is more challenging.
When traders recognize an inducement move, their stop-losses may already be triggered. However, some effective methods to identify liquidity inducement include:
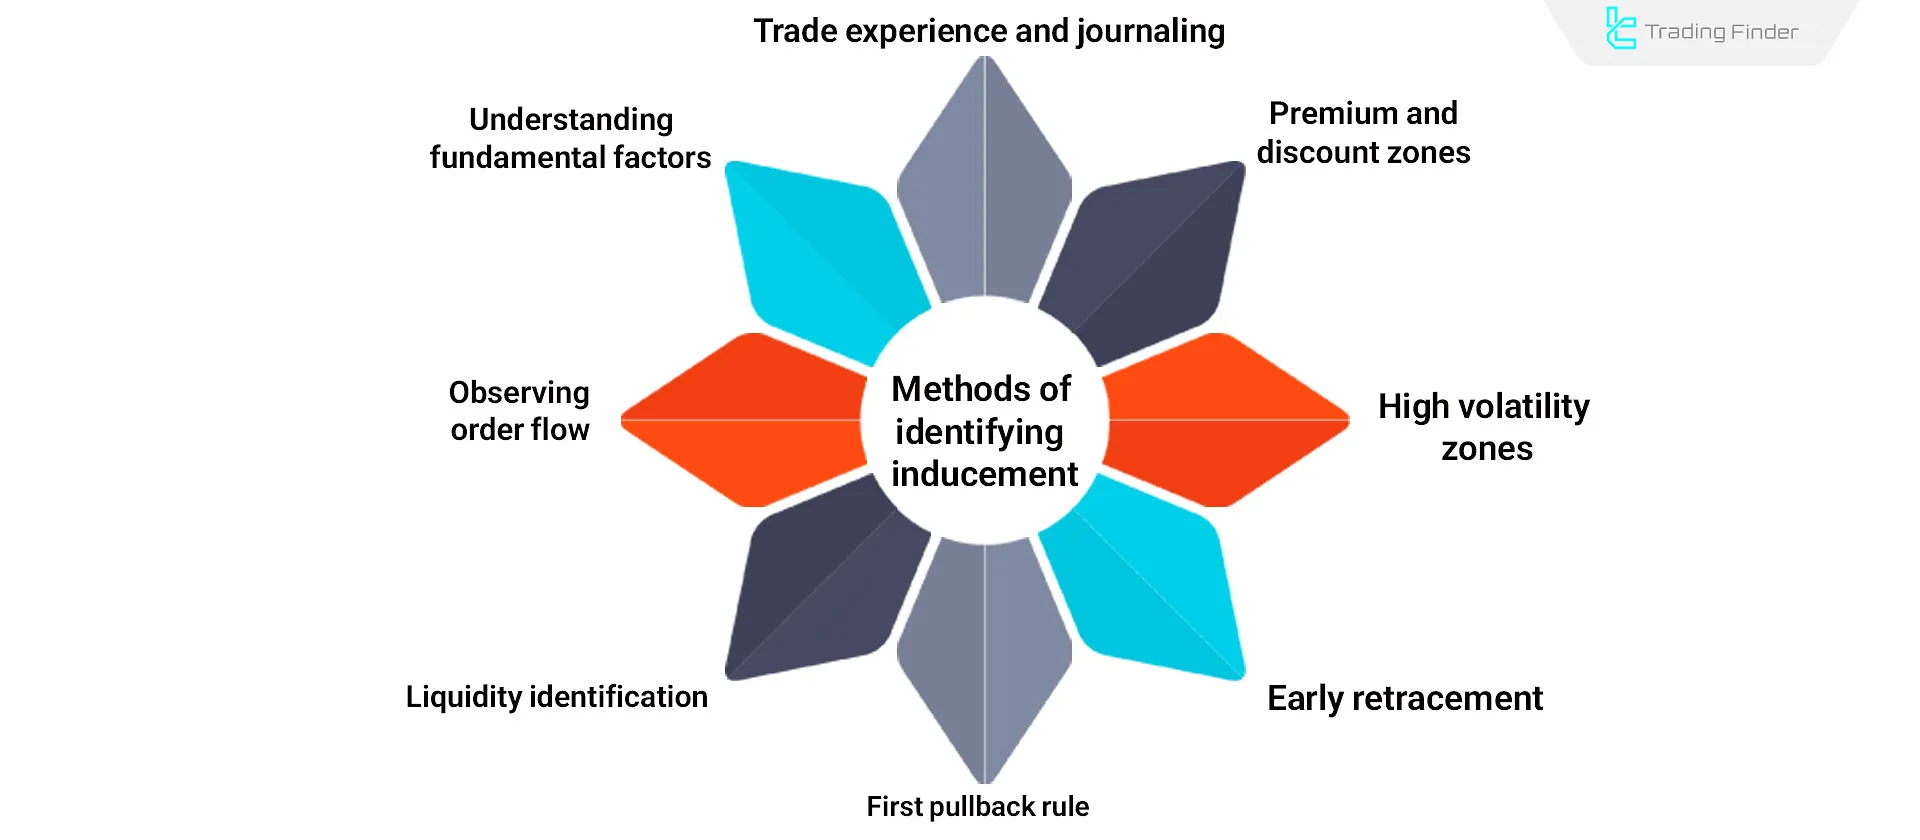
Observing Order Flow
In higher timeframes, analyze order flow direction.
- If the order flow is bearish, any bullish move in lower timeframes could be Inducement;
- If the order flow is bullish, any bearish move in lower timeframes could be Inducement.
Identifying Liquidity Pools
Inducement levels often align with high-liquidity areas. By spotting liquidity pools, traders can identify inducement zones.
First Pullback Rule
The first pullback after a Break of Structure (BOS) or a support/resistance break may be a potential supply or demand zone. However, this first pullback is an inducement level in many situations.
Premature Reversals
It might be an inducement level if the price reverses at a weak level rather than a strong order block or breaker block.
Extreme Volatility Zones
Supply and demand zones that experience high volatility may indicate inducement levels.
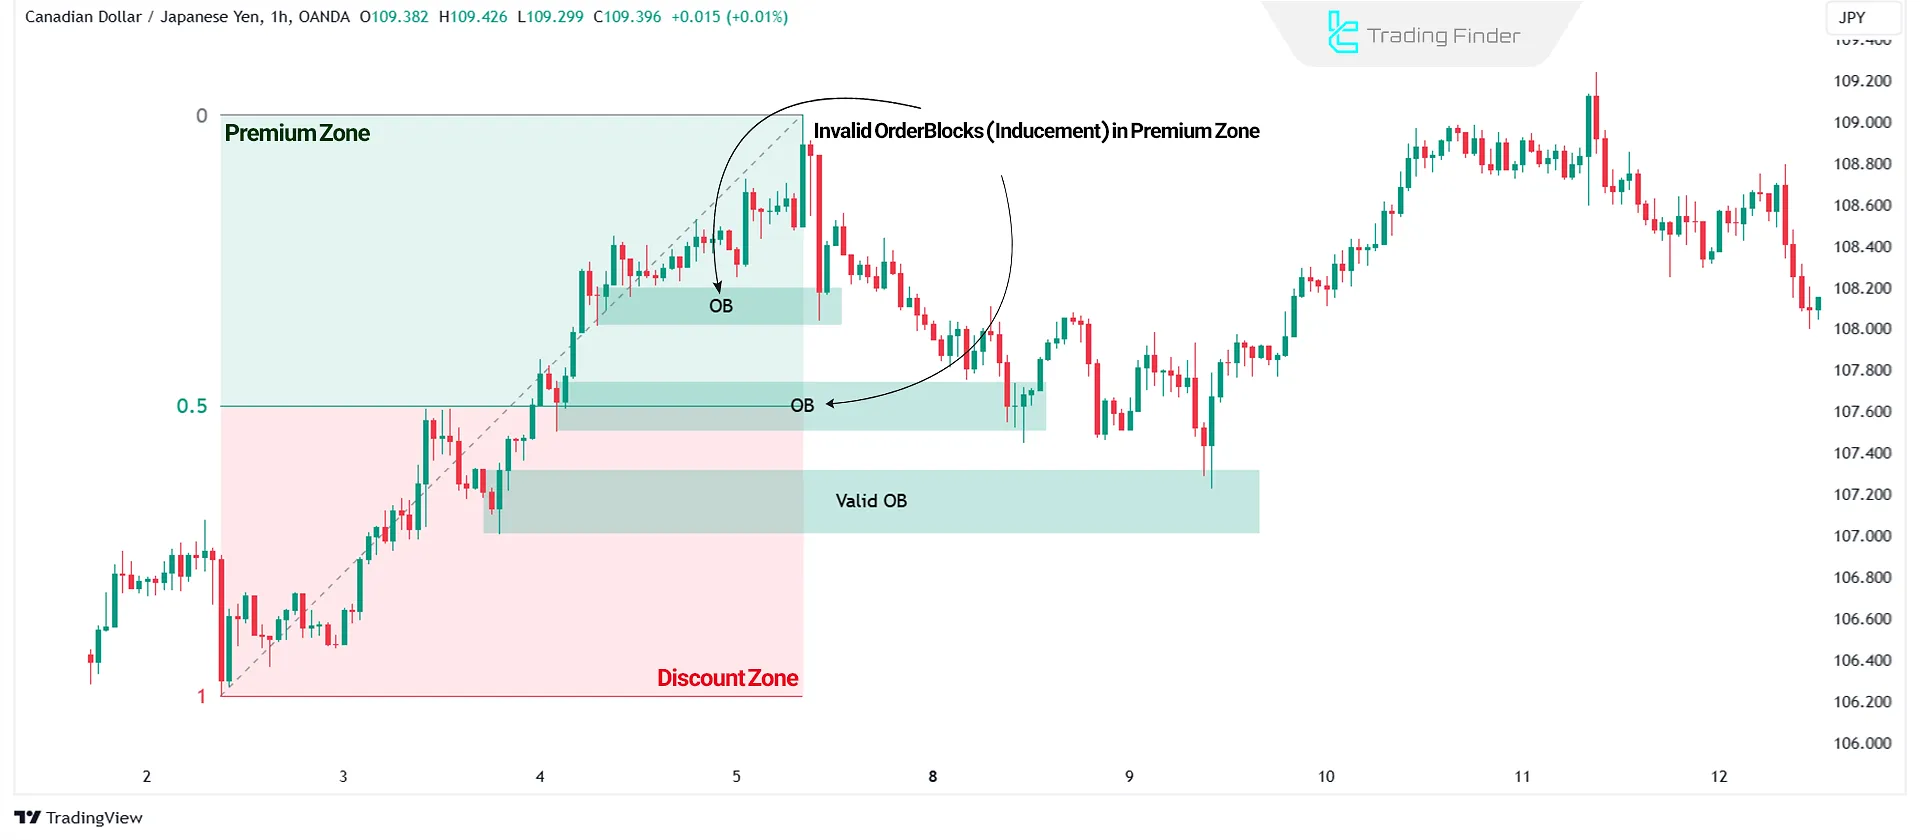
Premium & Discount Zones
Price typically makes deep pullbacks before continuing its trend. Understanding the depth of these pullbacks helps in identifying inducement zones.
- In an uptrend, the upper half of the price move is the premium zone (overpriced), while the lower half is the discount zone (underpriced);
- In a downtrend, the lower half is premium (expensive), and the upper half is discount (cheap);
- Zones formed in the premium area are more likely to be inducement zones, while deeper discount zones have stronger trade levels.
Understanding Fundamental Factors
Traders often become so focused on technical analysis that they overlook the impact of fundamental factors on long-term price movements. Understanding these fundamentals can help in recognizing inducement zones more effectively.
For example, if a fundamental analysis suggests that price is likely to pull back or reverse, you may identify multiple levels along the way as inducement (IDM) rather than valid turning points.
Experience and Trade Journaling
Ultimately, the most reliable way to identify inducement (IDM) in Smart Money trading is through experience and trade journaling. Small details can significantly influence trading decisions.
In the context of liquidity inducement, traders can only recognize true inducement levels after repeatedly making mistakes in those areas in the past. These are the very zones that act as inducement traps.
Inducement Indicator
The Inducement Indicator in MetaTrader 5 is one of the advanced analytical tools in the Smart Money andICT trading styles. It focuses on three key concepts:
Change of Character (CHoCH) , Break of Structure (BOS), and Inducements, providing traders with an accurate understanding of price behavior.
In this tool, red lines represent a Change of Character (CHoCH), and blue lines indicate a Break of Structure (BOS).
The indicator automatically detects when these changes occur and marks them on the chart, allowing the user to instantly identify the current market structure.
Additionally, by identifying Inducement (IDM) zones )areas where price moves or breakouts are deceptive( traders can avoid premature and false entries and wait for final confirmation before entering the market confidently.
This indicator can be used in all financial markets, including Forex, stocks, indices, commodities and cryptocurrencies and is compatible with multiple timeframes .
Inbullish trends, the appearance of BOS at higher levels confirms the continuation of upward movement, while in bearish trends, BOS at lower levels indicates ongoing selling pressure.
In the settings section, users can adjust color themes , structure display style, and sensitivity levels. This flexibility makes the indicator suitable for scalping , intraday, and swing trading strategies.
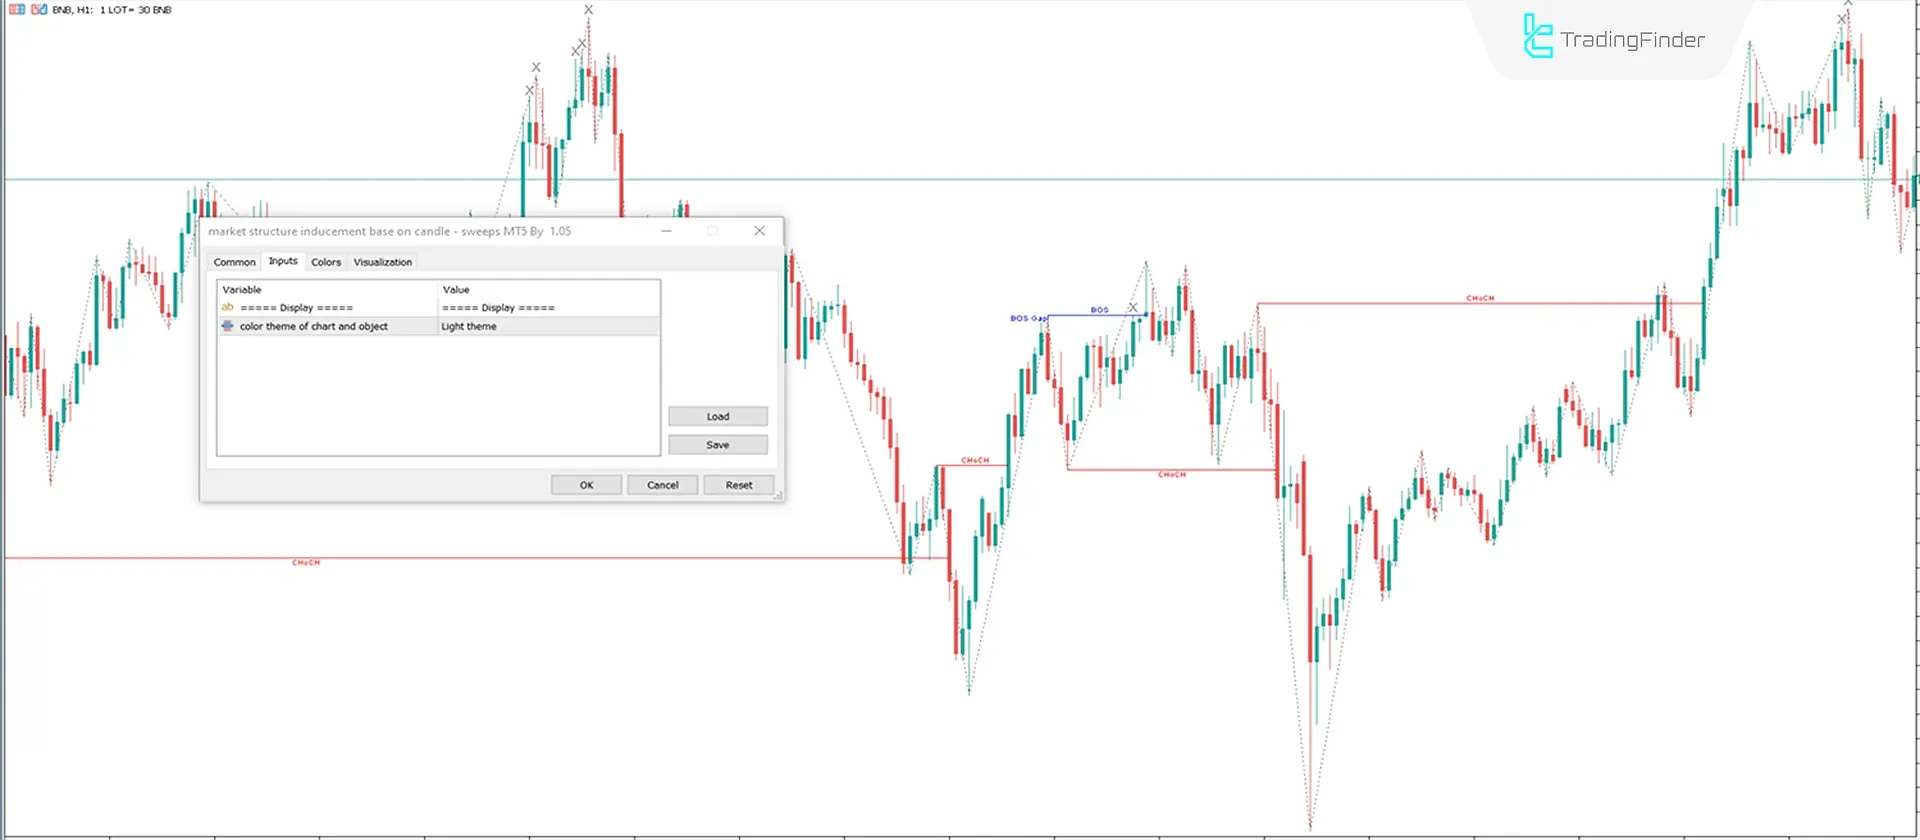
Overall, the Inducement Indicator is a comprehensive tool for analyzing market structure, identifying trend reversal phases, and recognizing Smart Money zones.
By combining insights from BOS, CHoCH, and Inducement, it enhances a trader’s understanding of the accumulation, manipulation, and distribution cycle enabling more accurate and structured trading decisions. Download Links for Inducement Indicator:
- Inducement Indicator for MetaTrader 4
- Inducement Indicator for MetaTrader 5
- Inducement Indicator for TradingView
Limitations of Trading with Inducement
Trading based on liquidity inducement (IDM) is an advanced technique that comes with its own complexities. The key limitations include:
- Uncertainty: Inducement is apsychological concept based on Smart Money’s expected manipulation and stop-loss hunting. There is no concrete evidence confirming it in every scenario;
- Inducement Alone Cannot Be Traded: Inducement should not be used as a standalone trading strategy it primarily serves to identify liquidity zones and avoid being trapped by them;
- Missed Trading Opportunities: Overanalyzing liquidity inducement can lead to missing high-quality trade setups.
Application of Inducement in Different Markets
The concept of Inducement or Liquidity Inducement is not limited to the Forex market. It can be observed in all markets that have structural liquidity and major institutional participants.
However, the way it appears and its impact vary across markets, depending on the level of participation, depth of liquidity, and behavior of market participants.
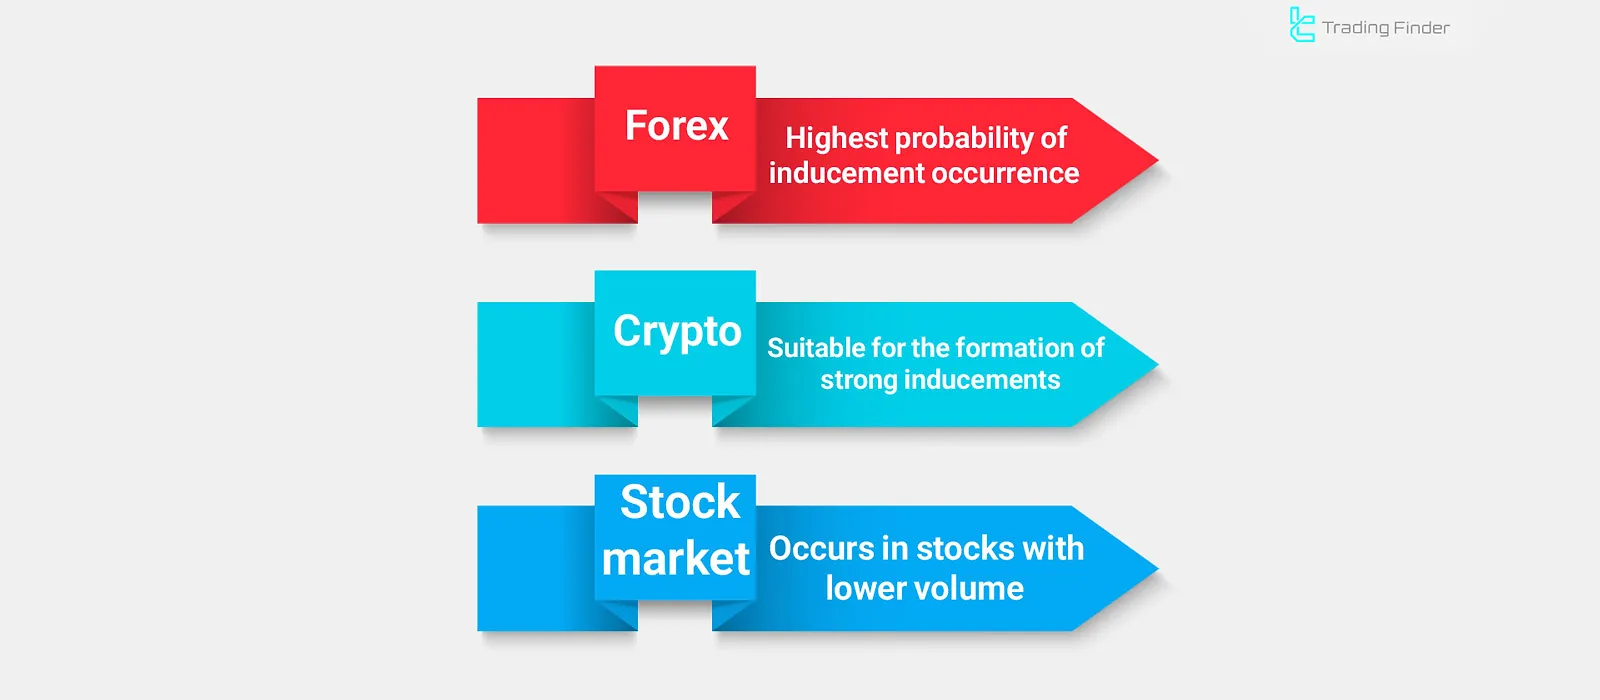
Inducement in the Forex Market
The Forex market has the highest probability of inducement occurrences because the large volume of interbank transactions and the presence of major financial institutions create deliberate movements aimed at liquidity collection.
In this market, inducement typically appears in the form of fake breakouts of structural highs or lows, tricking retail traders into entering the market prematurely.
On lower timeframes, these movements often occur before the shift in Daily Bias, with the main goal of clearing liquidity before the major move begins.
Inducement in the Cryptocurrency Market
The cryptocurrency market, due to its lower liquidity and higher sensitivity to collective sentiment, provides an ideal environment for the formation of strong inducements.
Liquidity manipulation by whales and exchanges is common; traders often observe fake breakouts and liquidity grabs around consolidation zones or before major news releases.
Inducement in crypto is often accompanied by abnormal trading volume and long candle wicks, and can occur multiple times within a single day on shorter timeframes.
Inducement in the Stock Market
In the stock market, inducement is more common in low-volume stocks or right before the release of financial reports.
In such cases, large players manipulate retail investors’ emotions through sudden large candles or spikes in volume, directing liquidity toward the opposite direction of the actual intended move.
Because of limited trading hours and institutional order activity, inducement in stocks often appears as price gaps (Gaps) and strong early-day moves at the market open.
Inducement vs. Liquidity in Smart Money Concepts (SMC)
Both Inducement and Liquidity are key concepts in Smart Money trading, but they differ. Table of Differences Between Inducement and Liquidity:
Feature | Inducement | Liquidity |
Definition | A deceptive movement by Smart Money | The accumulation of stop and pending orders |
Main Purpose | To attract liquidity and trigger stop-losses | To provide the driving force for market movement |
Location of Occurrence | After a BOS or a market bias shift | At highs, lows, and consolidation zones |
Market Direction | Opposite to the main trend (temporary) | In line with the trend after liquidity absorption |
Role in SMC | Manipulation phase | Liquidity activation phase |
Visible Signs | False breakout, quick retracement, price manipulation | Stop-hunt, liquidity pool, break of structure |
Tradability | Indirect; used as a filter or confirmation tool | Direct; entry after liquidity sweep |
Retail Traders’ Risk | High; early entries and stop-loss hits | Moderate; risk of rapid price reversal |
Additional Notes on Liquidity Inducement Trading
Before we finish, here are several important points about Inducement Trading that you should know. These notes may seem simple or obvious, but soon you’ll realize that neglecting them is one of the most common mistakes new traders make.
The Role of Multiple Timeframes
Understanding the role of multiple timeframes can help you better determine where and when to enter the market.
Liquidity inducement often occurs over longer periods, so avoid making hasty decisions based on short-term price fluctuations. Always keep the higher timeframe perspective in mind.
Proper Risk Management
Calculate your position size carefully based on your risk tolerance and account balance to avoid potential losses.
You will make mistakes in trading sometimes entering too early or too late and that’s normal. Therefore, risk management that protects your capital from irrecoverable losses is crucial.
Maintaining Discipline
Do not let emotions control your trading. If your setup hasn’t formed yet, don’t force a trade.
When your setup is confirmed, execute it without hesitation. Avoid letting greed or fear dictate your actions. Even when you take trades that hit your stop loss, remember that this is part of the process. Learn from it and move on.
That’s why you need a well-defined trading plan with clear rules for entry, exit, and risk management it’s the only way to maintain consistency in trading.
Never Stop Learning
Stay informed about market dynamics , economic indicators, and evolving trading strategies to continuously adapt your approach.
Ongoing analysis and backtesting can improve your ability to identify liquidity inducement patterns and enhance your overall decision-making process.
Conclusion
Inducement in trading refers to market manipulation by institutional players to trap retail traders and absorb liquidity.
By understanding Inducement, traders can avoid false setups and improve trade execution. Identifying liquidity pools, order flow, and key market structures can help recognize these traps.


