


Aligning entry points between higher and lower timeframes using concepts such as Order Block and Fair Value Gap (FVG) in ICT Style and Smart Money strategies helps identify precise and optimal entry points. This method can also improve the Risk to Reward Ratio.
This time synchronization is considered valid when the market structure on the higher timeframe defines the direction of movement, and the lower timeframe merely serves to optimize entry execution.
Otherwise, focusing solely on lower-timeframe signals without structural support reduces entry accuracy and leads to an increased occurrence of premature stop-loss hits.
Pros and Cons of Increasing Risk to Reward Ratio Using Lower Timeframes
Increasing the risk-to-reward ratio with lower timeframes has multiple advantages and disadvantages:
Pros | Cons |
Optimized entry point and reduced stop-loss | Increased chance of stop-loss being triggered early |
Increased trade accuracy | More frequent stop-loss triggers due to rapid fluctuations |
Better control and utilization of hidden liquidity | Requires deep market analysis knowledge |
Difference Between Genuine Increase and Apparent Increase in Risk-to-Reward Ratio on Lower Timeframes
A genuine increase in RRR is formed when a trade entry is executed in a zone where the market, from both structural and liquidity perspectives, has the capacity to continue its movement.
In contrast, an apparent increase in RRR is usually the result of premature entry, elimination of the market’s natural fluctuations, and disregard for price behavior on lower timeframes.
Comparison Table of Genuine vs Apparent Risk-to-Reward Increase on Lower Timeframes:
Comparison Criteria | Genuine Increase in Risk-to-Reward Ratio | Apparent Increase in Risk-to-Reward Ratio |
Formation Basis | Optimization of the entry point based on structure and liquidity | Excessive tightening of stop loss without structural backing |
Relation to Market Structure | Aligned with the direction and logic of the higher timeframe | Ignoring the dominant market structure |
Entry Behavior | Entry within a zone that has continuation potential | Premature entry and high sensitivity to volatility |
Stop-Loss Condition | Logical and proportionate to market volatility | Compressed and vulnerable to noise |
Trade Success Probability | Balanced and sustainable over the long term | Reduced despite a numerically high RRR |
Liquidity Impact | Aligned with effective liquidity targeting | Exposed to internal liquidity collection |
Final Outcome | Genuine improvement in trade quality | Numerical increase in RRR with degraded execution quality |
Role of Higher-Timeframe Market Structure in the Validity of Lower-Timeframe Entries
Entering on a lower timeframe without alignment with the market structure of the higher timeframe is often statistically invalid. Lower timeframes serve only as the execution layer and do not determine market direction. This direction is formed within the highs and lows structure of higher timeframes.
When a lower-timeframe entry is placed against the prevailing structural flow of the market, even the most precise FVG or Order Block cannot prevent premature stop-loss activation.
For this reason, analyzing higher-timeframe market structure acts as the primary filter for lower-timeframe entries. In the Investopedia risk-to-reward educational article, the concept of risk-to-reward is explained in full.
How to Increase the Risk to Reward Ratio (RRR)?
To optimize trade entries and increase the risk-to-reward ratio, you must first analyze the higher timeframe and identify key entry zones such as Order Blocks or Fair Value Gaps (FVG).
Then, by switching to lower timeframes and conducting a more precise analysis, you can refine (narrow) these entry zones. This reduces the stop-loss distance, ultimately improving the risk-to-reward ratio (RRR).
This method is taught in video format on the TTrades YouTube channel:
The process of increasing the risk-to-reward ratio using lower timeframes consists of the following steps:
#1 Identifying Key Zones on the Higher Timeframe
To optimize trade entries and improve the risk-to-reward ratio, the trader must first determine an Order Block, Fair Value Gap (FVG), or liquidity zone on a higher timeframe (e.g., 1-hour or 4-hour).
This zone serves as a potential entry area and acts as a foundation for further analysis.
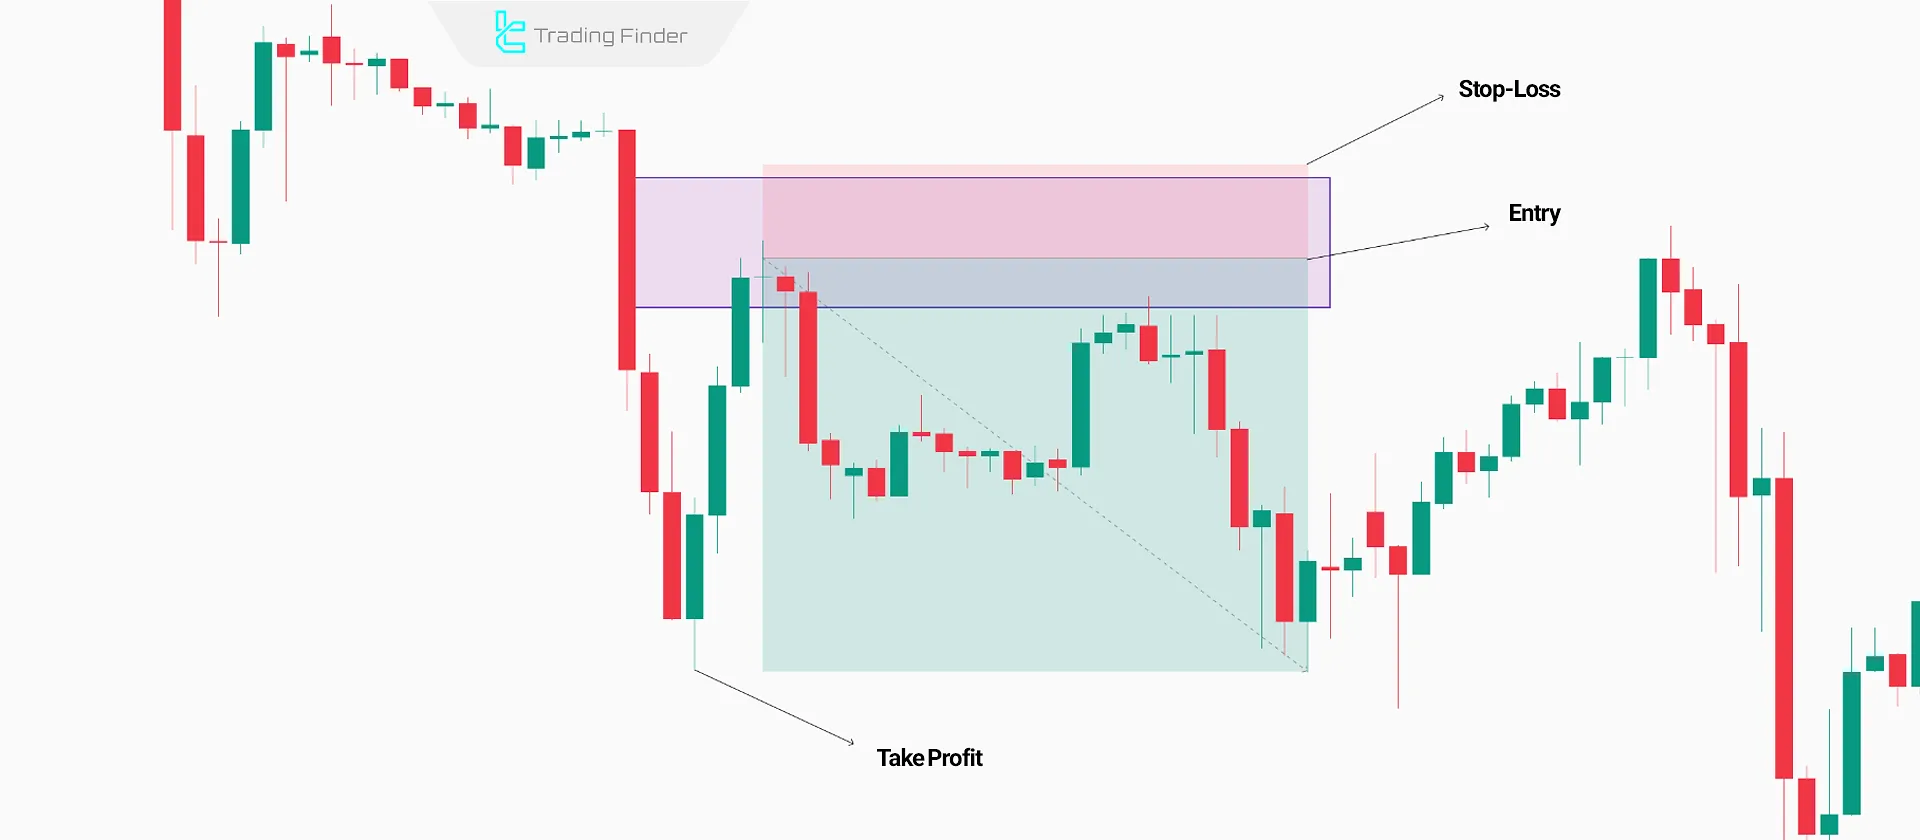
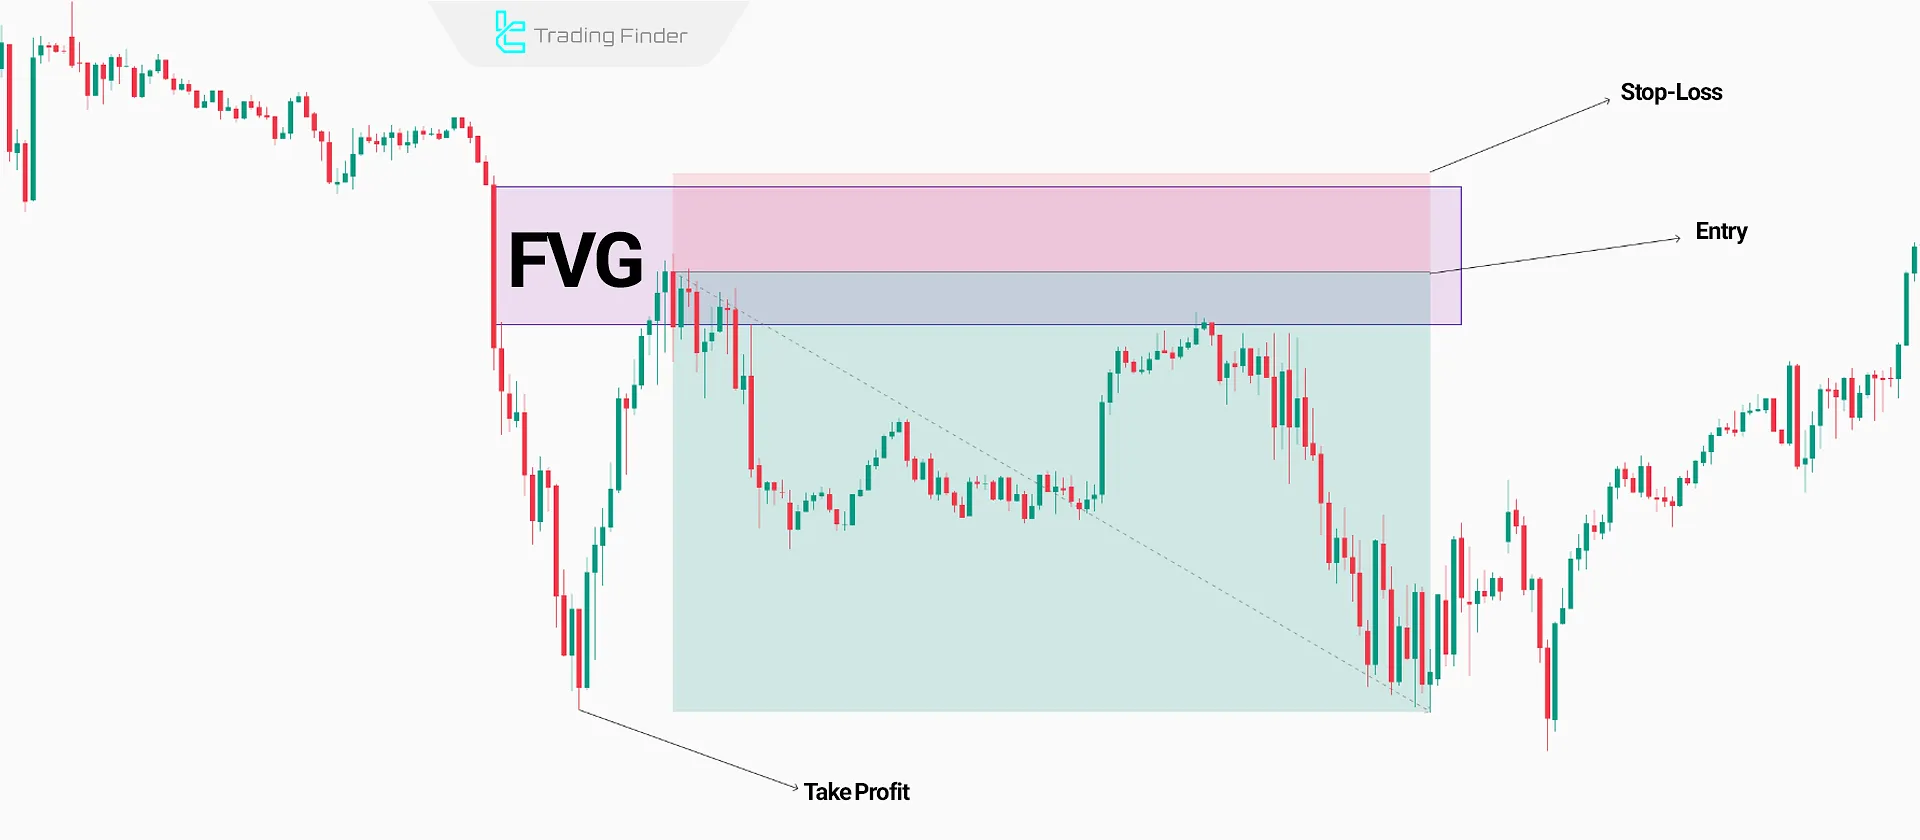
Based on the FVG strategy and liquidity in Forex, the stop-loss is placed above the candle, creating the FVG, while the take-profit is positioned below the liquidity under the previous low.
#2 Precise Analysis on the 15-Minute Timeframe
Once the entry zone is determined on the higher Timeframe, traders should switch to the 15-minute Timeframe to refine entry points. During this timeframe, analyzing the break of structure (BOS), liquidity and narrowing the entry zones, enhance trade accuracy.
#3 Final Entry Refinement on the 5-Minute Timeframe
At this stage, the trader moves to the 5-minute timeframe to pinpoint the entry area with greater precision. This timeframe can reveal entry points with tighter stop-losses, thus improving the risk-to-reward ratio.
However, reducing the stop-loss on lower timeframes may lead to more frequent stop-loss activations due to the increased market volatility at these levels.
Practical Example of Increasing the Risk-to-Reward Ratio by Optimizing Entry on a Lower Timeframe
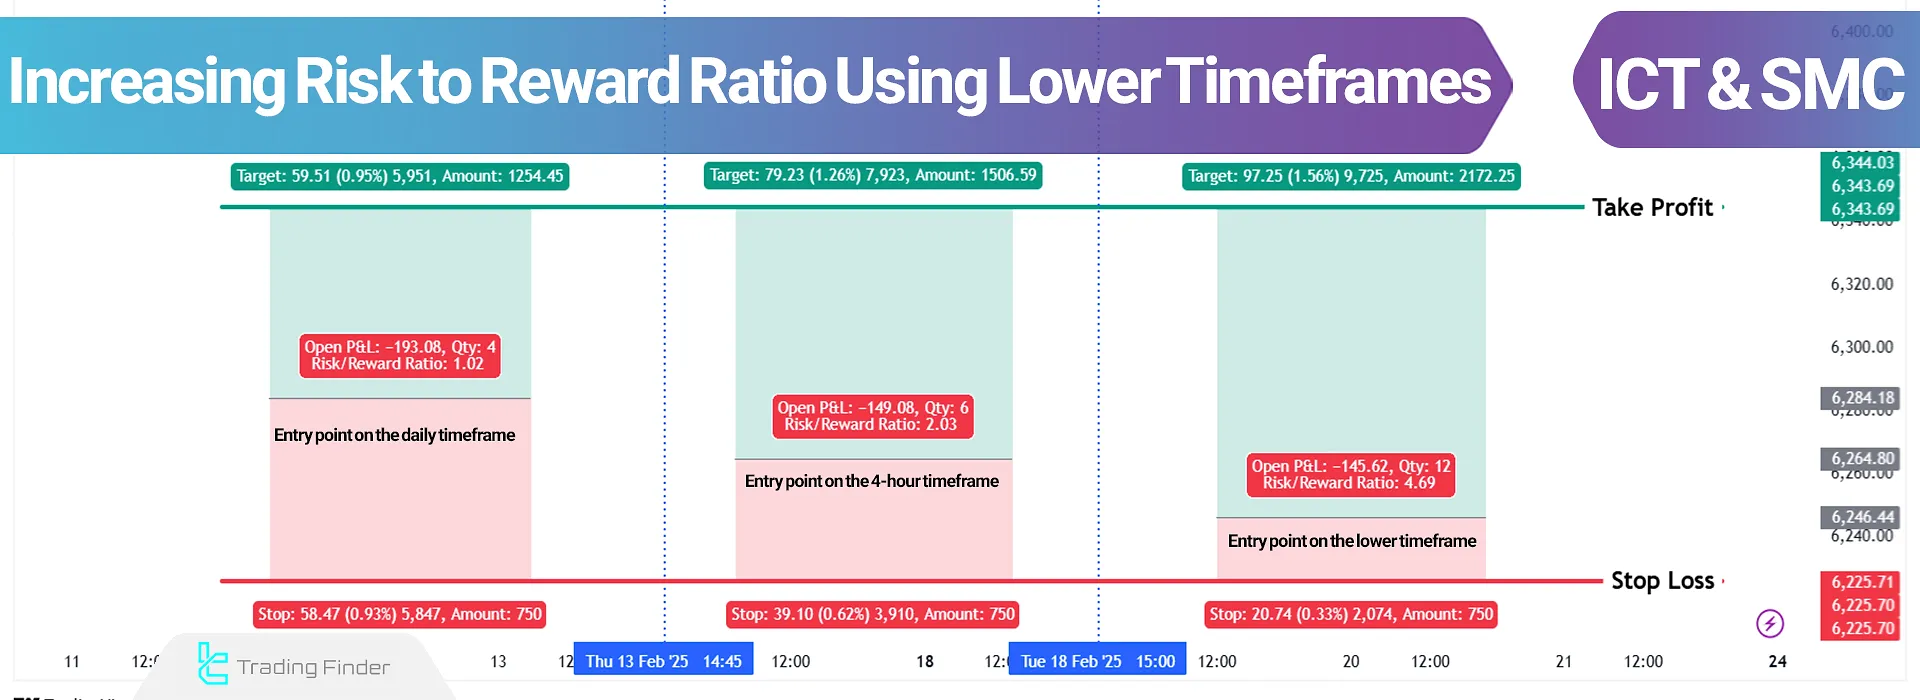
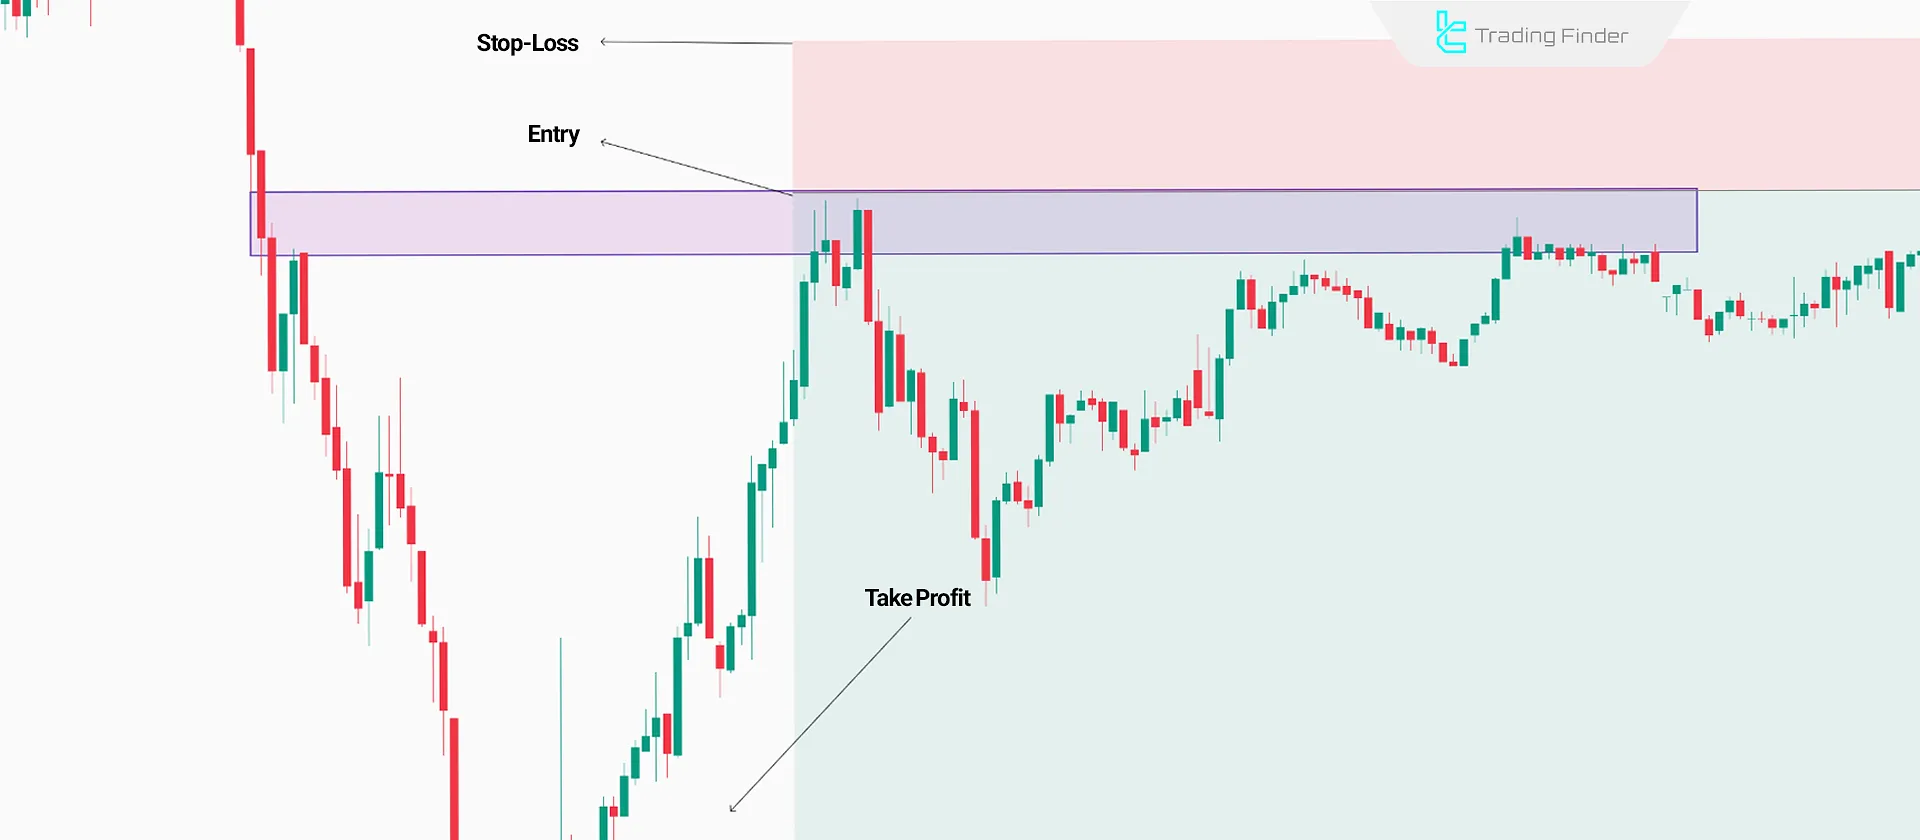
In this example, the overall market direction is defined on the higher timeframe, and the entry zone is determined based on market structure and liquidity logic.
After a price retracement, the trade entry is executed within the Fair Value Gap (FVG), a zone that aligns with the primary market flow and allows for a logical reduction of the stop-loss distance.
By shifting the entry to a lower timeframe, the entry zone becomes narrower and the stop loss is placed just beyond the FVG zone. In this scenario, the take-profit target remains based on the higher-timeframe price objective, and no change is made to the target structure.
The result of this process is an increased risk-to-reward ratio due to the reduced distance between the entry point and the stop loss, rather than an unrealistic increase in profit potential.
This example demonstrates that the use of a lower timeframe leads to a genuine increase in RRR only when the entry is executed within a zone where the market has structural capacity for continuation.
Otherwise, compressing the stop loss on the lower timeframe merely increases the likelihood of premature stop-out.
Using lower timeframes gradually narrows the entry zone and stop-loss, while the take-profit target stays fixed based on the higher timeframe. This results in an improved risk-to-reward ratio.
However, while reducing stop-loss distances increases the risk-to-reward ratio, it also raises the likelihood of early stop-loss activations, leading to multiple consecutive stop-outs.
Impact of Internal and External Liquidity on RRR Quality on Lower Timeframes
Price movement on lower timeframes is heavily influenced by internal market liquidity. Many stop-loss activations that occur on lower timeframes are in fact part of the internal liquidity collection process and take place before the primary price movement begins.
When entries on lower timeframes are placed in proximity to internal liquidity, the probability of being stopped out increases.
In contrast, aligning the entry with external liquidity targeting and the main directional path of the market not only increases the risk-to-reward ratio but also enhances its overall stability.
Limitations of Excessive Entry Zone Compression on Lower Timeframes
Compressing the entry zone on lower timeframes, when done without proper understanding of the market’s natural fluctuations, can produce counterproductive results.
On lower timeframes, the market exhibits higher volatility, and attempting to eliminate these fluctuations through an overly tight stop loss often results in premature stop activation.
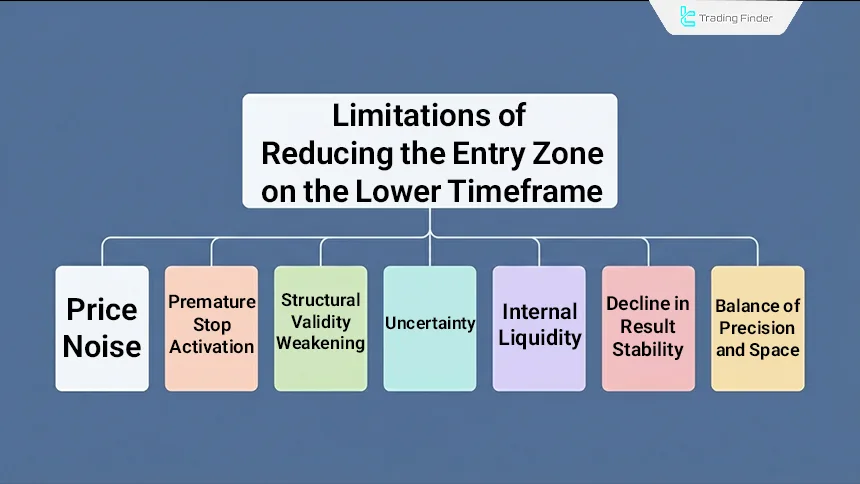
Limitations of reducing the entry zone on lower timeframes:
- Price noise: Increased random volatility on lower timeframes reduces entry accuracy;
- Premature stop activation: Excessive stop-loss compression leads to rapid stop hits;
- Structural integrity degradation: Extreme entry zone compression weakens its relationship with market structure;
- Uncertainty: A larger numerical risk-to-reward ratio does not necessarily indicate a higher-quality trade;
- Internal liquidity: Entry near internal liquidity increases the probability of consecutive stop-outs;
- Reduced result stability: Repeated stop-outs decrease long-term performance consistency;
- Balance between precision and space: Maintaining reasonable breathing room for price is essential for improving entry quality.
Differences in Lower Timeframe Performance Across Markets
The effectiveness of lower timeframes in increasing the risk-to-reward ratio is directly influenced by the nature of each market and its liquidity distribution.
Differences in market depth, trading session structure, and volatility intensity mean that the same entry timeframe does not produce identical results across all markets. Understanding these differences is a prerequisite for effective use of lower timeframes in entry optimization.
Comparison of lower timeframe performance in different financial markets:
- Risk-to-reward in Forex: High liquidity depth and well-defined session structures make lower-timeframe entries more reliable during active market hours;
- Risk-to-reward in Cryptocurrencies: Extreme volatility and fragmented liquidity increase the likelihood of premature stop activation;
- Risk-to-reward in Indices: Lower timeframes perform more precisely during official trading hours.
Relationship Between Trading Sessions and Risk-to-Reward Improvement
Entry quality on lower timeframes is highly dependent on the timing of execution. During low-volume market hours, random volatility increases and the reliability of lower-timeframe signals declines.
Conversely, during active sessions, price behavior becomes more structured and liquidity flows more purposefully.
For this reason, the use of lower timeframes to enhance the risk-to-reward ratio achieves its highest effectiveness when aligned with active market sessions and real liquidity flow.
Suitability of Lower-Timeframe RRR Enhancement to Trader Profiles
Increasing the risk-to-reward ratio on lower timeframes requires acceptance of a higher frequency of stop-outs and effective management of the associated psychological pressure.
This approach is better suited for traders who maintain strong focus on precise execution, trading discipline, and tolerance for short-term fluctuations.
In contrast, traders who prefer greater breathing room and fewer entries may achieve more stable performance on intermediate timeframes.
Risk-to-Reward Indicator
The Risk Reward Indicator is an analytical tool in the field of risk management that focuses on the three core components of a trade: Entry, Stop Loss, and Take Profit, and accurately calculates the risk-to-reward ratio (RRR) for each trading position.
This indicator displays the RRR value numerically on the chart and plots separate horizontal lines for the entry price, stop loss, and take profit, clearly defining the structure of the trade.
Within this tool, the blue line represents the entry price, the red line indicates the Stop Loss level, and the green line marks the Take Profit level.
This visual representation allows the trader to evaluate the potential reward relative to the expected risk both numerically and structurally before executing the trade.
The calculation logic of the indicator is based on the difference between the entry price and the stop loss as risk, and the difference between the entry price and the take profit as reward. In long trades, the risk-to-reward ratio shows how much potential profit is available for each unit of risk.
The same logic applies to short trades, depending on the direction of price movement. This indicator performs consistently in both bullish and bearish market conditions and can be applied across different asset classes for evaluating trade quality.
Its primary role is to support rational decision-making prior to trade execution and control risk structure, rather than generate independent signals. Full customization of lines, colors, thickness, display location, and font size allows the trader to tailor the indicator’s appearance to their analytical style.
Overall, the Risk Reward Indicator is a practical tool for numerical and visual evaluation of risk-to-reward, shifting the trader’s focus from subjective judgment to structure- and data-driven assessment.
Conclusion
Optimizing the risk-to-reward ratio using lower timeframes involves a precise identification of liquidity zones and filtering low-risk entry points near Order Blocks (OBs) and Fair Value Gaps (FVGs).
This technique allows traders to reduce the stop-loss distance while maintaining the same take-profit target as defined in higher timeframes. Consequently, it enhances the risk-to-reward ratio while also increasing the probability of early stop-loss activations.


