


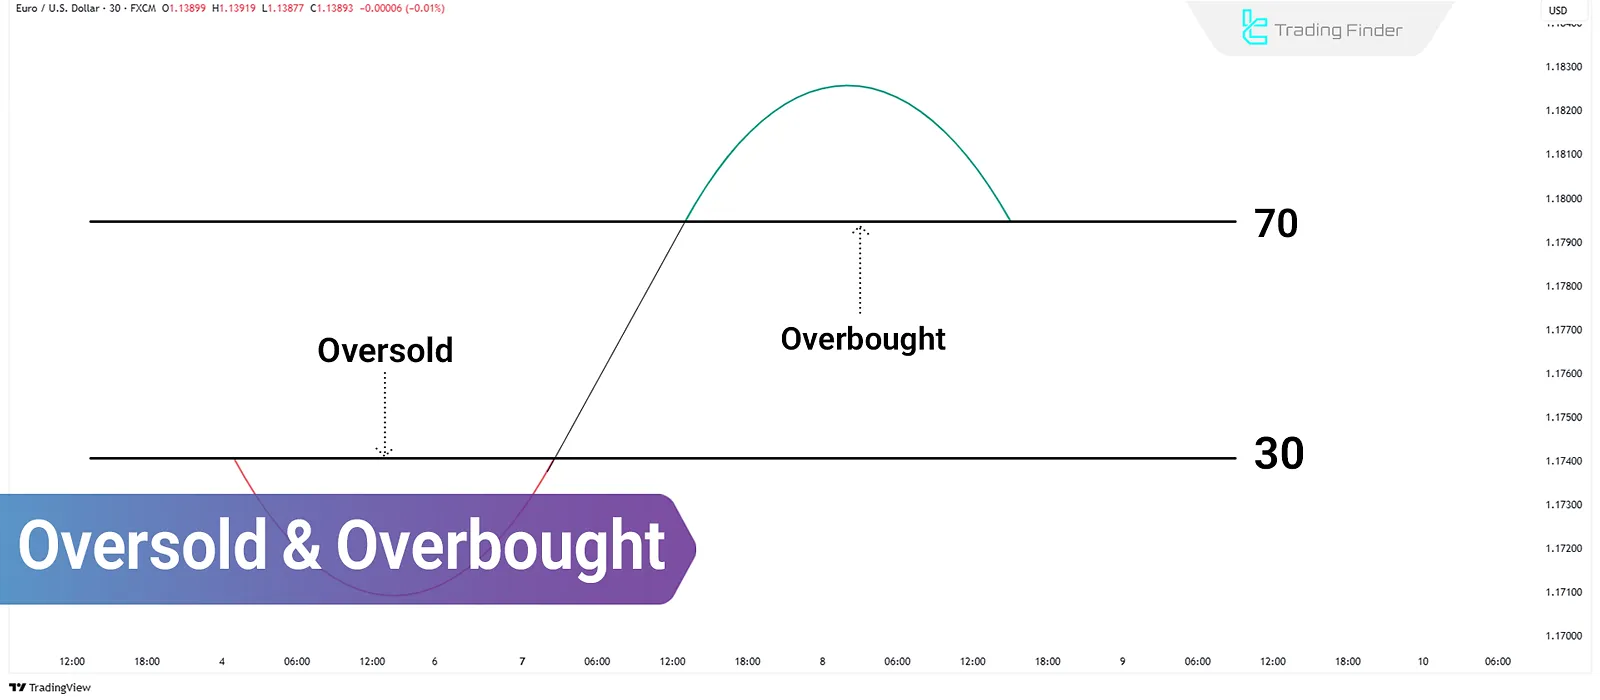
Overbought and oversold conditions occur when the price of an asset deviates significantly from its equilibrium or historical average.
This situation is often the result of temporary market emotion and can signal a potential correction or trend reversal.
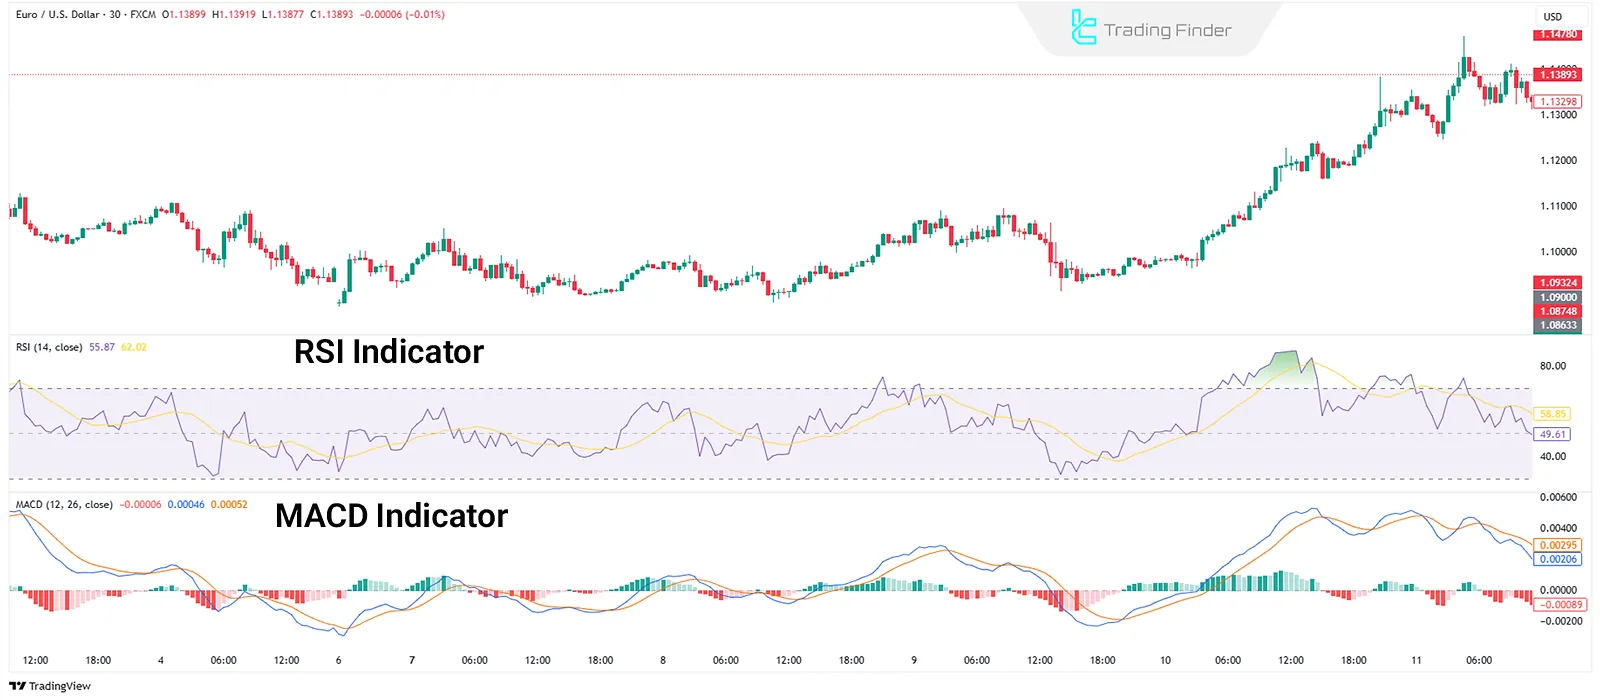
Tools like RSI, Stochastic, and MACD help identify these zones, but interpreting them correctly requires a solid understanding of market structure and technical Analysis.
What Are Overbought and Oversold Conditions?
Overbought conditions occur when an asset’s price has risen continuously over a long period and reaches a level that many traders and analysts consider excessively high.
This may indicate the end of a bullish trend or the beginning of a price correction. Conversely, oversold refers to a condition where the price has dropped significantly and is seen as undervalued.
This often suggests weakness in the downtrend and the potential for a bullish reversal.
Why Overbought/Oversold Matters?
Markets are not always in equilibrium. Factors such as short-term trader sentiment, breaking news, central bank policies, and market psychology can push prices away from their real value.
Key reasons why identifying overbought/oversold conditions is important for traders:
- Avoid entering trades where sharp reversals or corrections are likely;
- Help estimate when a correction or trend reversal may begin;
- Better understand market sentiment and avoid emotional trading.
Tools for Identifying Overbought and Oversold Zones
Various technical analysis tools have been developed to detect these conditions. The most widely used include:
Relative Strength Index (RSI)
The RSI is one of the most popular indicators for identifying overbought and oversold zones. Typically, readings above 70 signal overbought and below 30 signal oversold conditions.
Stochastic Oscillator
The Stochastic indicator compares prices relative to recent ranges. Levels above 80 indicate overbought, while below 20 suggests oversold.
Useful links for accessing the Stochastic indicator:
- Stochastic Oscillator for MetaTrader 4
- Stochastic Oscillator for MetaTrader 5
- Stochastic Oscillator for TradingView
Bollinger Bands
When the price moves outside the upper or lower Bollinger Bands for an extended period, it signals excessive buying or selling pressure.
Useful links for Bollinger Bands:
- Bollinger Indicator Bands for MetaTrader 4
- Bollinger Indicator Bands for MetaTrader 5
- Bollinger Indicator Bands for TradingView
MACD and Divergences
A divergence between price and the MACD indicator line can be a warning signal of trend exhaustion and a possible reversal from overbought/oversold conditions.
Correction vs. Reversal in Overbought/Oversold Conditions
An overbought or oversold signal does not guarantee a trend reversal. Sometimes, a trend is so strong that the price continues moving in the same direction despite hitting extreme levels.
In such cases, only temporary corrections occur instead of full reversals.
To increase reliability, combine these signals with confirmations like:
- Divergences
- Candlestick patterns
- Static or dynamic support and resistance
- Volume analysis
Trading Using Overbought and Oversold Conditions
Two approaches for trading overbought and oversold conditions are counter-trend trading and trend continuation after correction:
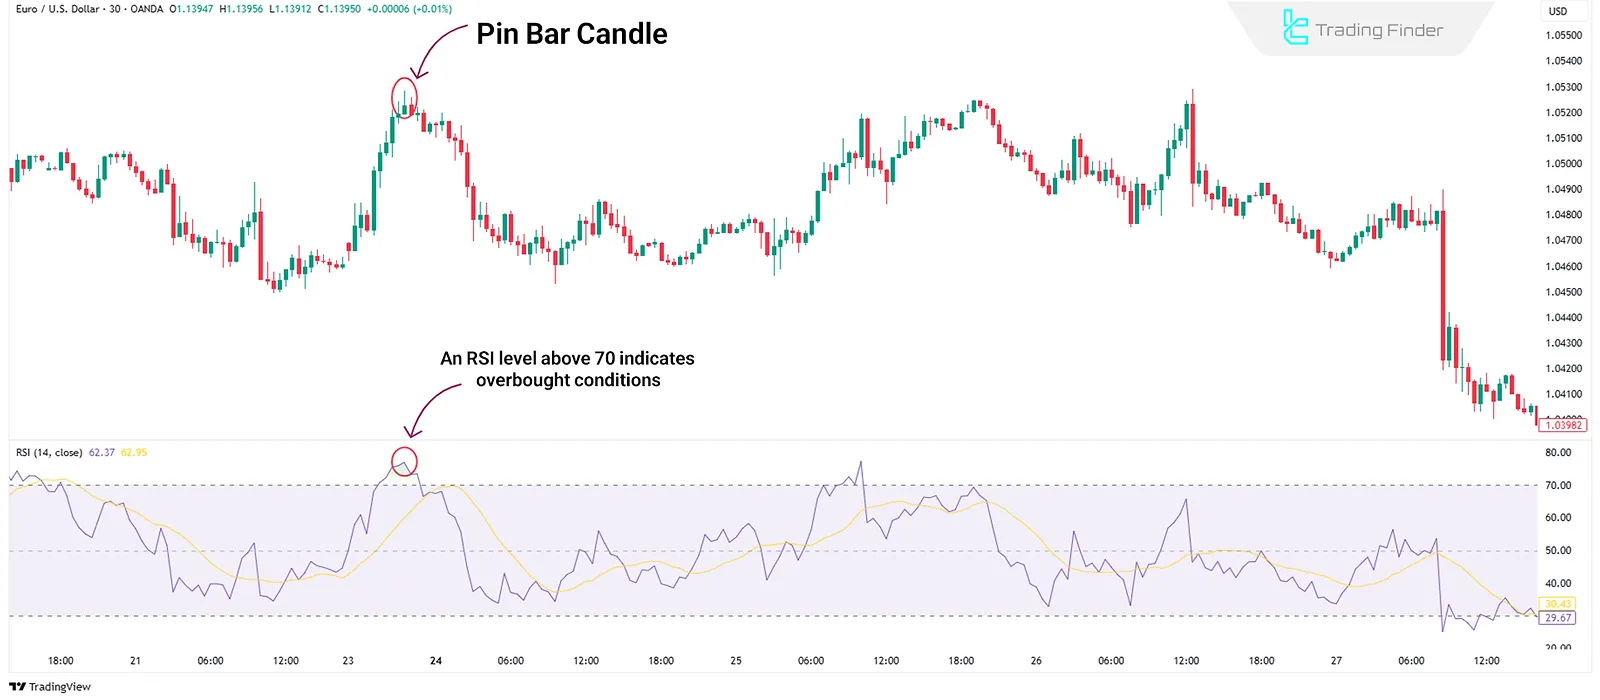
Counter-Trend Trading in Overbought/Oversold Zones
In the 30-minute chart of EUR/USD, a bearish pin bar appears near a resistance zone.
This candlestick, with a long upper wick and small body, reflects strong selling pressure.
At the same time, RSI crosses above 70, indicating overbought. This combination suggests a potential downward reversal.
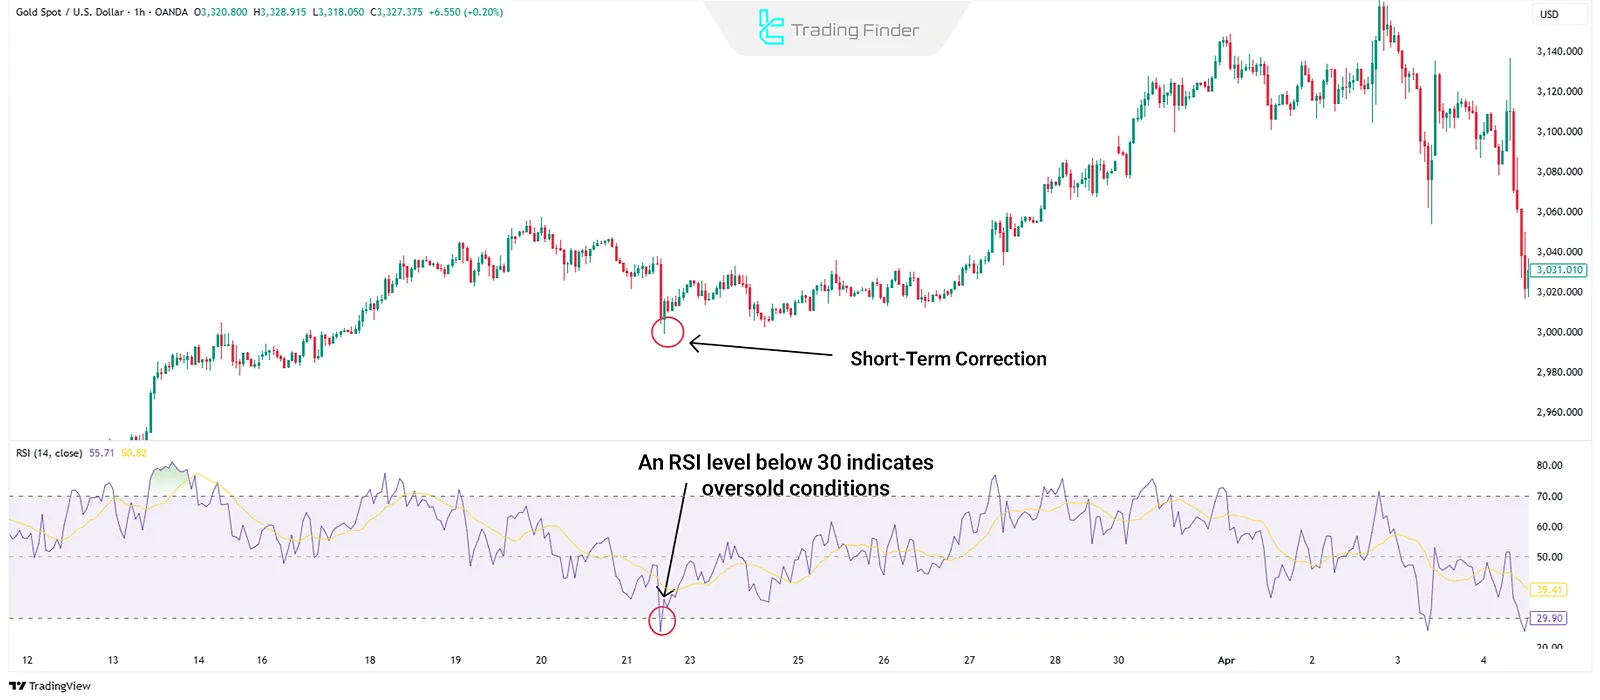
Trend Continuation After Correction from Overbought/Oversold
In the 1-hour chart of XAU/USD (Gold), the RSI drops below 30, indicating oversold.
This is interpreted as a short-term correction within a broader uptrend.
Shortly after, the price resumes upward momentum, signaling the end of the correction phase and the continuation of the bullish trend.
Conclusion
Overbought and oversold conditions reflect a price deviation from an asset's fair value, signaling potential areas where corrections or trend reversals may occur.
While technical indicators like RSI, Stochastic, Bollinger Bands, and MACD each utilize different methodologies to detect such extremes, using them in isolation is often insufficient.
To apply these tools effectively, traders should incorporate them into a broader analytical framework that includes market structure analysis, technical confirmations—such as divergences, candlestick patterns, and key support/resistance levels—and a disciplined approach to risk management.


