


In technical analysis and price charts, the Previous Monthly High and Low (PMH & PML) represent the highest and lowest traded prices over the past month.
The Previous Monthly High (PMH) and Previous Monthly Low (PML) are essential data points for market analysts as they indicate price fluctuations over a monthly timeframe. The levels derived from them play a significant role in market trends.
What are the previous Months' high and low?
Each of these concepts has its own significance, which is detailed below, along with an illustrative example. These levels, in practice, represent a range in which a significant portion of market participants’ decisions have been formed, and within which the footprint of monthly liquidity can be observed.
In this context, the concept behind pmh trading meaning and pml trading meaning becomes practically visible within the same price framework.
Analyzing price behavior in the vicinity of these zones enables the trader to distinguish corrective movements from structural changes in the market.
Previous Monthly High (PMH)
This value represents the highest price that an asset (such as stocks, cryptocurrencies, commodities, etc.) has reached during a full trading month.
On a candlestick chart, the highest shadow (wick) of the highest candlestick in the past month indicates this level.
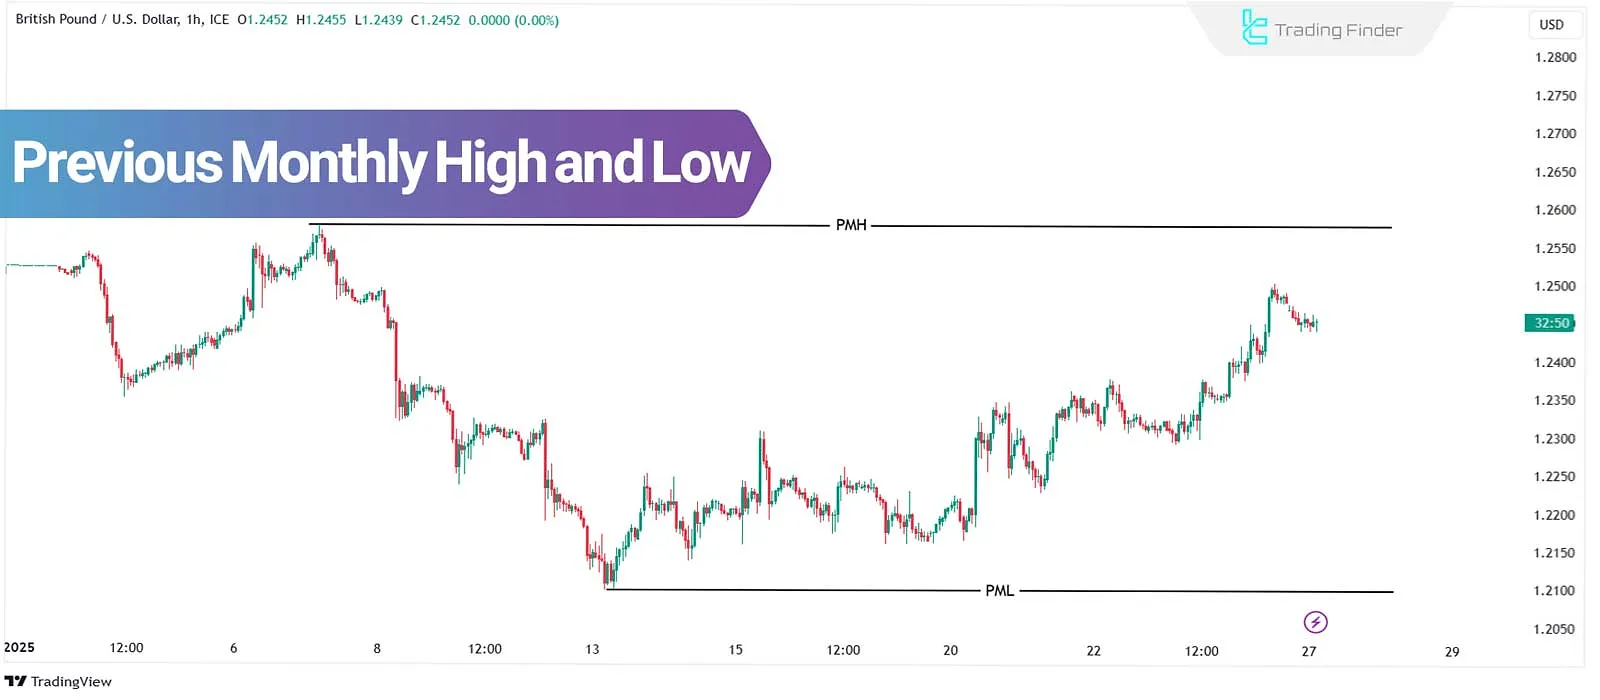
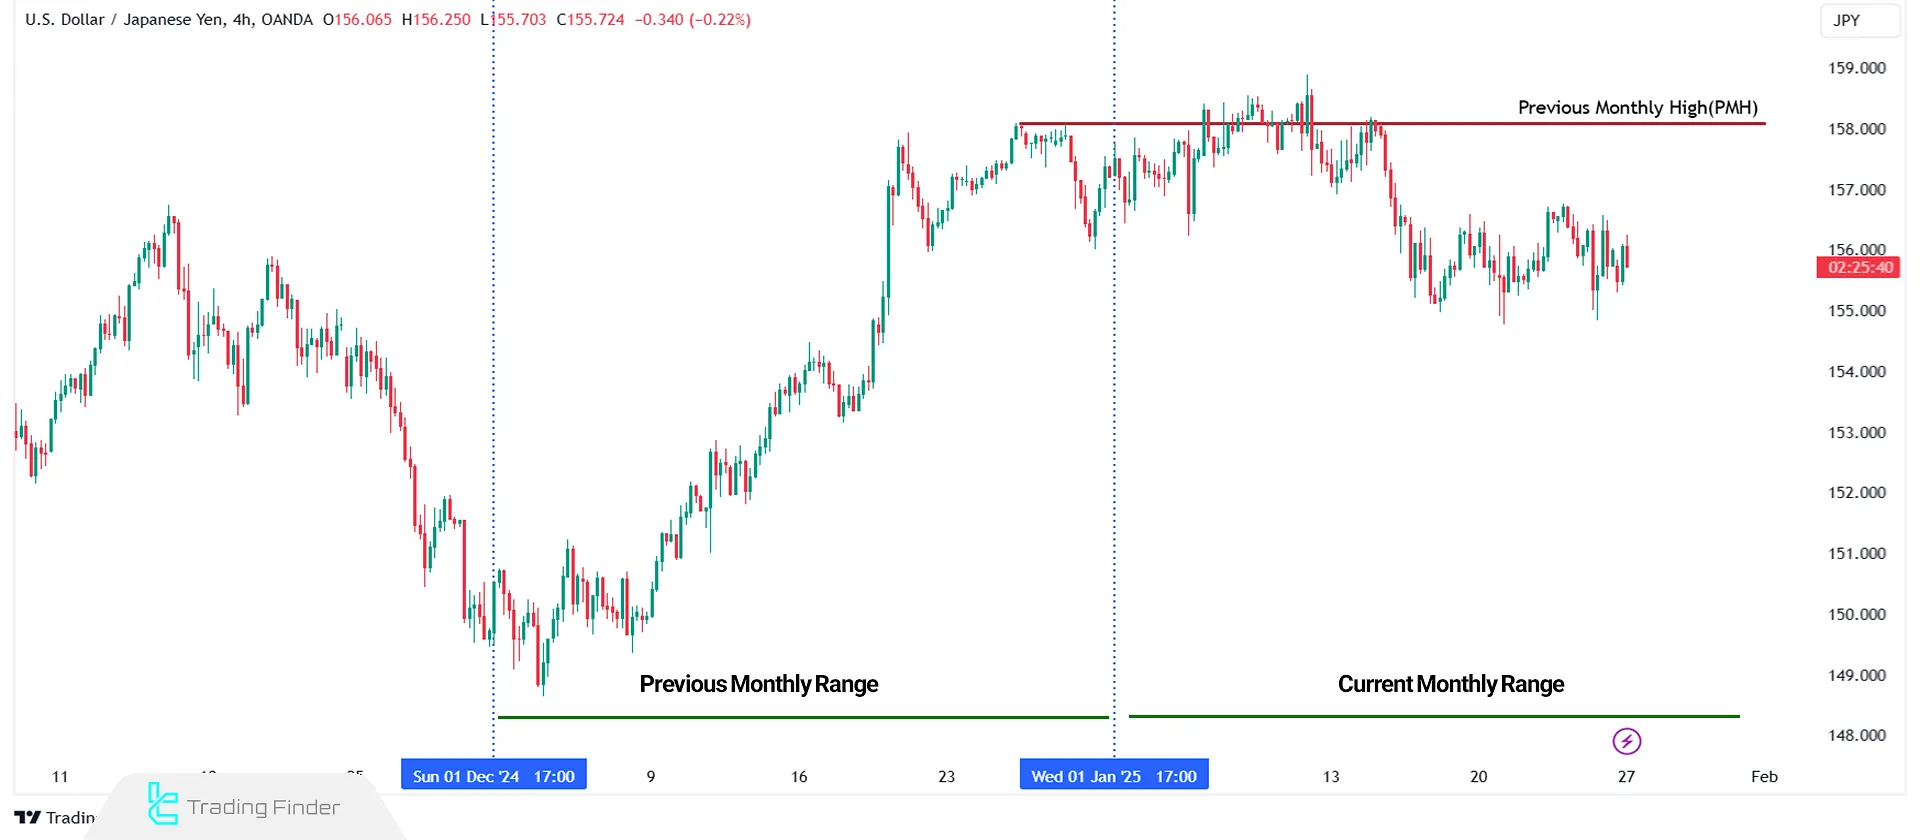
Visual Example of PMH
In this chart, the Previous Monthly High is identified as a price reference level on the monthly timeframe, a concept commonly discussed under pmh trading and pmh in trading.
As price enters the current month, the market approaches this level several times but fails to achieve a sustained breakout above it, while the opposing structure is typically evaluated in pml trading on the lower boundary of the same monthly range.
This behavior indicates that PMH can function as a sensitive zone within market structure; a zone where selling pressure increases and the market’s willingness to continue its upward movement is tested.
Price reaction around this level provides important information about trend strength, liquidity conditions, and the behavior of market participants, without necessarily leading to a definitive breakout or reversal.
Previous Monthly Low (PML)
This value indicates the lowest price that an asset has reached during a full trading month. On a candlestick chart, the lowest shadow (wick) of the lowest candlestick in the past month represents this level.
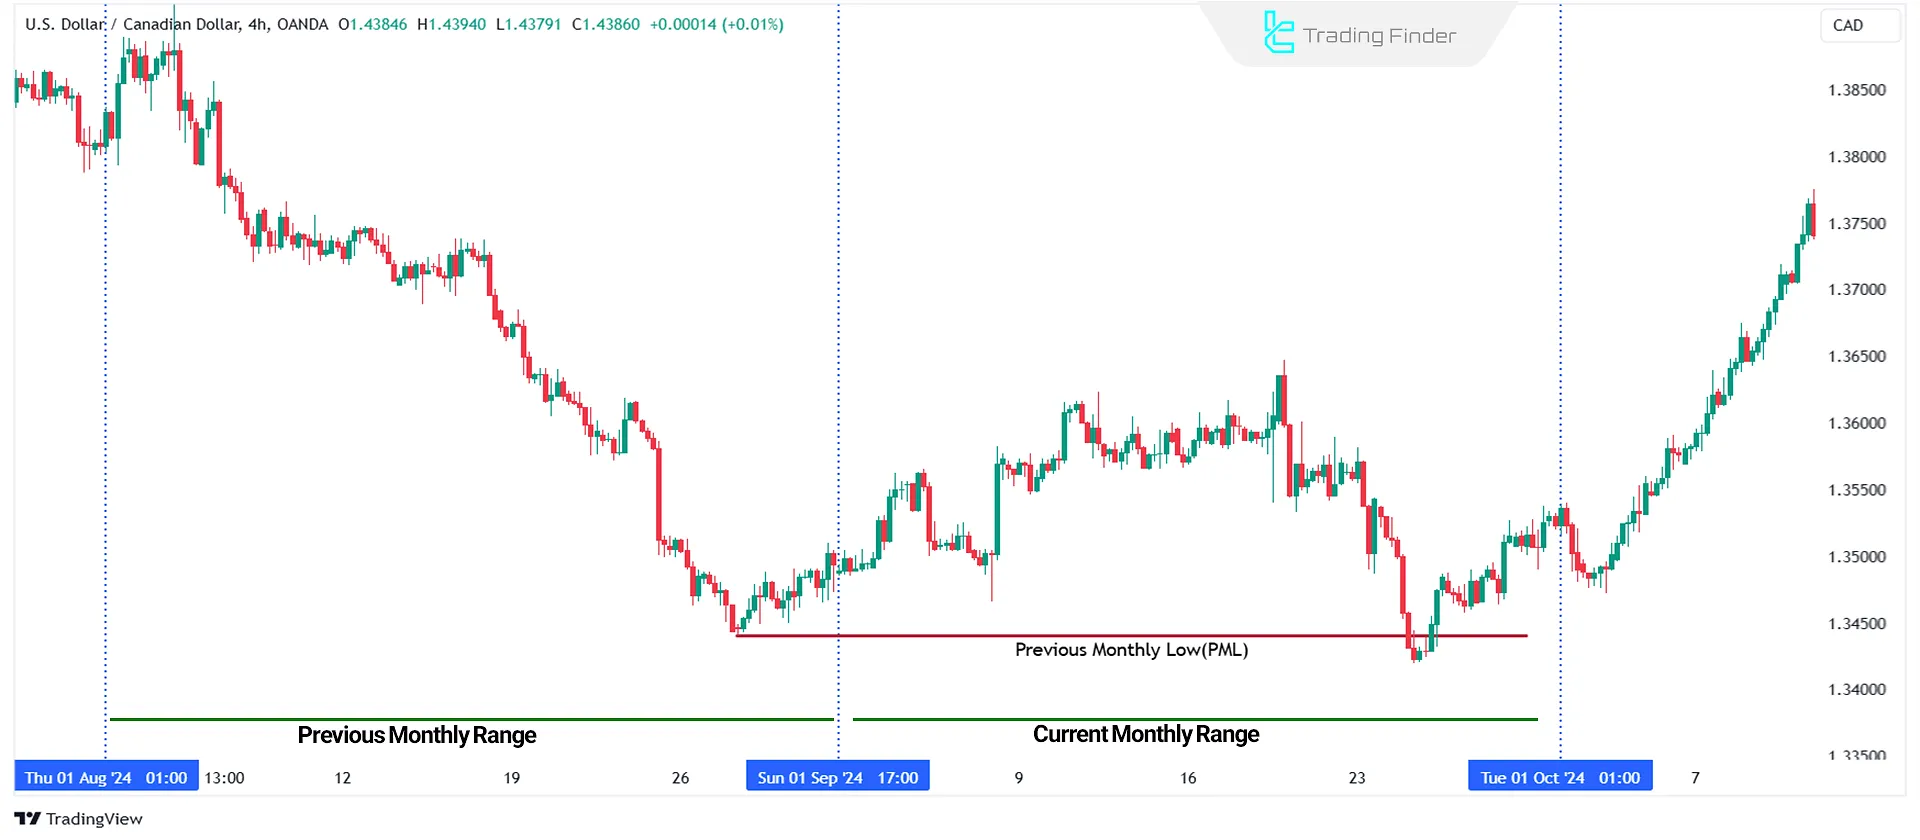
Visual Example of PML
In this chart, the Previous Monthly Low is identified as a monthly price reference level, a concept frequently examined through pml in trading and visualized clearly on a pml chart.
As price enters the current month’s range, the market reacts to this level, and after touching the PML, selling pressure comes to a halt, often forming a structure similar to a higher low in trading within the broader context of price behavior.
This behavior indicates that the previous month’s low can function as a sensitive zone within market structure; a zone where temporary changes in price behavior occur and where the strength of buyers and sellers is reassessed.
Price reaction within this area, without the need for a definitive breakout or an immediate reversal, provides important information about market bias and liquidity conditions.
Relationship Between PMH and PML with Internal and External Liquidity
In liquidity analysis, PMH and PML are usually considered as external liquidity levels, and within the broader context of high and low in trading they are treated as higher-timeframe reference points that frame directional bias.
These zones are the areas where stop-loss orders of traders positioned against the direction of price movement tend to accumulate, a dynamic often associated with the logic behind the pml abbreviation in institutional market structure.
In many scenarios, price first collects internal liquidity and then moves toward PMH or PML, a behavior that aligns with the concept of previous session high and low when analyzing how price transitions between internal and external liquidity pools.
Understanding this relationship provides a more precise reading of market behavior within the ICT framework. In the article on ICT liquidity concepts on the TradingView website, these two concepts are examined.
What Is the Difference Between PMH and PML and the Current Month High and Low?
The highest and lowest prices of the previous month are fundamentally different from the high and low of the current month and should not be used interchangeably.
PMH and PML refer to confirmed data from a full completed trading month, whereas the high and low of the current month continuously change until the month ends.
Comparison Table of PMH and PML vs Current Month High and Low:
Comparison Criteria | Highest and Lowest Price of the Previous Month (PMH and PML) | Current Month High and Low |
Time Range | One full completed trading month | Month currently forming |
Level Status | Fixed and final | Variable until month end |
Reliability in Analysis | High due to complete data | Limited to current market conditions |
Primary Application | Market structure and liquidity analysis | Monitoring volatility and short-term behavior |
Price Reactions | Often accompanied by repeatable behaviors | May experience sudden changes |
Role in ICT and Smart Money | Liquidity level and decision reference | Temporary and non-final level |
Why Are the Previous Month’s Highs and Lows Important?
The highest and lowest points of the monthly candlestick have multiple applications in trading strategies like ICT style:
- Identifying Price Volatility: The gap between PMH and PML reflects the price fluctuation range over the month;
- Support and Resistance: The previous month’s low may act as a support level, while the previous month’s high could serve as a resistance level;
- Liquidity Zones: In ICT Style and Smart Money strategies, these points are considered Liquidity in Forex, highlighting areas where stop-loss orders tend to cluster;
- Market Behavior Analysis: These levels help traders understand price behavior throughout the month and year;
- Trend Identification: A gradual increase in PMH and PML indicates an uptrend, whereas a decline suggests a downtrend.
This trend behavior can determine seasonal or yearly price direction in higher timeframes.
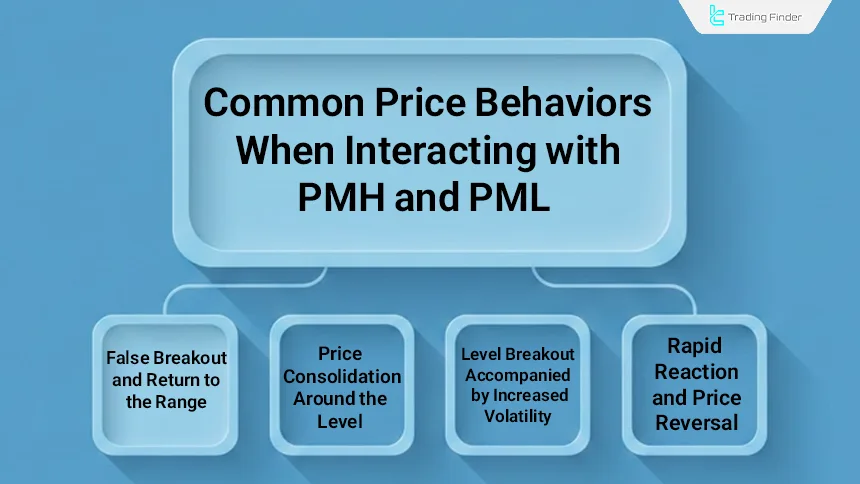
Common Price Behaviors When Interacting with PMH and PML
When price approaches the highest or lowest level of the previous month, which are core references within trading highs and lows analysis, several recurring behaviors are typically observed in the market.
These include rapid reaction and reversal, breakout accompanied by increased volatility, or price consolidation around the level.
Typical price fluctuations when interacting with PMH and PML zones:
- Rapid reaction and price reversal: After the initial contact with PMH or PML, price reacts sharply and returns to the previous range without fully breaking the level;
- Level breakout with increased volatility: A break above PMH or below PML is usually accompanied by expanded candle ranges and sharp volatility, indicating the activation of accumulated liquidity in that zone;
- Price consolidation around the level: Price oscillates near PMH or PML for a period, and the market enters a decision phase without a clear short-term directional bias;
- False breakout and return to the range: In some cases, price temporarily breaks the level but quickly returns inside the previous month’s range, signaling liquidity absorption.
Determining PMH and PML Based on Candle Wick or Body
In most technical analyses, the highest and lowest prices of the previous month are determined based on the candle wick of the monthly candle, not its body. This is because the wick records the maximum and minimum prices traded in the market, rather than closing prices.
However, in some advanced analytical approaches, the candle body may also be considered as a secondary reference, especially when the wicks are abnormal or driven by short-term volatility. The choice between wick and body should be made according to the overall market structure.
Common Mistakes in Using PMH and PML
Incorrect interpretation of PMH and PML can lead to faulty analysis.
Using these levels without considering market structure, or relying on them without confirmation from lower timeframes, are common errors, even among traders applying the pdh and pdl strategy for intraday liquidity mapping.
Typical mistakes in using PMH and PML:
- Using PMH and PML without evaluating market structure: Treating these levels in isolation and ignoring the overall trend and structure leads to misinterpretation of price behavior;
- Assuming guaranteed price reaction at these levels: Expecting certain reversal or breakout at PMH or PML without considering liquidity conditions is a common analytical error;
- Ignoring lower timeframes: Relying on PMH and PML without confirmation from lower timeframes reduces analytical accuracy and decision quality;
- Overlooking market volatility conditions: Applying PMH and PML identically in low-volatility and high-volatility markets can result in misleading conclusions;
- Misinterpreting breakouts: Failing to distinguish between genuine breakouts and false breakouts around PMH and PML is one of the main reasons for unsuccessful entries.
On the PBInvesting YouTube channel, a trading strategy using PML and PMH concepts is presented in video format:
Differences in PMH and PML Behavior Across Markets
The behavior of the previous month’s highest and lowest prices is not the same across different markets. In the Forex market, these levels often function as liquidity reaction points, while in the cryptocurrency market they may be accompanied by highly volatile breakouts.
Table of Differences in PMH and PML Behavior in Financial Markets:
Financial Market | Type of Price Reaction to PMH and PML | Dominant Price Behavior | Role of Liquidity |
Forex | Clear and frequent technical reactions | Relatively predictable behavior near levels | Very strong as liquidity reaction zones |
Cryptocurrencies | Fast breakouts and sharp volatility | Aggressive and sometimes non-classical movements | Unstable liquidity with emotional market behavior |
Stocks | Slow and structured reactions | Gradual movement formation with volume confirmation | Deep and organized liquidity |
Indices | Gradual reactions aligned with macro trend | Movements driven by macro conditions and market flow | Liquidity based on institutional capital flow |
Combining PMH and PML with Lower Timeframes
PMH and PML zones typically function as decision areas on lower timeframes. Analysts combine these levels with market structure on lower timeframes to identify more precise entry and exit points.
This approach transforms monthly levels from purely analytical references into practical operational tools.
Role of PMH and PML in Monthly Market Structure
On long-term timeframes, PMH and PML are considered core components of monthly market structure. Price holding above the previous month’s PMH may signal bullish structure expansion, while a break of PML is often associated with a market phase shift.
These levels help the analyst distinguish corrective moves from trend changes and assess the dominant market direction on higher time horizons.
Market Structure Indicator
The Market Structure Indicator (BOS-CHOCH) is an advanced analytical tool within the ICT and Smart Money framework that focuses on structural price behavior, enabling identification of Change Of Character and Break Of Structure. This indicator is designed to reveal key market transitions at both major and minor levels.
By analyzing the sequence of price movements, BOS-CHOCH identifies points where the dominant market direction shifts or the previous structure is decisively invalidated.
This approach allows traders to detect important market changes in a timely manner and base their analysis on true price structure rather than short-term fluctuations.
In bullish scenarios, the indicator first highlights the weakening of the bearish trend and the formation of a Change of Character, then confirms the continuation of the bullish move by registering a Break of Structure.
A return of price to key zones such as Order Blocks after this transition can signal sustained buyer strength. In bearish scenarios, the shift from bullish to bearish conditions is identified through CHOCH, with BOS acting as confirmation of the bearish movement.
This tool is designed for multi-timeframe analysis and is applicable across various trading styles including intraday trading, day trading, and scalping. It is also usable in different markets such as Forex, stocks, and indices, which enhances its flexibility.
Within the settings section, users can control the range of price data under evaluation and select the market structure calculation method based on either zigzag or candle patterns. This functionality allows analysts to align the indicator with different market conditions and their analytical preferences.
Overall, the BOS-CHOCH indicator is considered a specialized tool for deeper understanding of market structure, identifying trend transition points, and evaluating liquidity behavior. It serves as a practical and reliable reference for traders who adopt a structural and analytical approach within the ICT and Smart Money framework.
Conclusion
The Previous Monthly High (PMH) and Previous Monthly Low (PML) are the highest and lowest prices a market reaches over a full month. These levels may be formed based on either candlestick wicks or bodies and often act as support and resistance zones. These zones, due to the registration of frequent price reactions, are considered decision-making references on higher timeframes within many analytical structures.
Evaluating the position of these levels relative to the dominant market trend allows the analyst to assess the strength or weakness of the price movement structure with greater precision. Moreover, the confluence of these levels with liquidity zones and lower-timeframe price structures increases their analytical validity in trading scenarios.


