


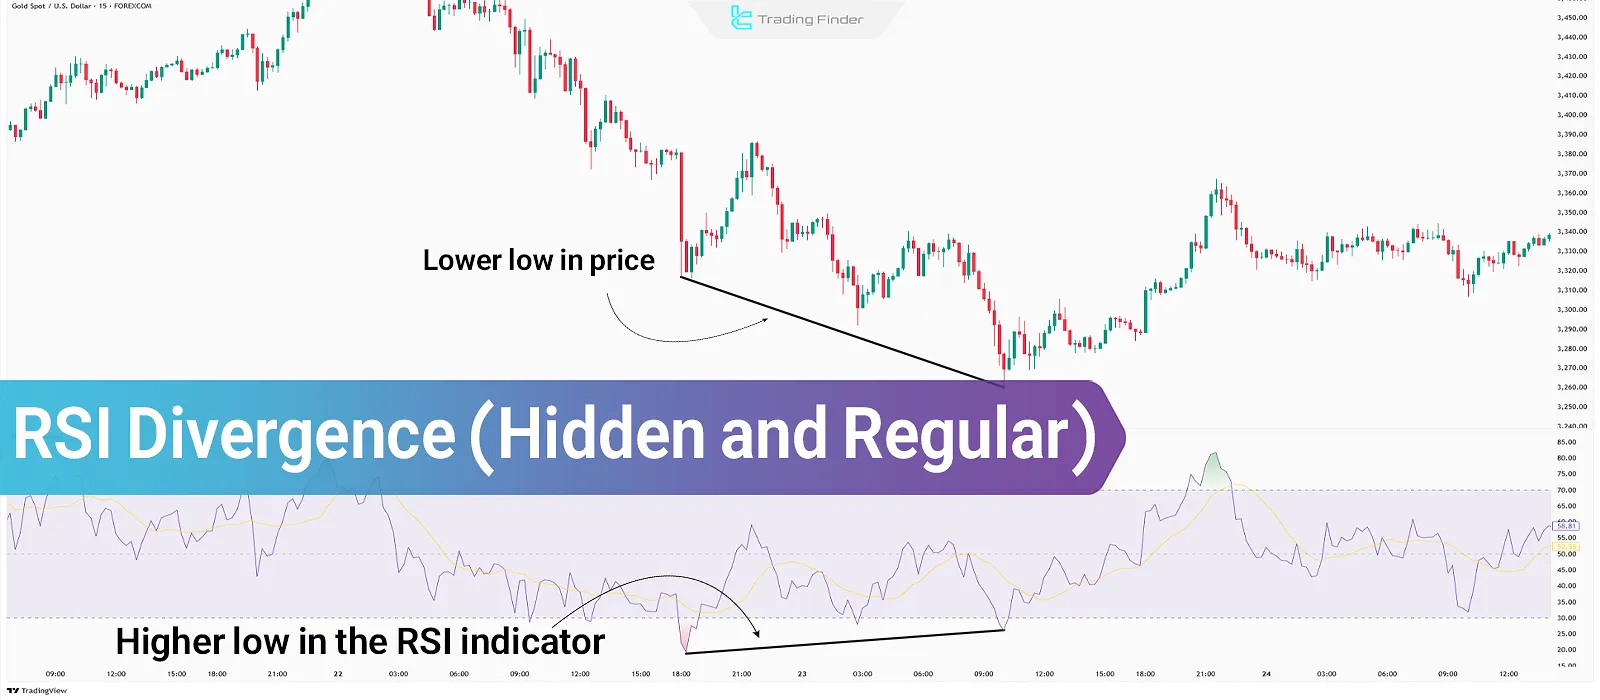
RSI Divergence is a tool for identifying potential price reversal points in the market. Detecting RSI Divergence is one of the most important technical analysis skills, as this tool identifies hidden weaknesses or strengths in a trend by analyzing the discrepancy between price movement and the Relative Strength Index (RSI).
When the RSI aligns with the price chart and no signs of divergence are observed, convergence occurs, indicating strong momentum and continuation of the price trend.
What is RSI Divergence?
RSI Divergence refers to a situation where price movement and the Relative Strength Index (RSI) are not in agreement. In other words, when the price makes new highs or lows, but the RSI fails to confirm this move, a divergence has occurred.
This typically signals weakness in the current trend and the potential for a reversal.
Note: The most valid divergences in the RSI indicator occur in overbought and oversold areas (above 70 and below 30).
RSI Divergence Types
The divergence of the Relative Strength Index indicator appears in two ways in technical analysis charts:
- Regular Divergence: Indicates trend weakness and signals a possible reversal;
- Hidden Divergence: Indicates the continuation of the current trend strength.
Regular Divergence
When, in a price movement trend, the price creates new highs and lows while the RSI forms opposite highs and lows, a Regular Divergence occurs, and a price reversal is likely.
For example, in an uptrend, if the price makes higher highs but the RSI shows lower highs, a bearish Regular Divergence is forming.
- Bullish Regular Divergence (Bullish RD): Lower price lows but higher RSI lows;
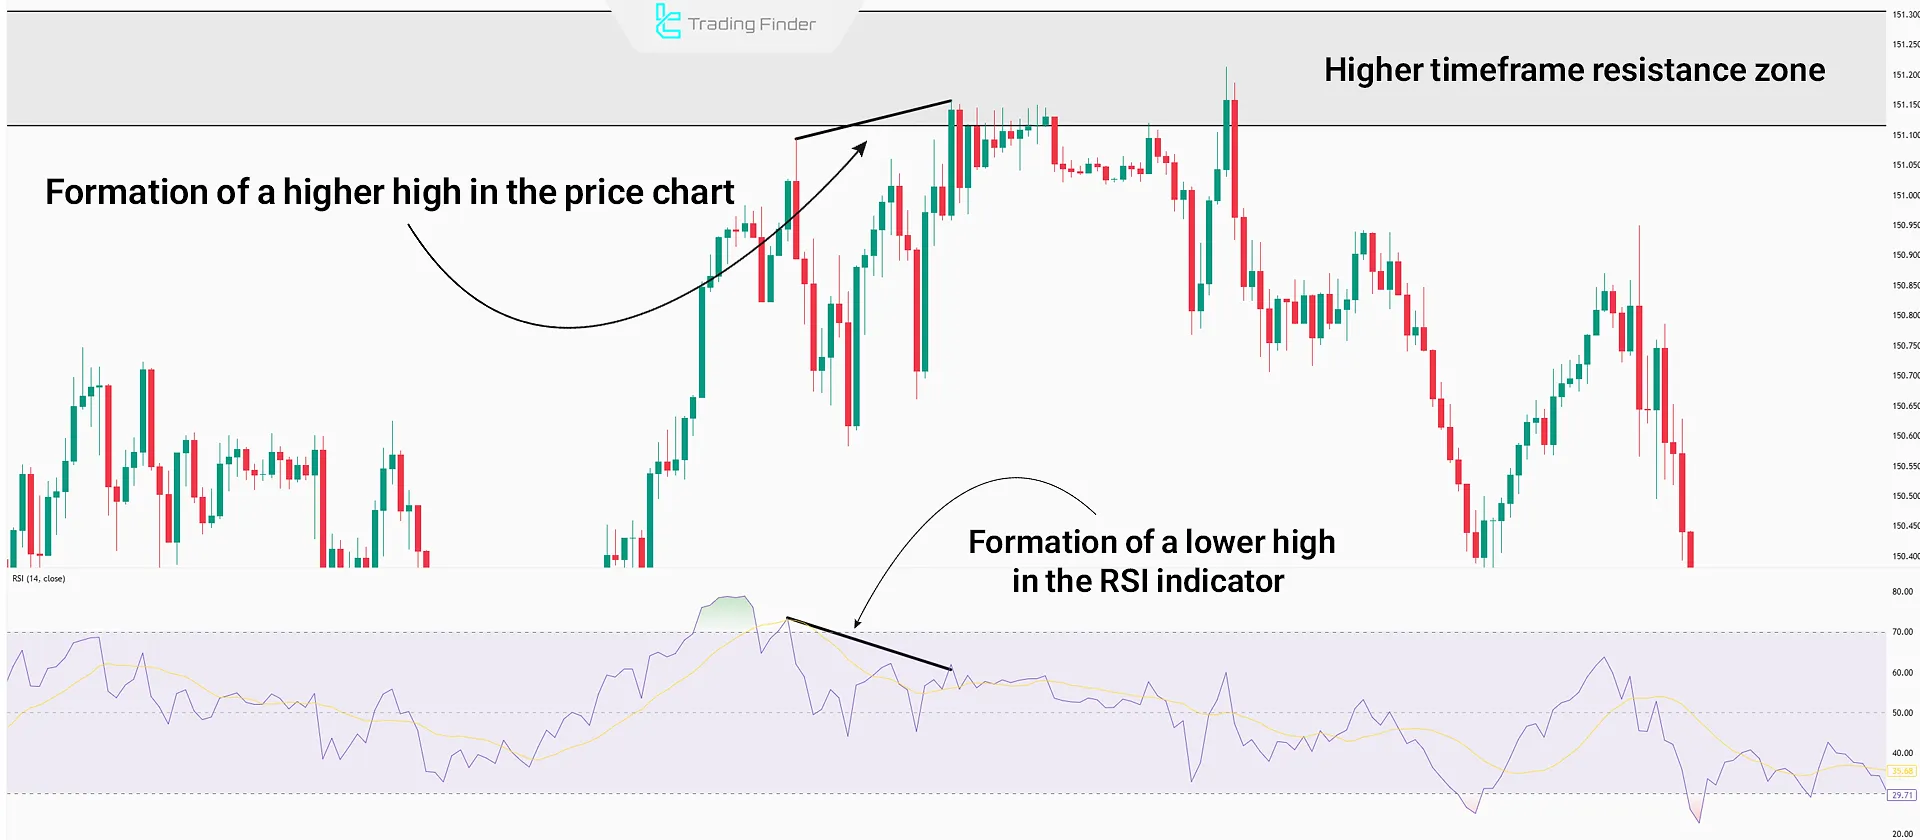
- Bearish Regular Divergence (Bearish RD): Higher price highs but lower RSI highs.
Hidden Divergence
In Hidden Divergence, the degree of price trend correction is compared with the correction level in the indicator, and if there is a mismatch, Hidden Divergence is identified.
For example, in an uptrend, if the price creates higher lows but the RSI shows lower lows, it signals the continuation of buyer strength. This type is usually used for trading in trending markets.
- Bullish Hidden Divergence (Bullish HD): In an uptrend, the price forms a higher low, but RSI forms a lower low;
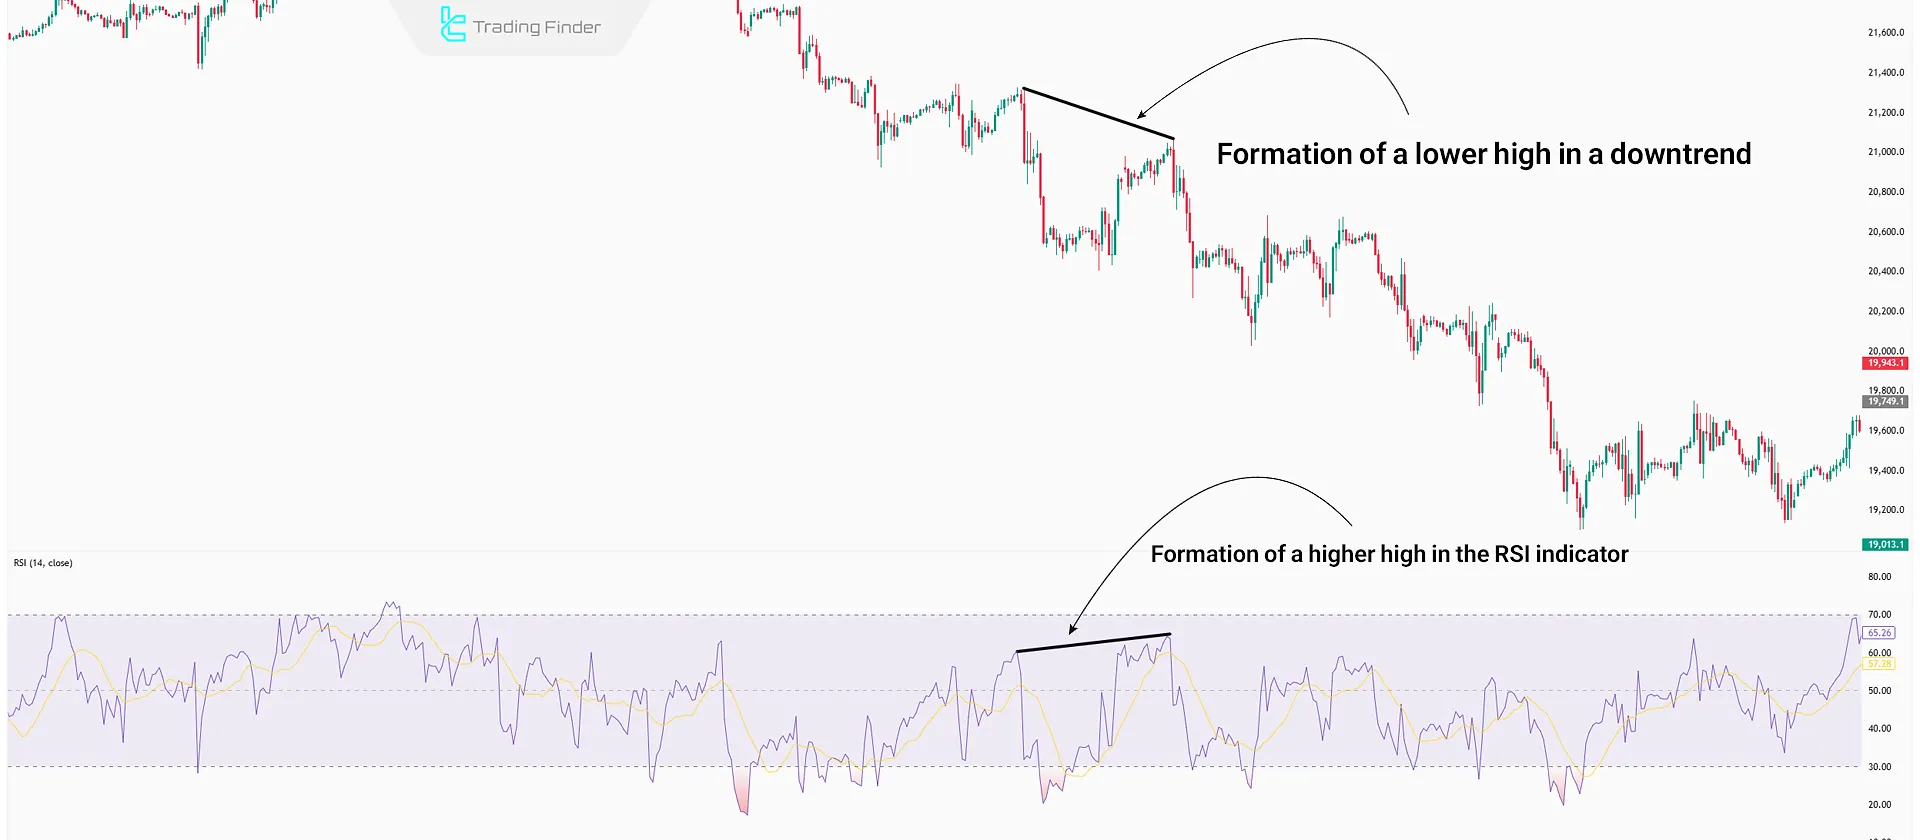
- Bearish Hidden Divergence (Bearish HD): In a downtrend, the price forms a lower high, but RSI forms a higher high.
Note: In this type of divergence, the RSI’s overall direction must match the price direction (both in the same general trend) before comparing highs and lows.
How to Identify RSI Divergence?
To identify RSI Divergence, you need to examine the behavior of both price and the RSI:
- Calculate RSI: First, apply the Relative Strength Index to your chart; the default setting is 14 periods;
- Compare highs and lows: Check whether the price movement and the RSI are in sync;
- Identify divergence: If the price forms a new high or low but the RSI fails to confirm, divergence has formed;
- Confirm with other tools: Use tools like support and resistance levels, trading volume, or candlestick patterns to confirm the divergence signal.
For easier RSI Divergence detection, you can use the TradingFinder RSI Divergence Indicator in MetaTrader:
- Free Download – RSI Divergence Indicator for MetaTrader 5
- Free Download – RSI Divergence Indicator for MetaTrader 4
Regular Divergence
Regular Divergence signals a price trend reversal. This type is identified by analyzing highs in an uptrend and lows in a downtrend.
Bullish Regular Divergence in RSI
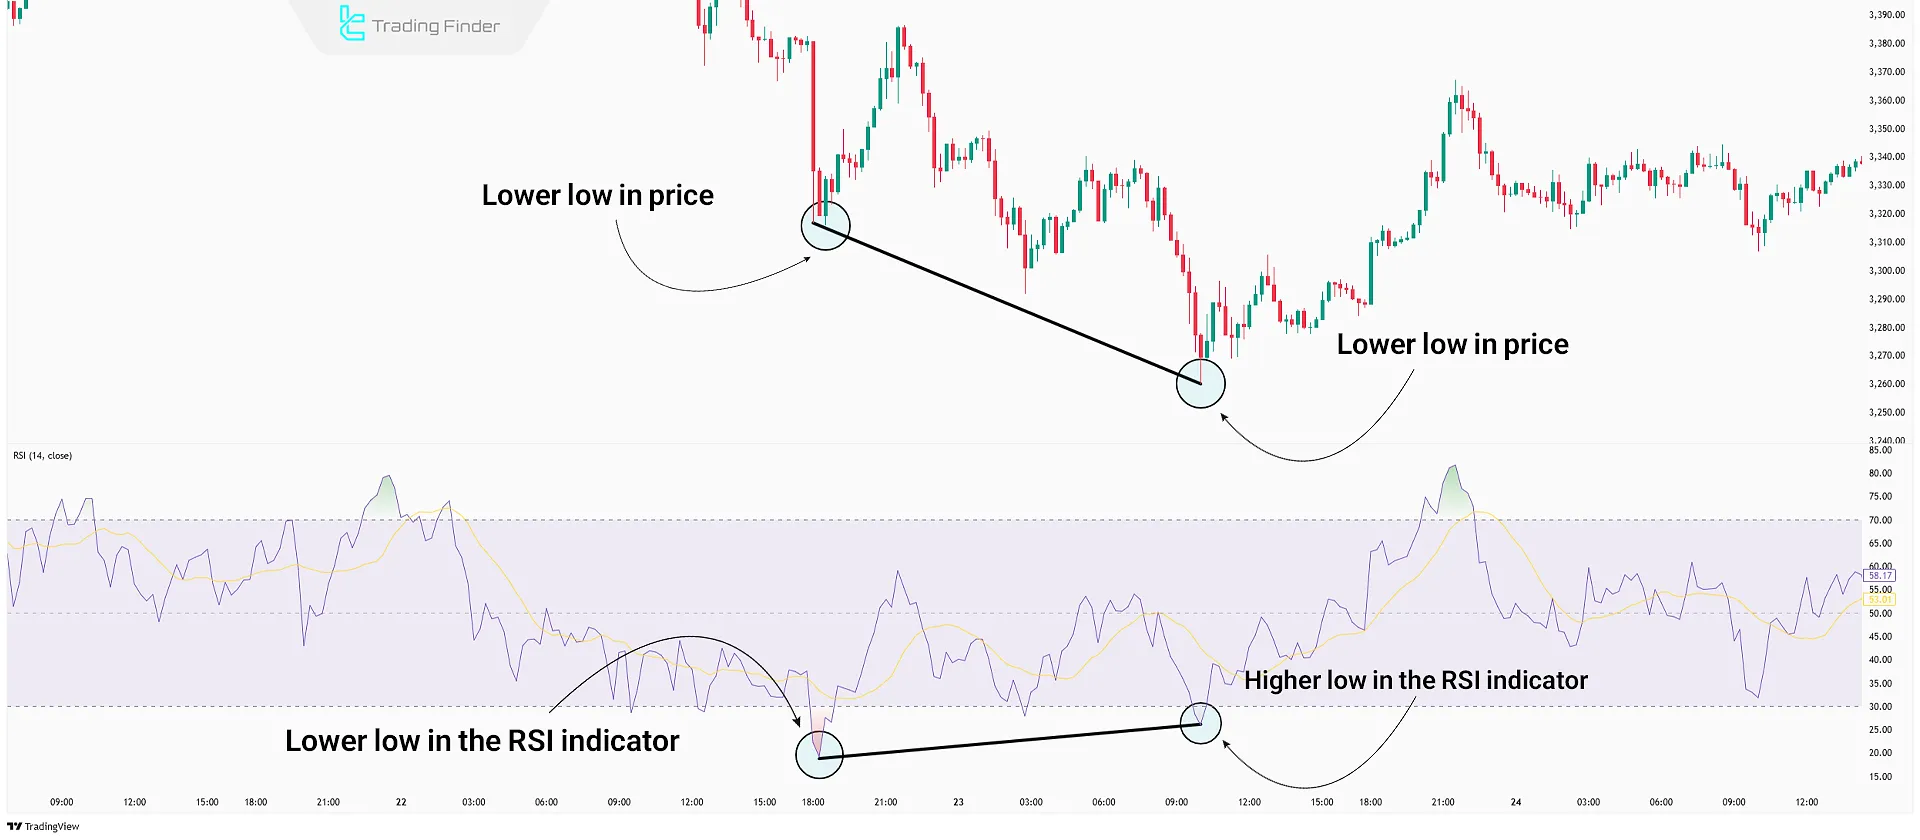
In a downtrend, a bullish divergence usually occurs when the price is making lower lows, but the RSI forms higher lows. This indicates weakening seller strength and the potential for an uptrend reversal or pause.
Example: If the price creates a new low but the RSI stays above its previous low, this is a bullish divergence. Traders often look for buy signals or exit short positions in such conditions.
Bearish Regular Divergence in RSI
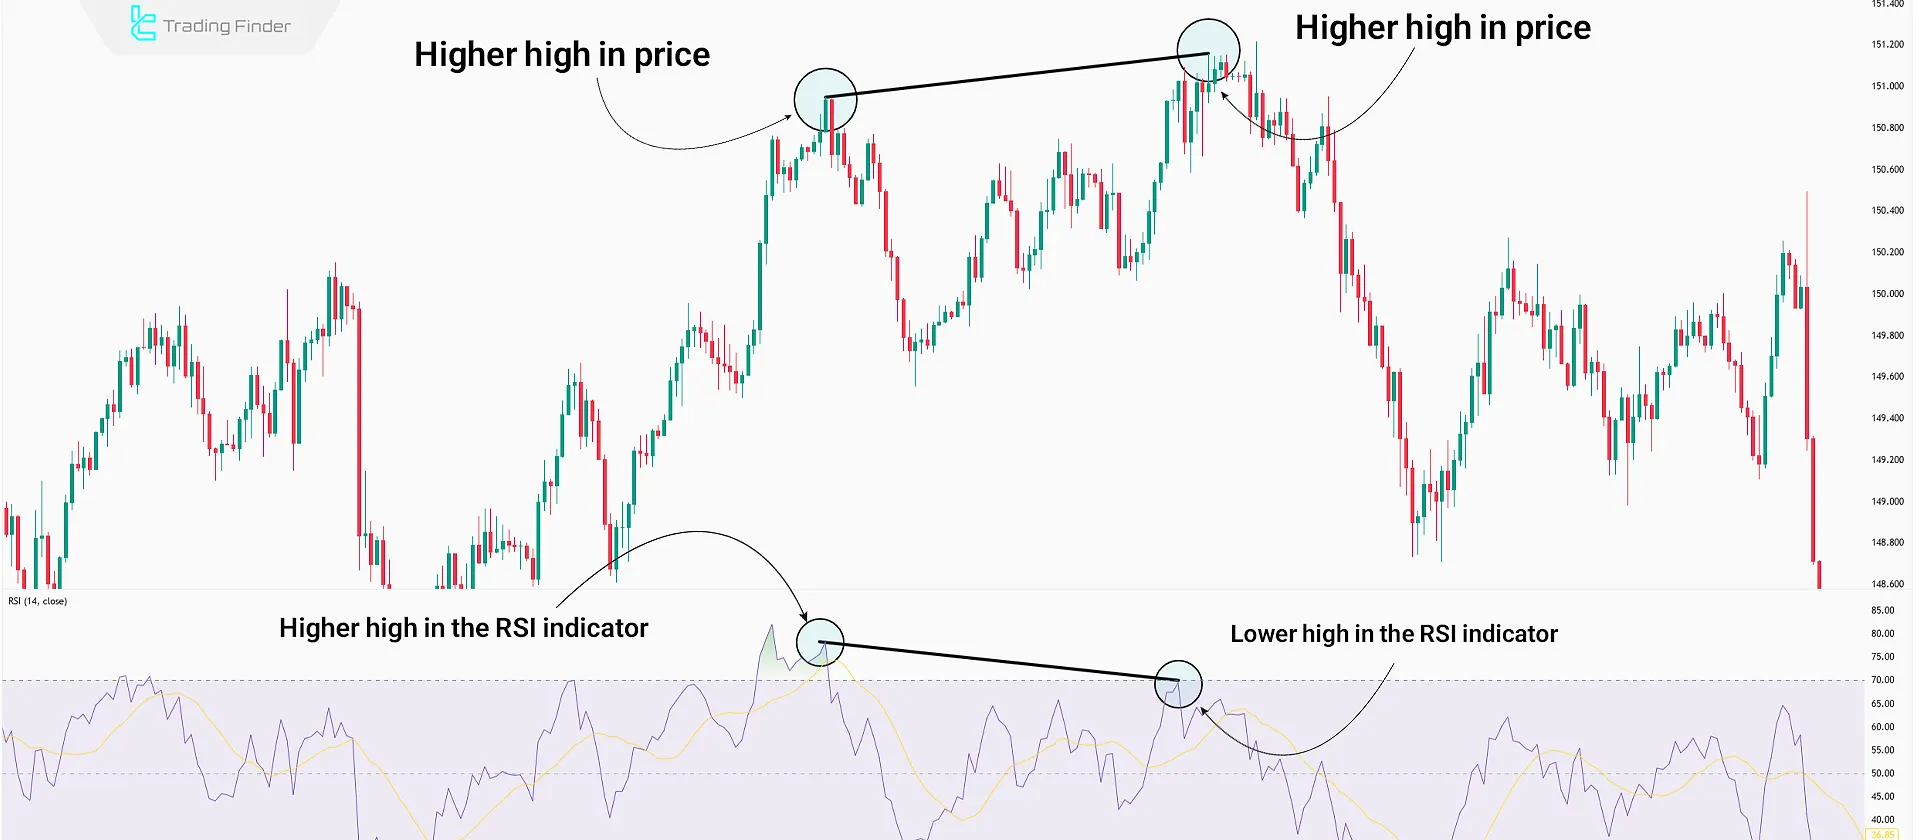
Bearish Regular Divergence typically occurs at the end of an uptrend. In a bullish market, when the price creates higher highs but the RSI forms lower highs, it indicates weakening buyer strength and a possible downward reversal.
Example: If the price creates a new high but RSI remains below its previous high, this is a bearish divergence.
Hidden Divergence
Hidden Divergence means both price and RSI move in the direction of the overall trend but form different peaks or troughs. This usually occurs during a temporary market correction, after which the main trend resumes.
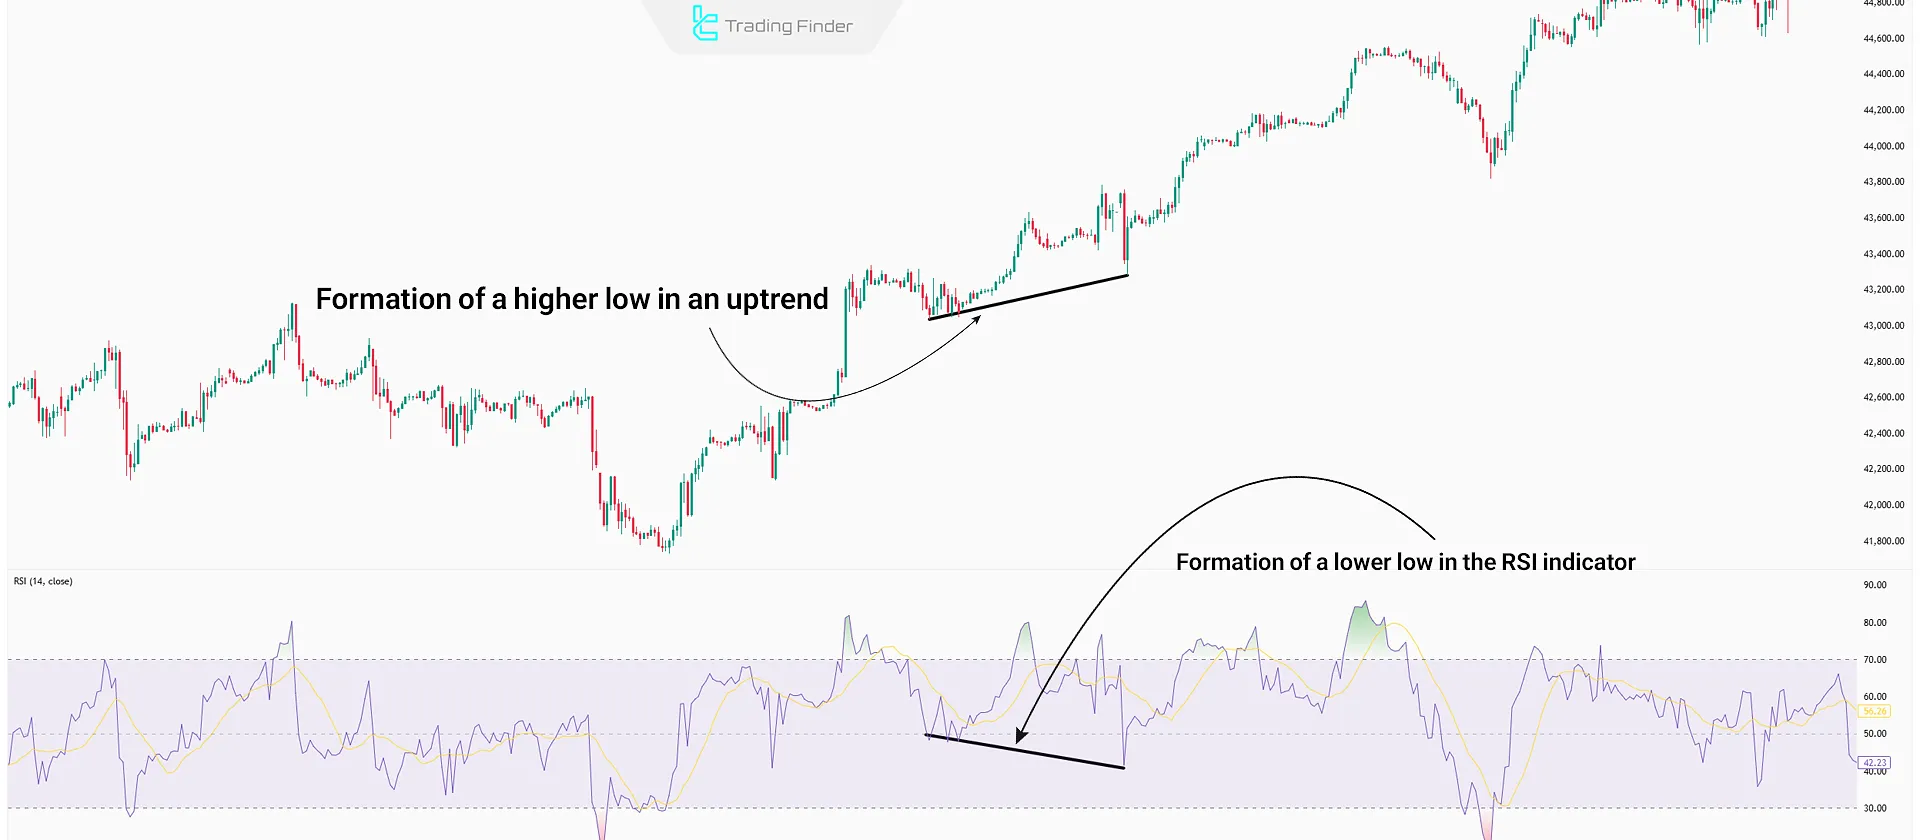
Hidden RSI Divergence in an Uptrend
In an uptrend, after making a higher high, the price experiences a corrective move, forming a price low. Hidden Divergence is identified by comparing this price low with the low in the RSI; if the RSI low is lower while the price low is higher, Hidden Divergence has formed.
Hidden RSI Divergence in a Downtrend
In a downtrend, the price creates lower lows, and corrective moves lead to lower highs. If RSI forms higher highs contrary to the price chart, Hidden Divergence has formed, increasing the probability of trend continuation.
Advantages and Disadvantages of RSI Divergence
RSI Divergence is useful for analyzing future market movements and trade management. However, due to signal lag, RSI alone is not enough for analysis and trade entry.
Disadvantages | Advantages |
False signals in ranging markets | Helps identify potential market reversal points |
Requires confirmation from other tools | Applicable in all markets and timeframes |
Ineffective in highly volatile markets | Improves risk management and reduces potential losses |
Needs experience and knowledge for accurate detection | Easily combined with other trading strategies |
Useful Tips for Better RSI Divergence Detection
To use RSI Divergence effectively, the following points must be observed:
- Combine with other tools: Divergences alone are not reliable; combine with support/resistance lines or other indicators;
- Appropriate timeframe: Divergences on higher timeframes are usually more reliable;
- Check trading volume: Volume changes can confirm or invalidate divergence signals.
Combining RSI Divergence, Candlestick Patterns, and Support/Resistance
Using only RSI Divergence reduces the win rate of trades. Combining it with candlestick patterns and support/resistance levels optimizes entry points and improves trade win rates.
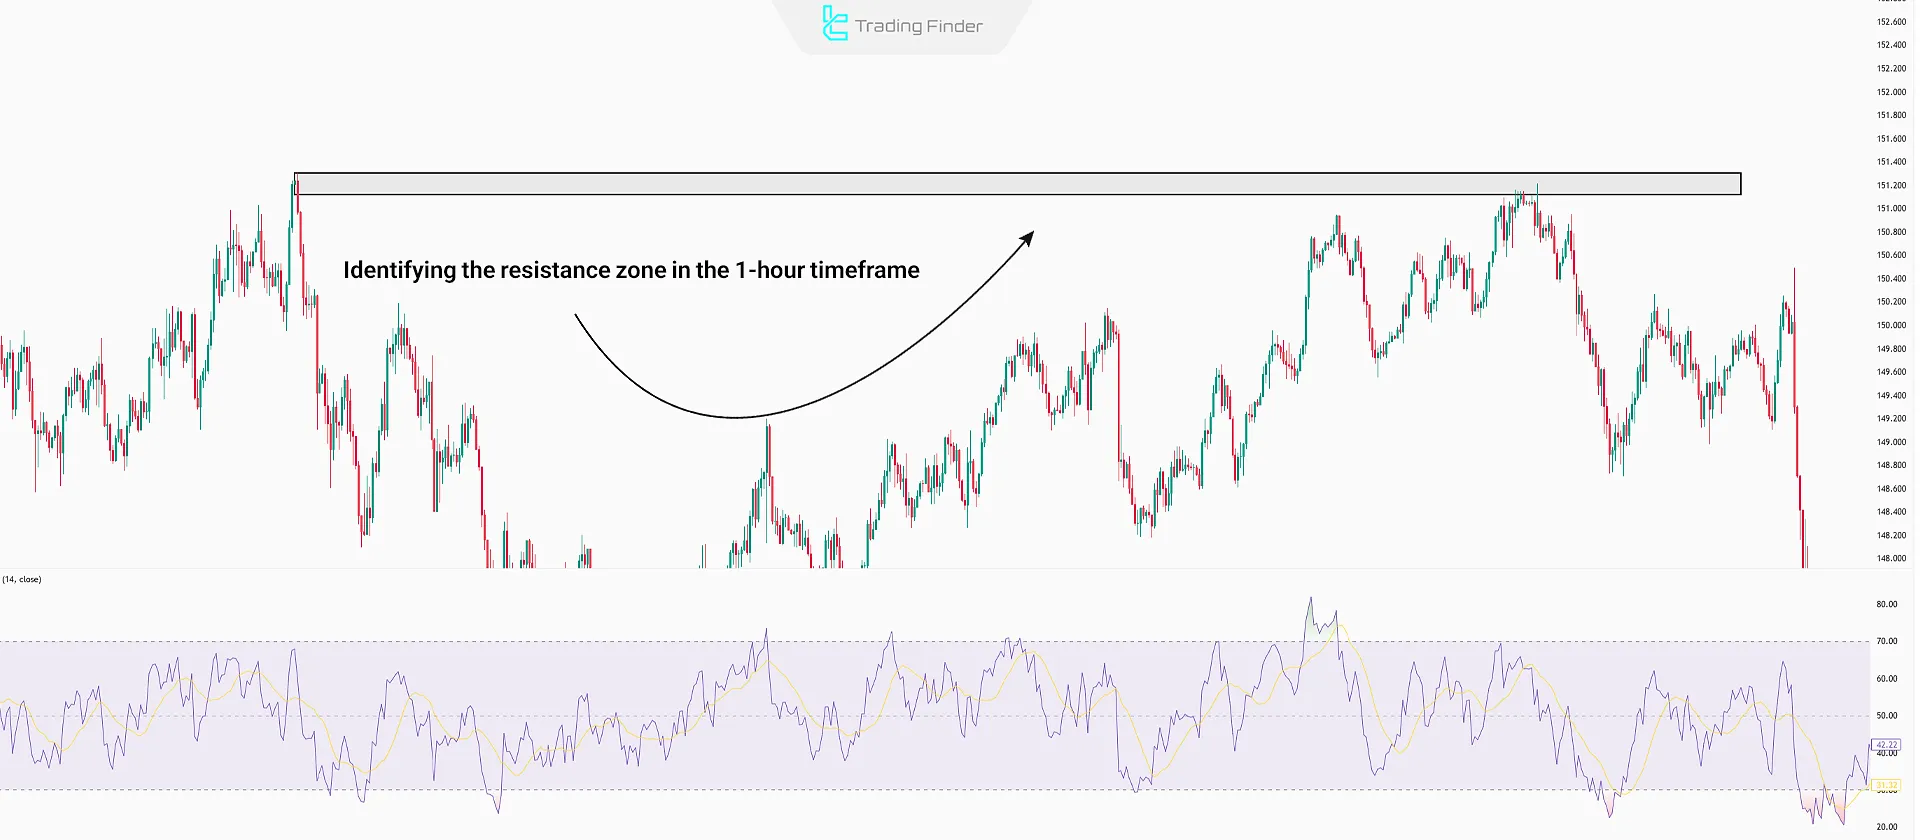
#1 Identify Support or Resistance Levels
Mark key historical support and resistance zones.
#2 Identify RSI Divergence
When the price reaches one of these zones, compare its highs and lows with those in RSI to identify Regular Divergence.
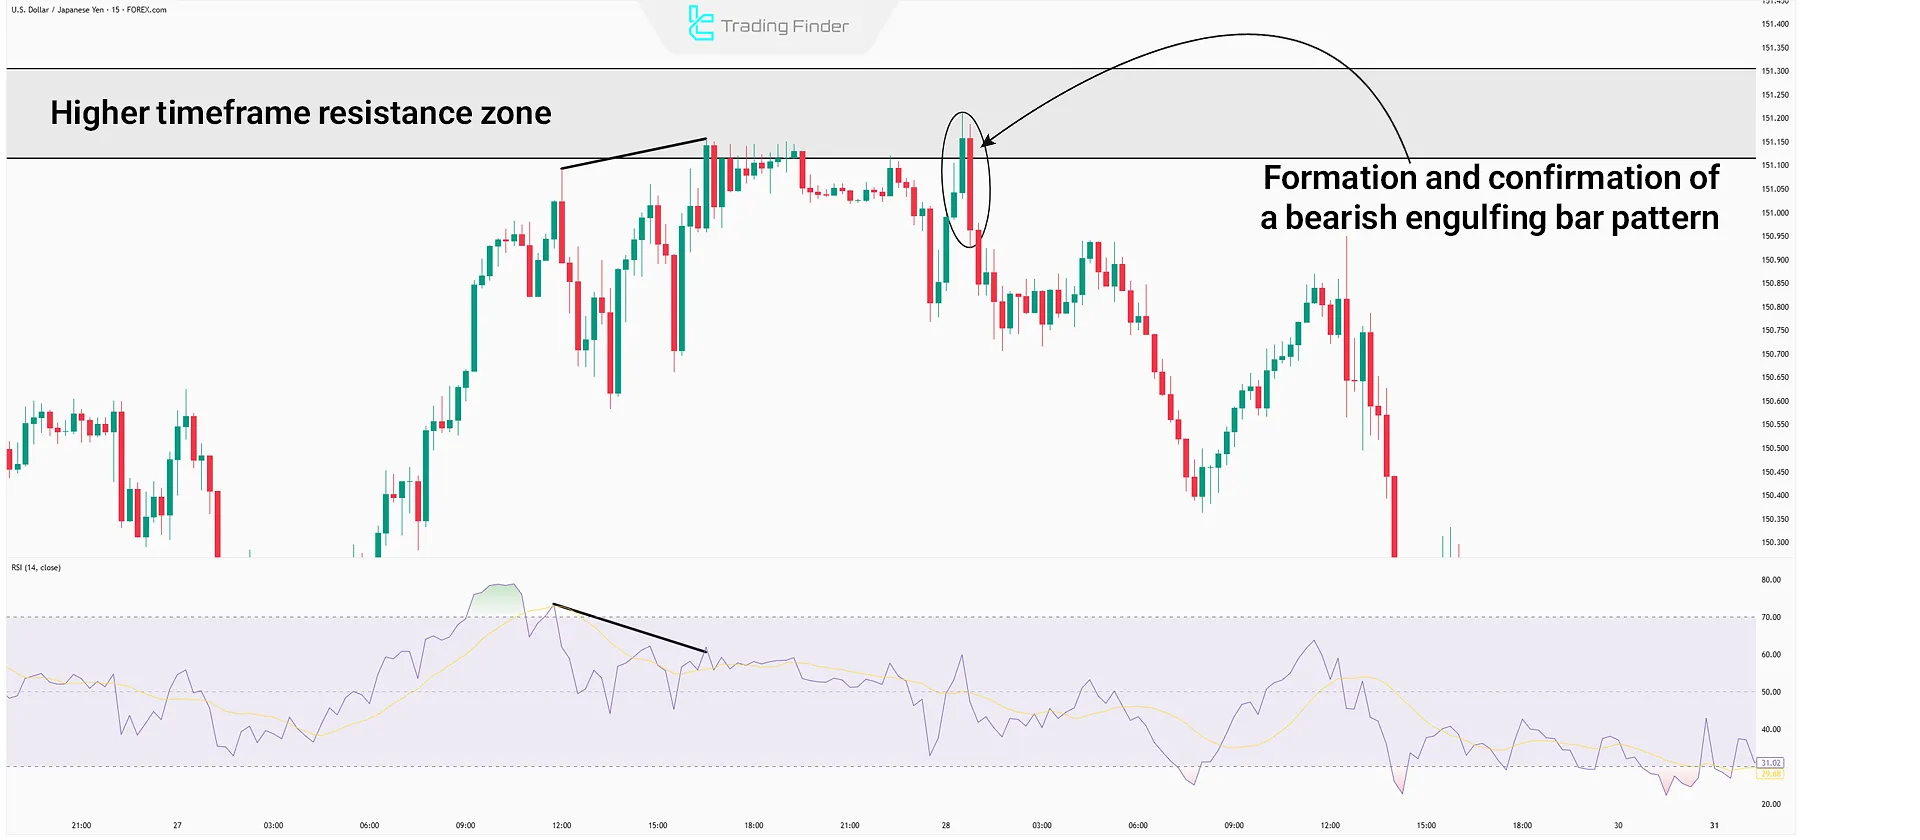
#3 Form Candlestick Patterns
After confirming divergence at specified levels, look for reversal candlestick patterns at resistance/support. Enter the trade after pattern confirmation.
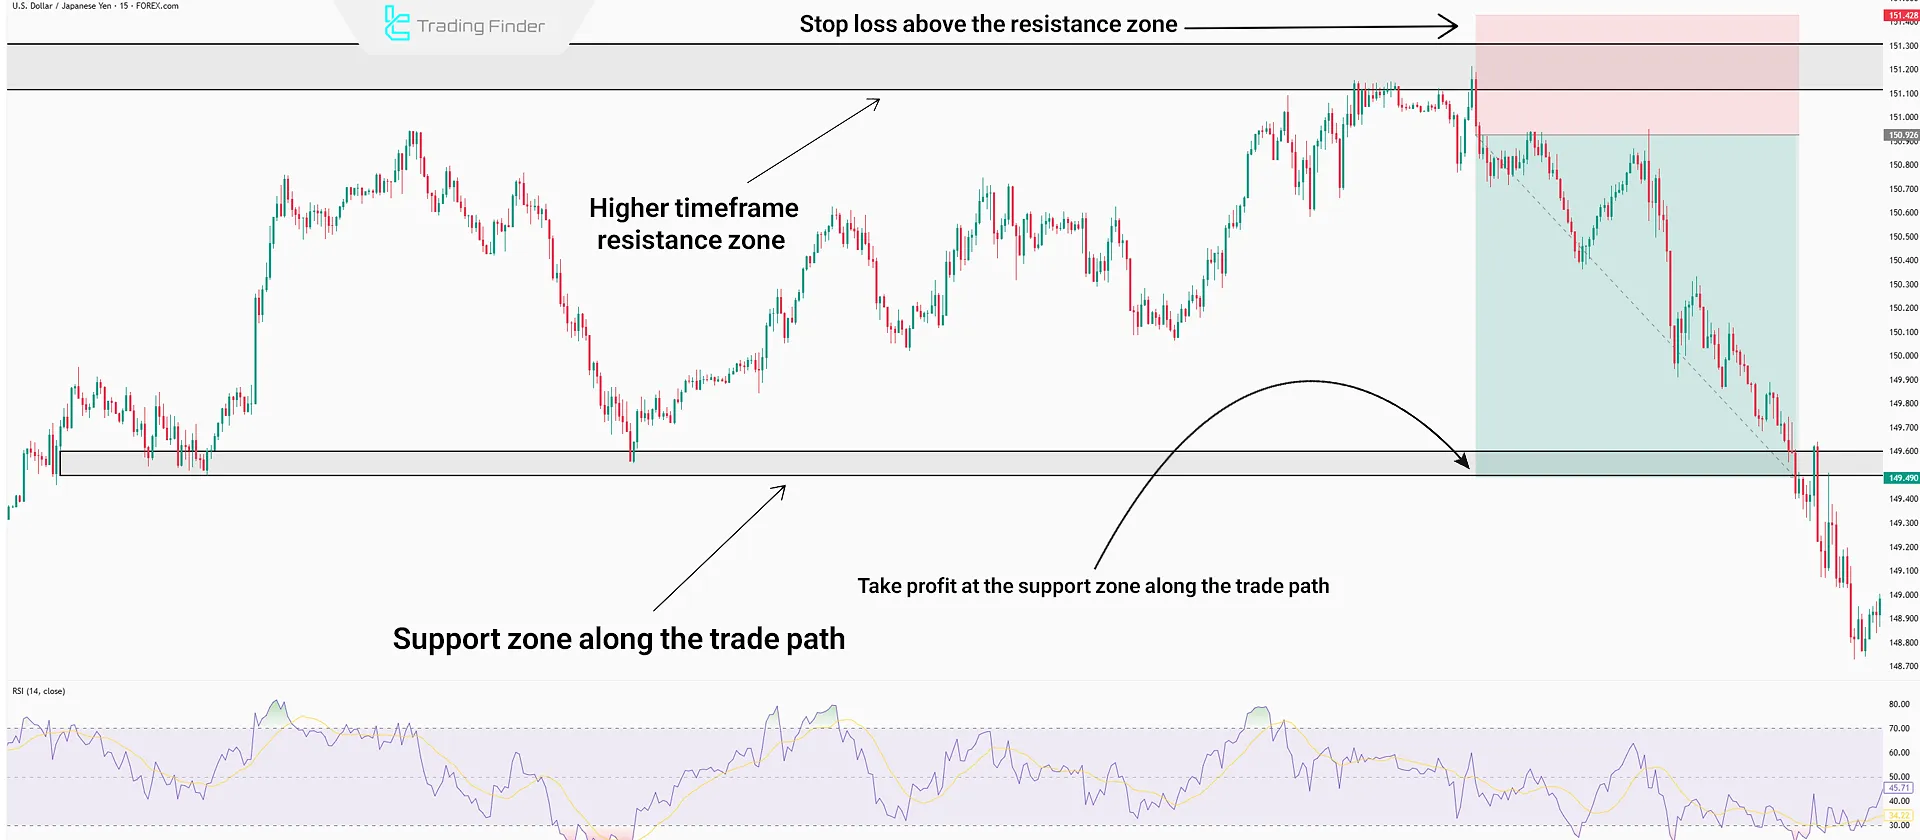
Stop Loss
In this setup, the stop loss is placed above the resistance or support zone, or behind the reversal candlestick formed in these areas.
Note: Two- or three-candle reversal patterns are more reliable than single-candle patterns.
Take Profit
Take profit is set according to support or resistance levels along the trade path. Hidden Divergence can also be used for capital management and keeping the position open.
Conclusion
RSI Divergence is a tool for identifying reversal or continuation points in financial markets, appearing in two types—hidden and regular. It helps detect potential trend changes or trend continuation early.
Combining RSI Divergence with candlestick patterns and support/resistance zones increases trade win rates and filters out false signals.


