


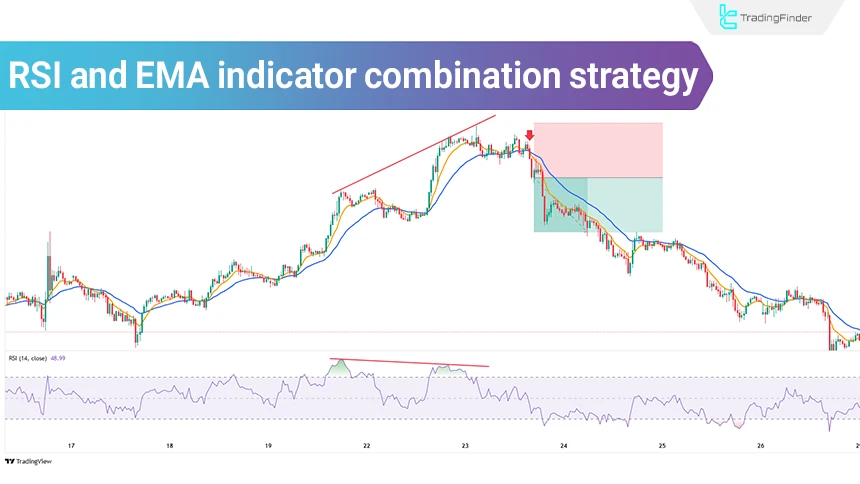
In the strategy combining RSI and EMA, the RSI indicator, by displaying overbought and oversold zones, and the EMA indicator, by displaying the exponential moving average of price, generate buy and sell signals on the chart.
The combination of these two tools, one focused on the relative strength of price and the other on trend, constitutes an appropriate trading strategy for day trading.
The effectiveness of this approach increases when signals are executed in alignment with market structure and accompanied by disciplined risk management.
Otherwise, relying solely on crossovers or overbought/oversold conditions can lead to low-validity signals in ranging markets.
Strategy Trading with RSI and EMA Indicators
The strategy combining the RSI and EMA indicators is a technical analysis method that is formed by using two indicators with different capabilities for better confluence.
In this strategy, the Relative Strength Index displays price divergences and overbought/oversold zones, and the Exponential Moving Average determines the trade entry and exit signals.
In fact, the RSI indicator acts as a confirmation tool for the entry and exit signals generated by the EMA indicator.
Rules For Buy and Sell Signals
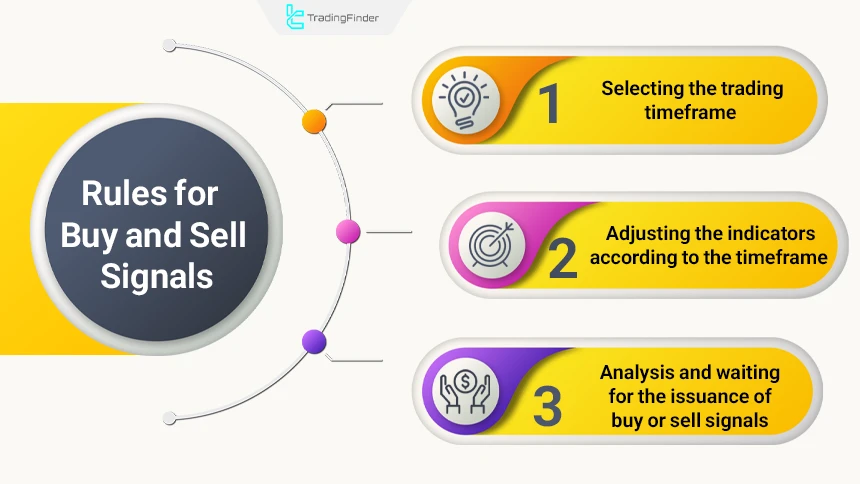
To use this strategy, the following steps must be followed:
- Selecting the trading time frame;
- Configuring the indicators according to the time frame;
- Analyzing and waiting for the issuance of buy or sell signals.
How Buy Signal is Generated
The following are part of the conditions for issuing a buy signal based on the combination of the RSI indicator and Exponential Moving Averages (EMA) in this strategy:
- Crossing of the RSI above the 30 level, indicating an exit from the oversold zone and the potential for a bullish market reversal;
- The price breaks above the EMA9 in a bullish manner and the EMA9 also crosses above the EMA26, signaling the start of an uptrend.
Using RSI Divergence as an Entry Filter
RSI divergence can act as a filter for the combined strategy:
- If the price forms a lower low while the RSI forms a higher low, the probability of a price reversal increases;
- If the price forms a higher high while the RSI forms a lower high, the probability of a decline exists.
In this case, an EMA cross in the direction of the divergence can be used as final entry confirmation and improves trade quality compared to simple overbought/oversold signals.
How Sell Signal is Generated
To execute sell trades in the RSI and EMA combination strategy, the following conditions must be met:
- Crossing of the RSI below the 70 level, indicating an exit from the overbought zone and the potential for a bearish market reversal;
- If the price is positioned below the EMA9 and the EMA9 crosses the EMA26 downward, the start of a new downtrend can be expected.
Setting Take Profit and Stop Loss
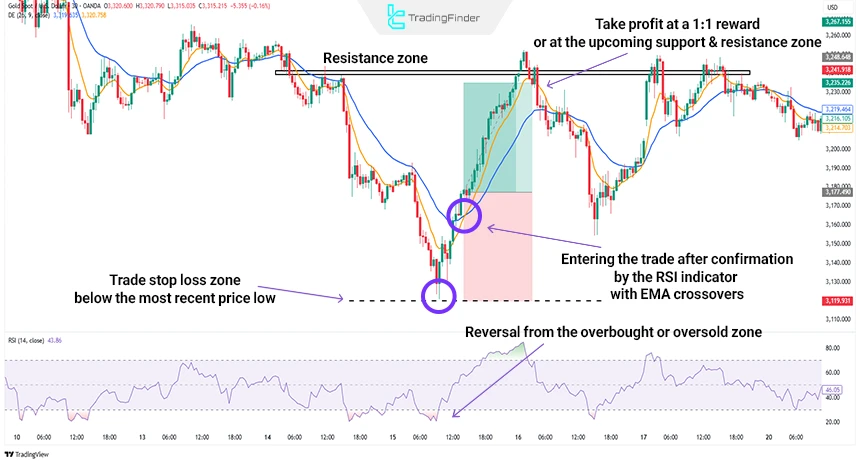
The stop loss in the RSI and EMA combination strategy, depending on the trade type, is placed exactly behind the most recent swing low or swing high on the price chart. This stop placement method is considered the safest approach for this strategy.
The take profit is usually set at a 1:1 reward ratio or at upcoming support and resistance levels. Additionally, when the RSI enters an overbought/oversold zone and a reverse signal is issued by the EMAs, the take profit can also be applied.
The Role of Market Structure in Filtering RSI and EMA Signals
RSI and EMA signals have greater validity when they are aligned with market structure. Market structure determines whether the market is in a bullish phase, bearish phase, or range condition.
Steps for analyzing market structure before entering a trade:
- Formation of a Higher High and Higher Low: Exclusive focus on buy positions;
- Formation of a Lower High and Lower Low: Validity only for sell positions;
- Price fluctuation within a fixed range or Range Market: Execution of the Relative Strength Index and Exponential Moving Average strategy only at the upper and lower boundaries of the range.
In the absence of these structural conditions, relying solely on the Exponential Moving Average crossover or the overbought/oversold status of the Relative Strength Index directs entries against the primary market trend.
The educational video of the JeaFx channel on Youtube regarding market analysis before entering a trade provides supplementary information, and interested individuals can watch this video for a deeper understanding.
Advantages and Disadvantages of Swing Trading With the RSI and EMA Combination Strategy
Swing trading using RSI and EMA simultaneously also has advantages and disadvantages. Among its advantages are early identification of reversal points and trends, and better risk management through combining two indicators.
On the other hand, disadvantages include the possibility of false signals in neutral markets and the need for precise parameter adjustment of the indicators for each trading symbol.
Advantages and disadvantages of the RSI and EMA combination strategy:
Advantages | Disadvantages |
Early identification of reversal points | False signals in neutral or ranging markets |
Trend identification | Need for precise parameter adjustment |
Better trade risk management | Inability to filter all signals |
Increased trading accuracy | Need for high trading experience |
How to use the RSI and EMA strategy in a range market
In a Range Market, the validity of Exponential Moving Average crossovers alone decreases, and the trader must base decision-making on support and resistance levels.
- Price approaching the lower boundary of the range while the Relative Strength Index enters below 30: Focus on buy positions;
- Price reaching the upper boundary of the range while the Relative Strength Index is positioned above 70: Exclusive validity for sell positions;
- Occurrence of an EMA Cross in the middle of the range: Eliminated from entry criteria.
Within this analytical framework, the Relative Strength Index (RSI) assumes the central role in determining trade direction, and the Exponential Moving Average (EMA) is used only to confirm entry or exit near key market levels.
The Importance of Observing the Signal Issuance Steps in the RSI and EMA Combination Strategy
To trade with the RSI and EMA indicators, receiving confirmations step by step is mandatory. Therefore, the sequence of signal generation stages is presented below.
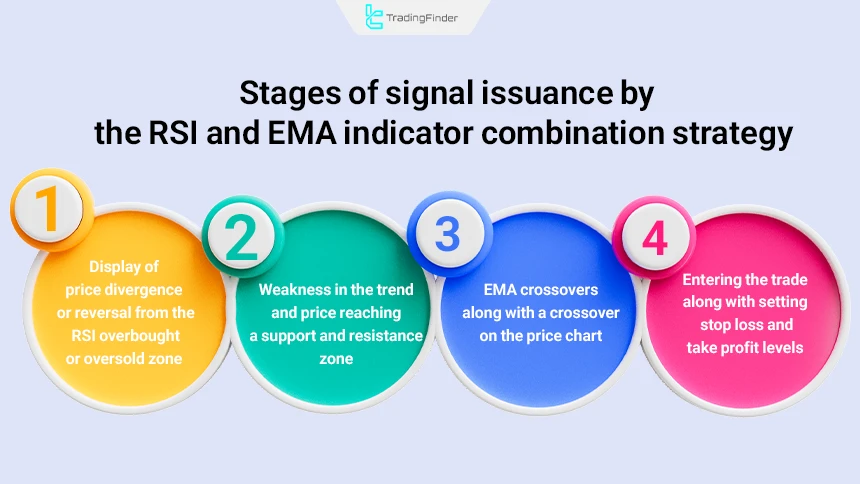
Stages of signal issuance by the RSI and EMA indicator combination strategy:
- Display of price divergence or reversal from the overbought or oversold zone by the RSI indicator;
- Weakness in the trend and price reaching a support or resistance zone;
- Exponential Moving Average crossover accompanied by a price chart crossover;
- Entering the trade along with setting stop loss and take profit levels.
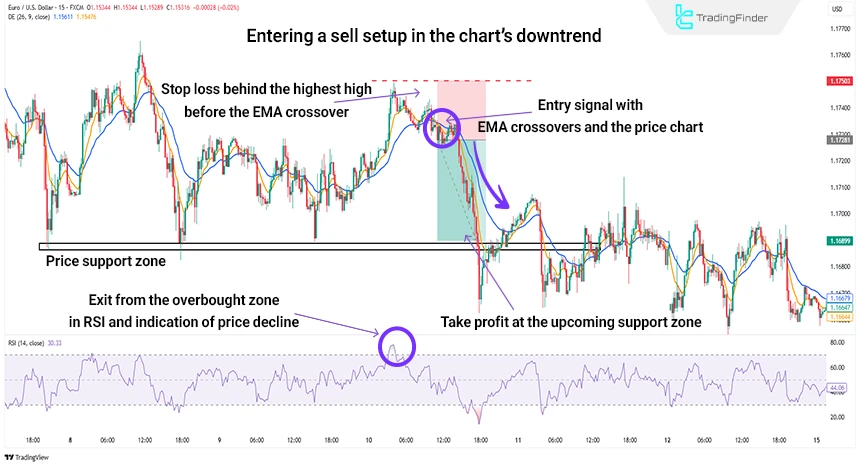
Example of Trading With RSI and EMA Indicators in the Market
Below, a comprehensive example of trading with the RSI and EMA indicators on the EUR/USD symbol is presented.
After the RSI exits the overbought zone and then an entry signal is generated by the moving average crossover on the price chart, sell trades can be initiated.
The stop loss for this trade is placed behind the most recent high formed before the overbought signal. For the take profit of this trade, price support zones or a 1:2 risk-to-reward ratio can also be used.
Optimal RSI and EMA Settings for Different Timeframes
To increase signal accuracy in this strategy, indicator settings must be adjusted according to the trading timeframe, because using identical settings across all intervals can lead to false or delayed signals.
- Lower timeframes (M5 to M15): Suitable for scalping and fast trades with a short-term trend filter; in these intervals, RSI is set to period 7 or 9, the fast EMA to period 9, and the slow EMA to period 21;
- Medium timeframes (M30 to H1): The best condition for standard execution of the strategy; in these intervals, RSI is set to period 14, the fast EMA to period 9, and the slow EMA to period 26;
- Higher timeframes (H4 and Daily): Suitable for swing trades with a focus on primary market trends; in these timeframes, RSI is set to period 14 or 21, the fast EMA to period 21, and the slow EMA to period 50.
In general, incorrect selection of settings causes the RSI to enter overbought or oversold zones prematurely and the EMAs to issue signals with delay, resulting in a higher probability of receiving incorrect or late signals.
Capital Management in the RSI and EMA Combination Strategy
Without capital management, even the best strategies become unprofitable. To use this strategy, the following capital management principles must be observed:
- Maximum risk per trade of 1 to 2 percent of total capital
- Minimum risk-to-reward ratio of 1:2
- Scaling into positions only after renewed confirmation from RSI and EMA
- Avoid entering more than 3 simultaneous trades with high correlation
In addition, applying a dynamic stop loss based on market volatility (such as using ATR) can better align risk exposure with changing price conditions and prevent premature or excessively delayed exits.
Interested individuals can refer to the Forex capital management training article on the mondfx.com website to gain a better understanding of capital management in trading.

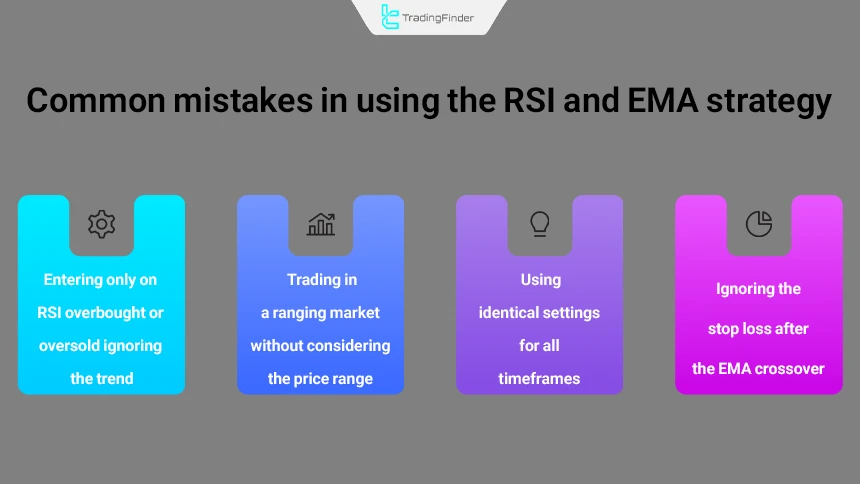
Common Mistakes in Using the RSI and EMA Strategy
The most common mistakes traders make when using the RSI and EMA combination strategy include:
- Entering a trade solely by observing RSI in an overbought or oversold zone without considering the trend;
- Trading in completely ranging markets without considering the upper and lower boundaries of the range;
- Using a fixed setting for all timeframes;
- Ignoring the stop loss in the hope of a price reversal after an EMA cross.
These errors cause the strategy to perform poorly even when the rules are correctly defined.
Comparison of the RSI and EMA Combination Strategy with MACD and EMA for Day Trading
For Day Trading, indicator combinations must be both fast and generate fewer false signals. The choice between these two approaches depends on market structure, volatility level, and the trader’s risk management style.
In the table below, a professional comparison of the two widely used strategies combining EMA with RSI and MACD is presented:
Comparison Criteria | RSI and EMA | MACD and EMA |
Signal issuance timing | Earlier | Later |
Probability of false signal | High in strong trends | Lower in clear trends |
Suitable for short timeframes | Yes | Moderate |
Suitable for swing trading | Moderate | Suitable |
Complexity level for beginners | Simpler | Moderate |
Dependence on market type recognition | High | Moderate |
Relative Strength Index on Moving Average (RSI on MA) Indicator in MetaTrader
The RSI on MA indicator, by combining the logic of Moving Average Crossovers and the analytical structure of RSI, provides a practical framework for simultaneously evaluating trend and price momentum.
This tool is designed in the MetaTrader environment as a leading oscillator and, with a focus on the oscillatory behavior of the market, creates a clearer view of changes in buying and selling strength.
The core functionality of this indicator is based on calculating the Relative Strength Index on two moving averages with different speeds.
The final output is displayed as two oscillating lines within the 0 to 100 range, each representing a separate moving average; the fast line tracks short-term changes, while the slow line provides a broader picture of market movement.
When these two lines intersect, the trader is faced with an analytic alalert that may indicate a change in direction or a strengthening of the trend.
When both lines approach the lower boundary of the range and the slow line crosses the fast line upward from below, the probability of a bullish wave formation increases. This condition is usually considered a signal to evaluate buying opportunities.
Conversely, when the lines reach the upper boundary of the oscillation range and the slow line crosses the fast line downward from above, the bearish scenario is strengthened and may provide the basis for sell decisions.
From a trading application perspective, this indicator delivers the highest efficiency in day trading and multi-timeframe analysis and can be used in Forex, Cryptocurrency, stock, and forward markets.
Its structure is designed in a way that intermediate-level traders can identify the dominant market trend without excessive complexity.
The settings section includes parameters such as RSI Period, fast and slow moving average periods, moving average type, and applied price type (open, close, high, or low), allowing customization of the indicator based on an individual strategy.
Overall, RSI on MA is a hybrid tool that, through the synergy between RSI and moving averages, generates signals based on line crossovers and provides traders with trend and momentum analysis in a simple yet practical format.
Conclusion
The RSI and EMA combined strategy is an analytical framework for short-term and scalping trades that enhances the quality of entry and exit signals by integrating momentum (RSI) and trend structure (EMA).
In this model, RSI identifies overbought and oversold zones and price divergences, while EMAs provide more precise trade timing through structural crossovers.
Overall, this strategy works best as a multi-stage confirmation system (market structure, momentum, and trend) rather than relying only on overbought/oversold signals or simple crossovers, as it can otherwise generate false signals in ranging markets.
It should be noted that indicators are suitable as trade confirmation tools, and using them alone carries its own specific risks.


