


Single candlestick patterns are recognized as basic yet impactful tools in technical analysis, and with the formation of just one candle, they provide signals of a potential reversal or weakening of the current market trend.
These patterns convey a specific message based on the structure of the candle body, the candlestick wicks, and the candle’s position within the price trend. Through precise interpretation of price behavior, traders can identify the probable direction of the market’s next move.
Patterns such as Hammer, Doji, and Hanging Man generate distinct signals under different market conditions, each representing a specific concept of buying or selling pressure.
What is a Single Candlestick Pattern?
A single candlestick pattern analyzes the visual shape, body size, and shadow length of a specific candle to display a potential signal of trend change or continuation.
This pattern reflects price behavior within a limited time window, and its characteristics are identifiable within the structure of that single candle:
- Only one candle is involved in the analysis of this pattern;
- It usually appears in price reversal or trend continuation zones;
- Its importance is evaluated based on the candle’s position within the overall market trend;
- In these patterns, the ratio of shadows to the candle body is highly important;
- They are usable across all market timeframes;
- The formation of these patterns is also possible during fake breaks or Depending on the market trend, they play a bullish or bearish role;
- fakeouts;
- They are suitable as confirmation tools for low-risk strategies.
Advantages and Disadvantages of Single Candlestick Patterns
Despite their simple structure, single candle patterns have specific advantages and disadvantages from an analytical perspective, and depending on the candle’s position within the market trend, they exert different effects on trading decisions.
The table below examines the strengths and weaknesses of these patterns based on price behavior and trend position.
Advantages | Disadvantages |
Simple and easy-to-understand structure | Fake and high-error signals |
High speed in analysis and decision-making | Strong dependence on position within market structure |
Usable across all timeframes | Reduced reliability in ranging and trendless markets |
Ability to combine with other tools | Lack of certainty without a confirmation candle |
Suitable for identifying entry and exit points | Similarity between some patterns and risk of misinterpretation |
Wide application across different markets | Incorrect interpretation by inexperienced traders |
Market Psychology in Single Candlestick Patterns
Single candlestick patterns go beyond a simple visual structure on the price chart and represent a direct reflection of traders’ psychology within a specific time period.
For example, in the Hammer pattern, sellers push the price down with significant pressure, but buyers then enter the market strongly and drive the price back toward the upper range; this behavior indicates a reduction in selling pressure and an increased probability of a market direction change.
To better understand market psychology in candlestick patterns, you can watch the educational video on the Neeraj joshi YouTube channel.
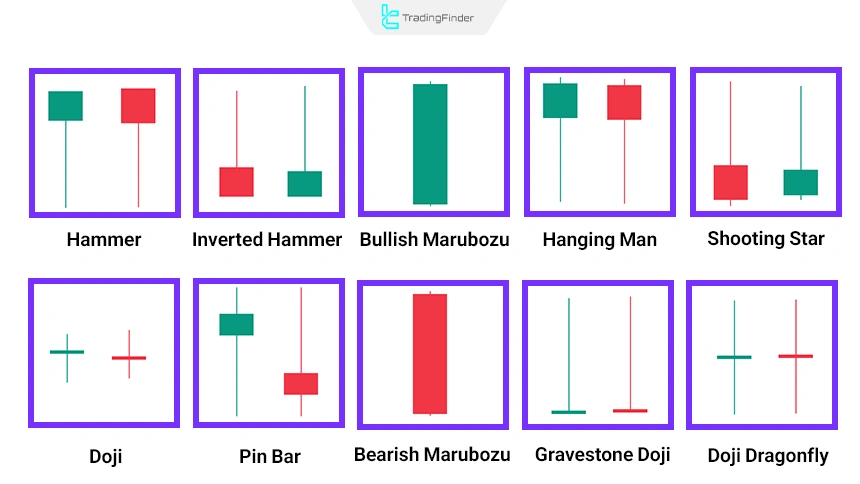
Types of Single Candlestick Patterns
Single candlestick patterns have a specific and limited number of types, and due to their high statistical reliability and repeatability on price charts, they hold a special position in technical analysis.
These patterns display price behavior within a single candle, and through accurate interpretation, the trader extracts meaningful signals about the trend condition. Below, some common and well-known patterns are introduced:
Single candlestick pattern name | Signal type | Description |
Hammer | Bullish | Reversal from the bottom with a long lower shadow |
Inverted hammer | Bullish | Reversal from the top with a long upper shadow |
Hanging man | Bearish | Signal of price reversal at market highs |
Shooting star | Bearish | Signal of selling pressure at market highs |
Bullish marubozu | Bullish continuation | A candle with no shadows, indicating buyer strength |
Bearish marubozu | Bearish continuation | A candle with no shadows, indicating seller strength |
Doji | Indecision | Opening and closing prices are nearly equal or very close |
Dragonfly doji | Bullish | A candle with no body and no upper shadow, with a long lower shadow |
Gravestone doji | Bearish | A candle with no body and no lower shadow, with a long upper shadow |
Pin bar | Reversal | A candle with a long shadow on one side |
The visual appearance of single candlestick patterns can sometimes be very similar to one another, but identifying them becomes easier when considering their placement within the market structure.
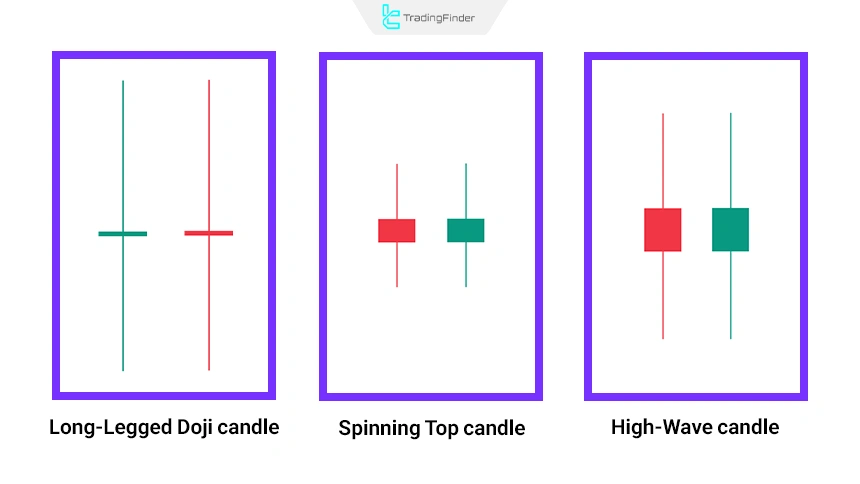
Alongside these common structures, less frequently used patterns also exist that gain validity under specific market conditions and include the following:
Single candlestick pattern name | Signal type | Description |
Spinning Top | Indecision | Small body with equal shadows |
High-Wave candle | Instability | Very long shadows on both sides |
Long-Legged Doji | Indecision | A specific form of Doji with very long shadows |
Special single candlestick patterns are seen less frequently on the price chart, but in some cases, they carry significant importance.
Which Single Candlestick Patterns Have Higher Reliability?
The classification in the table below allows traders to establish more precise analytical priorities.
In this way, higher-reliability patterns are considered the primary basis for decision-making, while weaker patterns are used merely as warning or complementary signals to enhance analytical accuracy and risk management.
Single candlestick pattern | Reliability level | Explanation |
Hammer | High | Especially effective at the bottom of a downtrend |
Hanging Man | Medium | Requires confirmation from the next candle |
Doji | Medium | More of a warning than a direct signal |
Marubozu | High | Indicates absolute strength of buyers or sellers |
Pin bar | High | If formed at a key level |
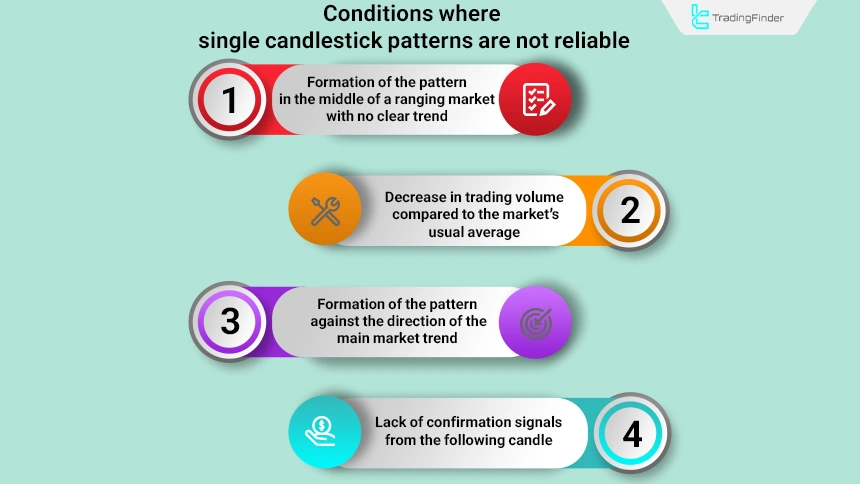
When are Single Candlestick Patterns Not Reliable?
Single candlestick formations, without additional confirmation, are not considered standalone and reliable trading signals. Single candlestick patterns lack analytical validity under the following conditions:
- Formation of the pattern in the middle of a ranging market with no clear trend;
- Decrease in trading volume compared to the market’s usual average;
- Pattern formation against the direction of the main market trend;
- Lack of confirmation signals from the following candle.
The Role of Trading Volume in Confirming Single Candlestick Patterns
When a single candlestick pattern is accompanied by an increase in trading volume, its analytical reliability increases significantly. High volume reflects the participation of major market players in the price movement and removes retail traders as the primary driving factor.
The simultaneous occurrence of a single candlestick pattern with a noticeable rise in trading volume strengthens the signal, as liquidity flow confirms the price movement and reduces the likelihood of the pattern being random.
Under such conditions, alignment between the pattern and the trend structure increases confidence in trading decisions.
Performance of Single Candlestick Patterns Across Different Timeframes
single candle patterns on higher timeframes, such as four-hour and daily charts, have greater reliability compared to lower timeframes.
On smaller timeframes, market noise can generate misleading signals. In technical analysis, single candlestick patterns on higher timeframes benefit from greater analytical validity because they encompass a larger set of price data and reflect the more realistic behavior of major market participants.
In contrast, on lower timeframes, short-term volatility and noise caused by emotional trading can lead to false signals; therefore, relying on these patterns is recommended only when they align with the dominant trend and are confirmed by other technical tools.
Those interested in gaining a better understanding of how to choose timeframes for analyzing candlestick patterns can refer to the article training the best timeframes for using candlesticks on the candlestickpatternspro.com website.
Combining Single Candlestick Patterns with Support and Resistance
One of the most powerful applications of single candlestick patterns emerges when these structures form at key support or resistance zones.
For example, the formation of a Hammer pattern at a valid support level significantly increases the probability of a price reversal.
A professional trader never analyzes a pattern in isolation from the overall market structure and always evaluates it within the context of price action.
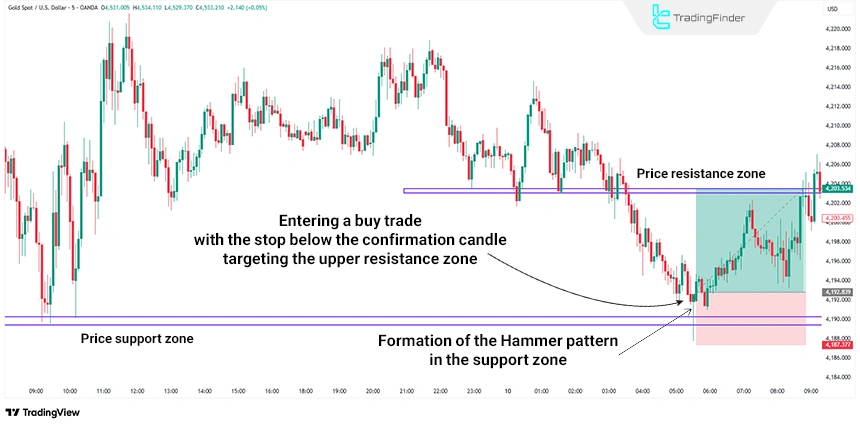
Example of Combining Single Candlestick Patterns with Support and Resistance Zones
Assume the price of a financial asset, such as a stock or cryptocurrency, is moving within an established downtrend and, after breaking several minor lows, reaches a valid and key support zone; a zone that has shown multiple price reactions in the past and holds high importance from the perspective of professional traders and smart money.
Within this area, signs of weakening selling pressure and a potential demand response gradually appear in price behavior, including the following:
- Formation of a Hammer candle with a long lower shadow at the support zone;
- Indication of rejection of lower prices and the entry of demand;
- Closing of the next candle above the Hammer’s high as a confirmation candle.
Based on these conditions, the trading details in summary are as follows:
- Entry: Above the high of the confirmation candle;
- Stop loss: Below the end of the Hammer’s lower shadow;
- Price target: The first valid resistance zone.
Difference Between Single Candlestick Patterns and Two and Three Candle Patterns
Single candlestick patterns generate signals more quickly, but compared to two-candle and three-candle patterns, they also carry a higher probability of error.
The table below compares single candle patterns with two-candle and three-candle patterns:
Comparison criterion | Single candlestick patterns | Two-candle patterns | Three-candle patterns |
Signal generation speed | Very high | Medium | Low |
Pattern formation time | One candle | Two consecutive candles | Three consecutive candles |
Degree of delay relative to price | Minimal | Medium | High |
Analytical reliability | Low to medium | Medium to high | High |
Probability of false signals | High | Medium | Low |
Noise sensitivity level | High | Medium | Low |
Need for additional confirmation | High | Medium | Low |
Price structure clarity | Limited | Adequate | Clear |
Suitability for volatile markets | High | Medium | Low |
Dominant trading application | Scalping and fast entries | Short-term swing trading | Medium-term swing and trend trading |
Inherent risk level | High | Medium | Low |
Role in professional strategies | Early warning | Secondary filter and confirmation | Final confirmation and decision-making |
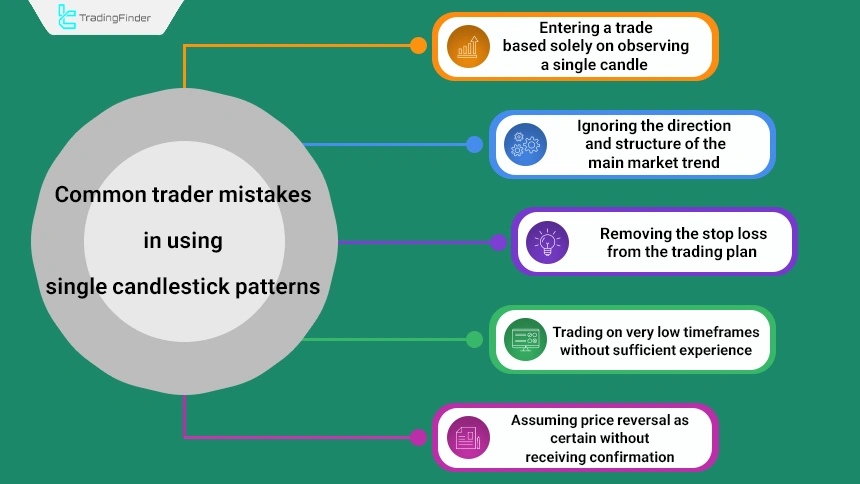
Common Trader Mistakes in Using Single Candlestick Patterns
Common mistakes traders make when using single candlestick patterns are related to incorrect analytical behavior and rushed decision-making, and they directly affect trading outcomes. The most important mistakes include the following:
- Entering a trade based solely on observing a single candle;
- Ignoring the direction and structure of the main market trend;
- Removing stop loss from the trading plan;
- Trading on very low timeframes without sufficient experience;
- Assuming price reversal as certain without confirmation.
Morning and Evening Star Pattern Indicator
The Morning and Evening Star indicator is a specialized technical analysis tool designed with a focus on reversal candlestick patterns, helping traders identify potential price reversal points with greater accuracy.
This indicator highlights the Morning Star pattern with a blue box and the Evening Star pattern with a pink box on the chart, allowing for fast and unambiguous visual identification.
- Morning and Evening Star indicator for TradingView
- Morning and Evening Star indicator for MT5
- Morning and Evening Star indicator for MT4
Morning Star and Evening Star patterns typically form at the end of price trends and, from a price action perspective, signal a weakening of the current trend and an increased probability of price reversal.
For this reason, this indicator is classified as a reversal-oriented and candle-based tool and is widely used by beginners through day traders.
Structurally, the Morning Star pattern appears after a downtrend. First, a strong Bearish single candlestick patterns candle is formed, followed by a small-bodied candle that indicates market indecision, and finally a strong bullish candle confirms the beginning of a new upward move.
In contrast, the Evening Star appears at the end of uptrends, where a large bullish candle, a small middle candle, and then a strong bearish candle indicate a market phase shift toward the downside.
This indicator is usable on MetaTrader and TradingView and supports multiple timeframes simultaneously. As a result, it can be applied across various markets, including forex, cryptocurrency, and stocks, and shows high compatibility with day trading styles.
Parameters such as Fast MA Period and Slow MA Period are adjustable for moving average calculations, while Long Body Factor and Short Body Factor are configurable for identifying candle body size. In addition, the colors of the Morning Star and Evening Star patterns can be customized according to trader preference.
Overall, the Morning Star and Evening Star indicator simplifies and enhances the accuracy of identifying suitable entry points and analyzing trend changes in financial markets by providing a clear visual representation of classic reversal patterns. Interested users can also benefit from the Hammer pattern recognition indicator by TradingFinder in a similar manner.
Conclusion
Single candlestick patterns, despite their simple structure, play an effective role in analyzing price movements and are defined as tools for identifying reversal or trend continuation points.
Accurate application of these patterns requires a thorough understanding of candle components, their position within the trend, and the ratio of body to shadows within the overall market structure.
Incorrect application or use outside an appropriate analytical context generates misleading signals and increases the risk of trading losses.


