


From the alignment of several candlesticks on the price chart, shapes are formed that are known as classic chart pattern in technical analysis.
All classic trading patterns reflect the psychology of supply and demand in the market and are divided into two categories: reversal and continuation.
Their main purpose is to help identify trend reversals or continuations and to determine suitable entry zones and stop-loss levels
The foundation of Classic Patterns is based on support and resistance levels.
When the price repeatedly reacts to a specific level, the conditions for the formation of classical price patterns are created similar to what we see in traditional chart patterns.
What Are Classic Chart Patterns?
Classical patterns are recurring formations on the price chart that are created based on the collective behavior of the market in different situations.
These patterns are the result of market psychology in response to changes in supply and demand, and their purpose is to help identify trend continuation or price trend reversal.
They are commonly used in traditional technical analysis and act as a complement to other methods of analysis, such as price action.
On the Wysetrade YouTube channel, tutorials of various classical patterns are published as videos:
(This video provides examples of trading classic chart patterns)
Application of Classic Patterns
Due to their repetitive nature, classic Chart patterns are used to predict future price movements.
Since they clearly define highs and lows, these patterns are helpful in identifying entry points and setting stop-loss and Take-Profit levels in the Forex market, stock market, and cryptocurrency.
Reasons for Using Classic Patterns
Although classic Chart patterns are traditional methods of technical analysis, they are still widely used in financial markets due to:
- Simplicity in identification
- Compatibility with other analytical tools, such as indicators, trading volume, and candlestick patterns
Reliable Chart Patterns
Classic Chart patterns are categorized into Reversal Patterns and Continuation Patterns.
Reversal Patterns
These classic patterns indicate a weakening of the current trend and a potential trend reversal.
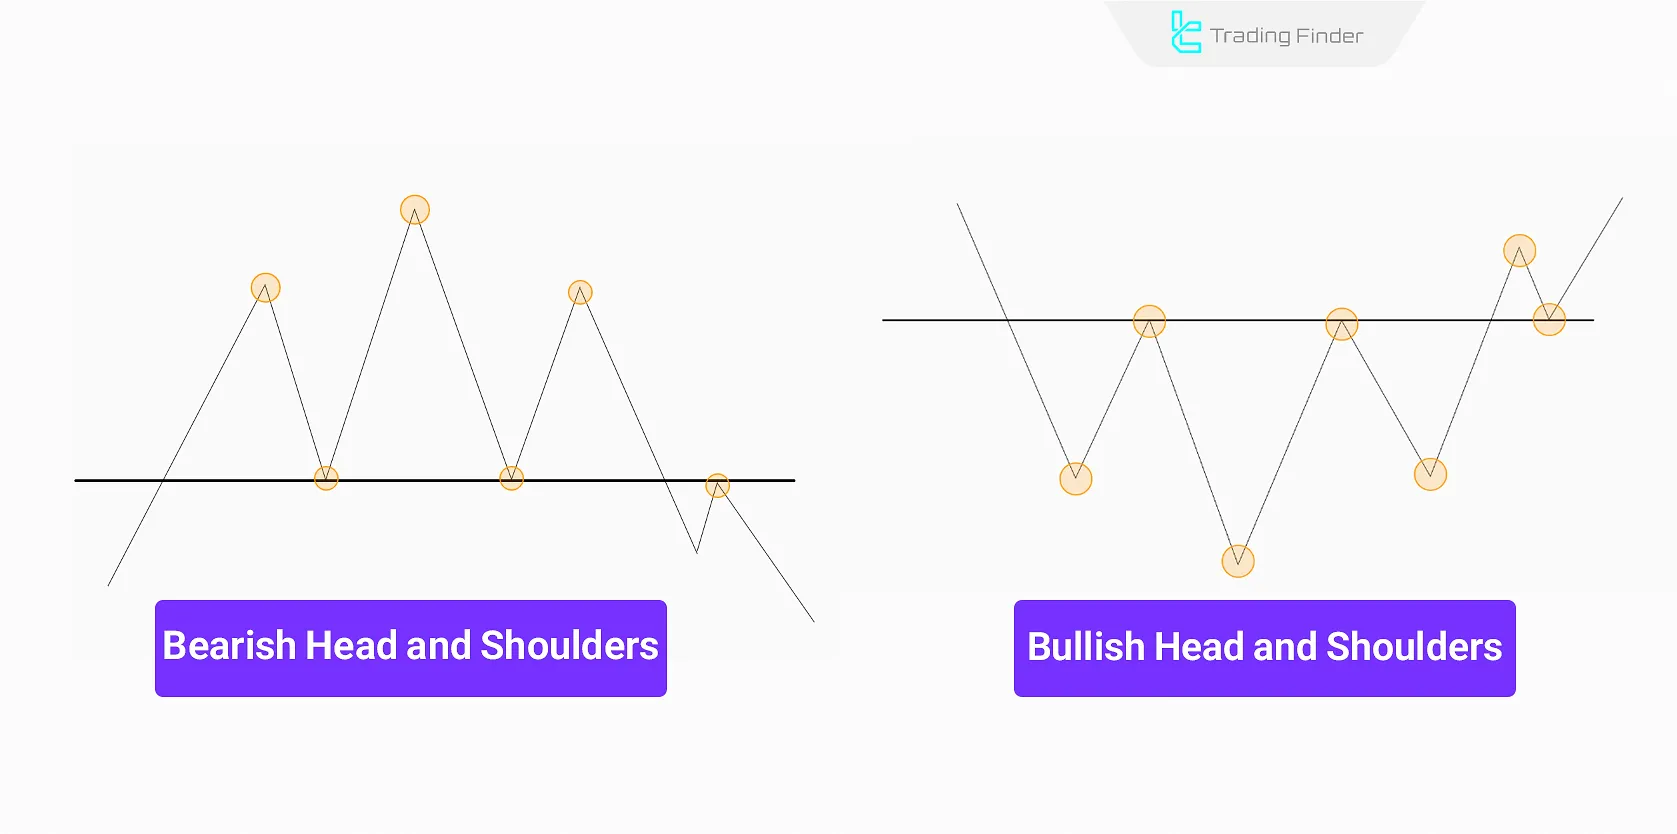
Head and Shoulders
The Head and Shoulders reversal pattern signals the end of a trend and a possible change in price direction. This pattern consists of one larger middle peak (or valley) and two smaller side peaks (or valleys).
The pattern is more reliable in medium to long term timeframes, as the price must be in a strong trend before forming the pattern. It is most visible in H1, H4, and Daily timeframes.
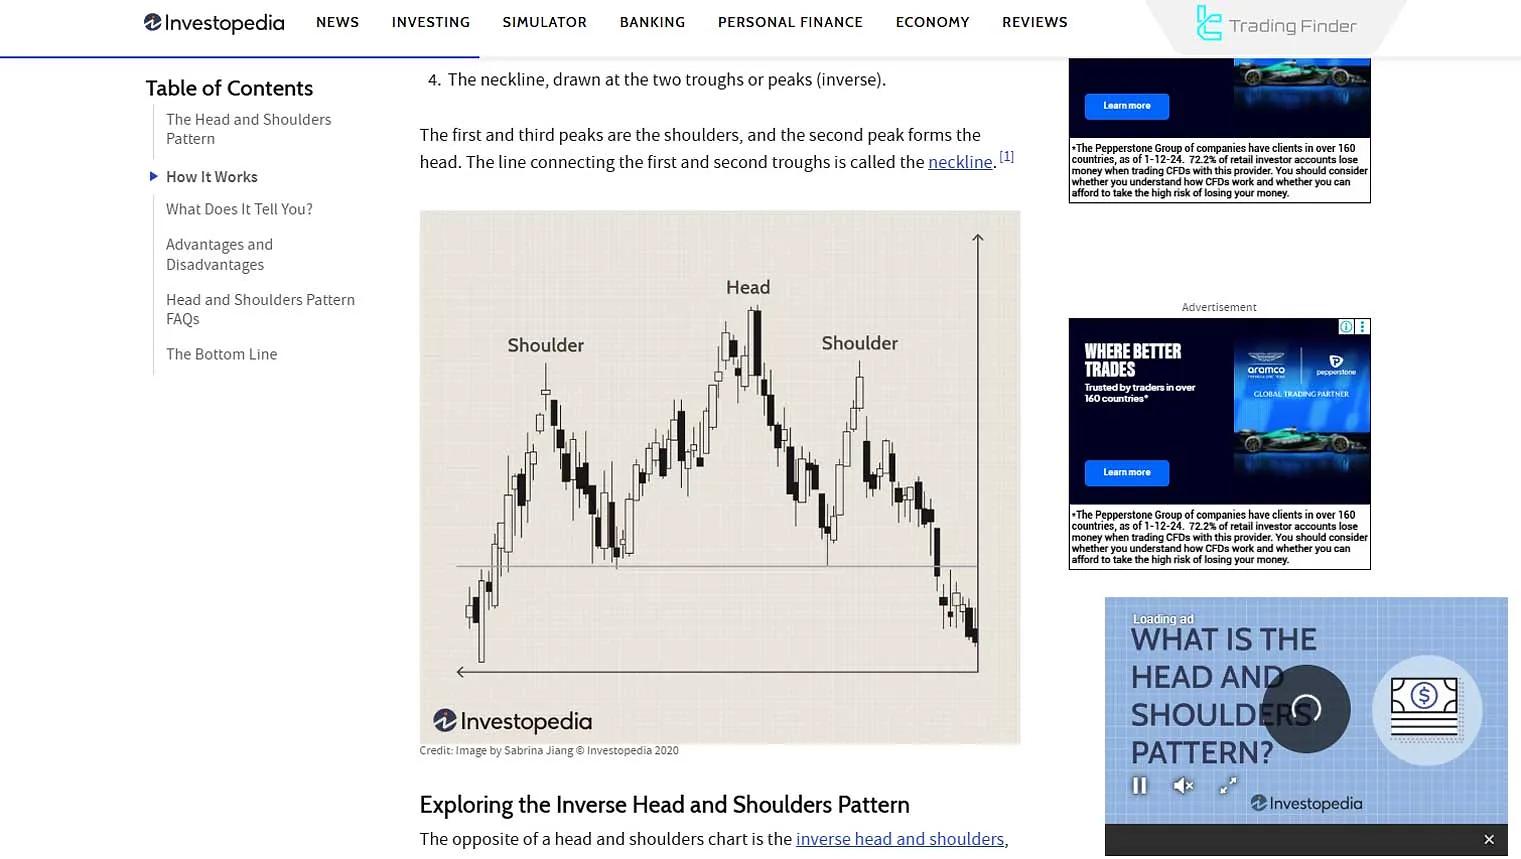
In the Head and Shoulders pattern, before reaching the first peak or trough, there is the possibility of increased market volume.
After reaching the second peak, the volume decreases compared to the previous peak or trough, which indicates weakening buying power.
At the third peak or trough, the volume is lower than the previous two, signaling the exhaustion of the current trend. The Head and Shoulders can be considered one of the most important types of classic reversal pattern.
The head and shoulders pattern is fully explained in the head and shoulders tutorial article on the Investopedia website.
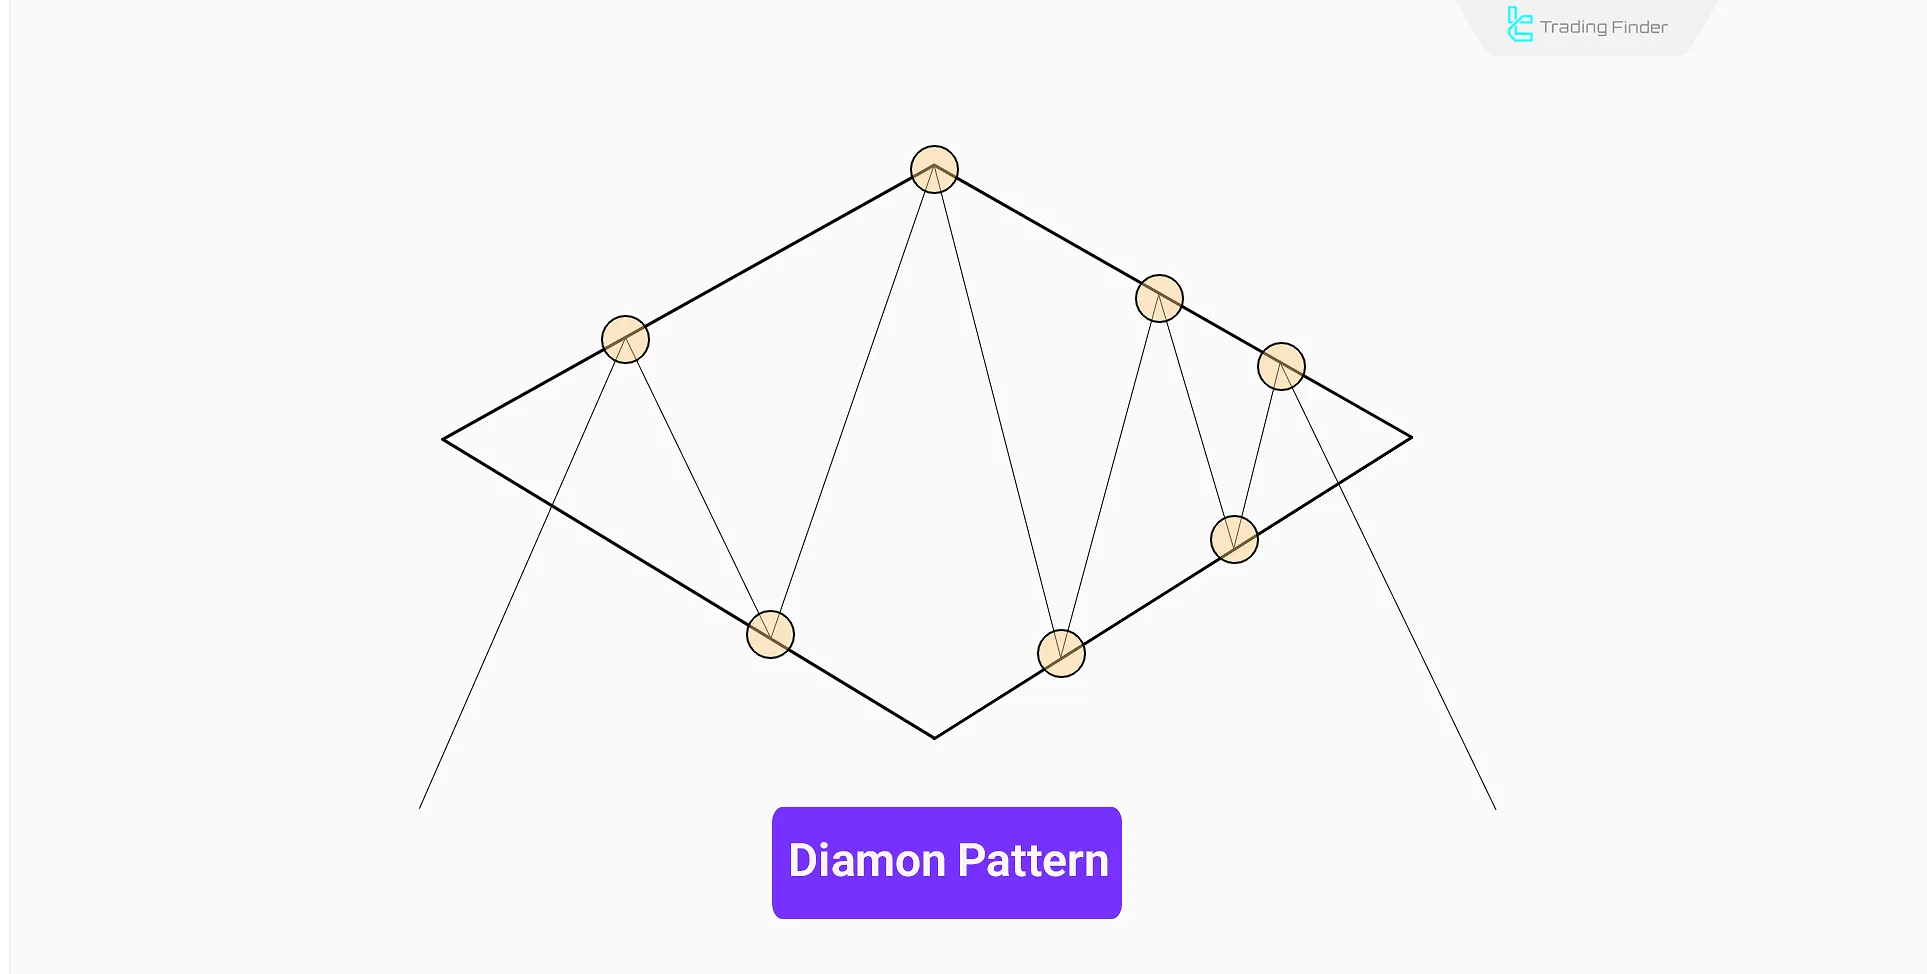
Diamond Pattern
The Diamond pattern is a reversal formation that often appears at the end of strong uptrends. Its shape resembles a diamond on the chart, first characterized by a phase of expansion and then by price contraction.
The formation of this pattern indicates a gradual shift in market momentum; a point where buyers lose control and sellers gain strength. A break of the support line at the end of the pattern signals the start of a downtrend.
The stop-loss is usually placed above the last peak inside the diamond structure, and the price target is calculated based on the height of the widest internal distance of the pattern from the breakout point.
In sources such as classical pattern books, this structure is introduced as one of the most reliable classic patterns trading.
Double Top & Double Bottom
A Double Top forms two consecutive peaks at a resistance level, signaling a bearish reversal. Conversely, a Double Bottom forms two troughs at a support level, indicating a potential bullish reversal.
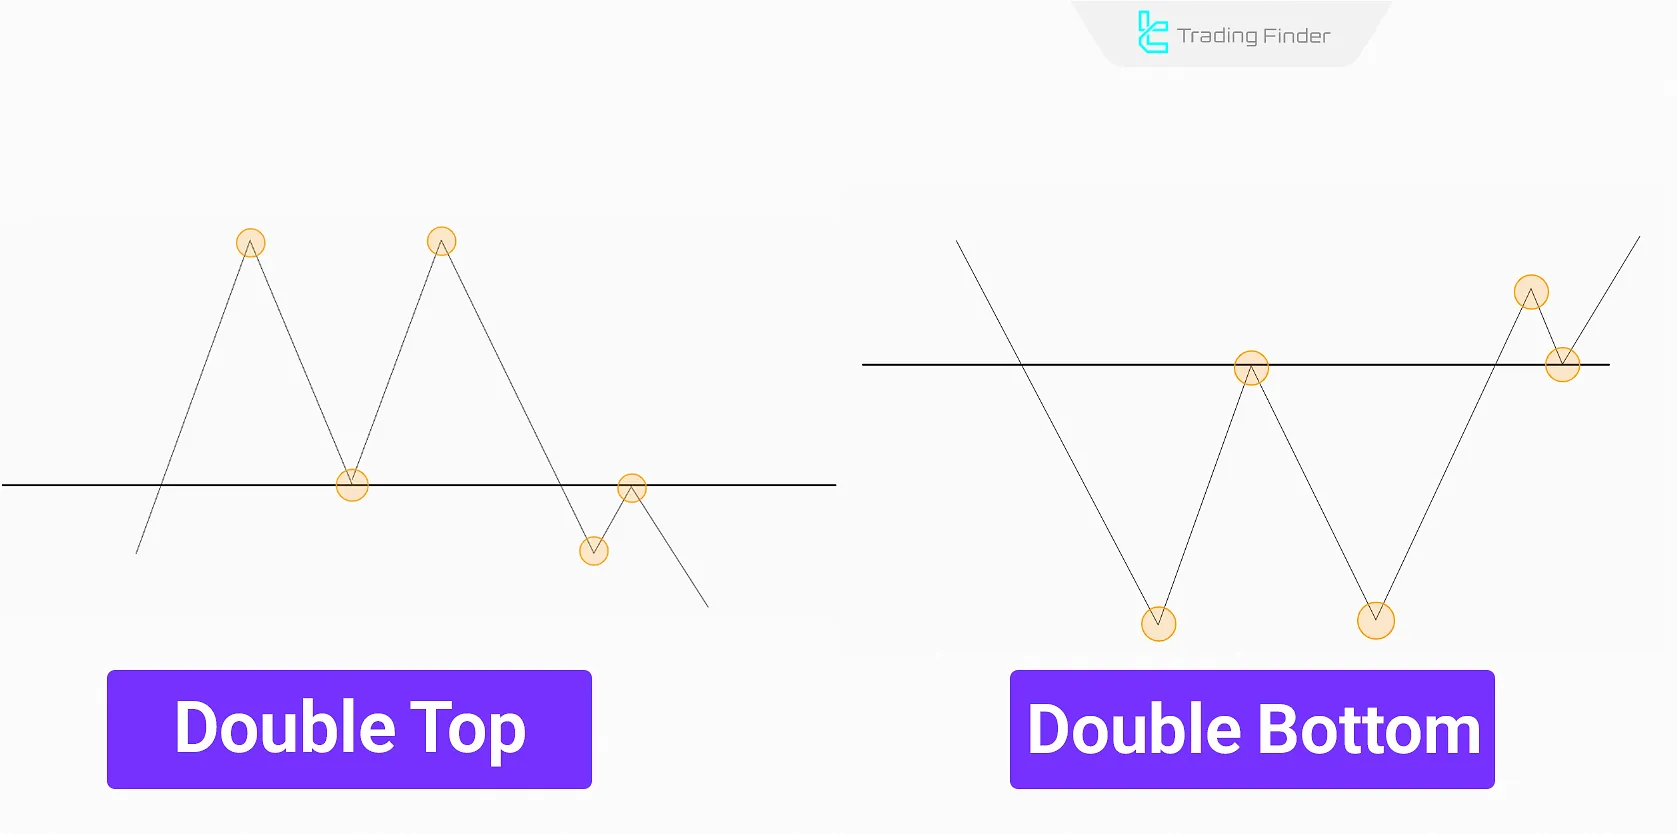
The double Top and Double Bottom pattern is commonly seen in short to medium term timeframes, particularly in 30-minute to 4-hour charts (M30, H1, H4), as it often forms after a strong price wave.
In the Double Top and Double Bottom pattern, market volume is high when reaching the first peak or trough, showing the continuation of the current trend.
When pulling back from the first peak or trough, volume decreases, and as the price moves toward the second peak or trough, volume increases again but is still lower than the previous high or low.
As the price moves toward the support between the two bottoms or resistance between the two tops, the volume suddenly increases and breaks the level, which confirms the pattern’s validity.
With each retest of the peaks or troughs, market volume decreases; usually, at the third top or bottom, volume is much lower than the first.
If the breakout of this pattern’s support line occurs with low volume, there is a chance of a false breakout and a return to the previous trend.
This pattern has similarities to the double top and triple top pattern and is also described in educational texts as part of forex reversal chart patterns.
Triple Top & Triple Bottom
A Triple Top forms when the price hits resistance three times but fails to break through, signaling a potential downtrend.
Conversely, a Triple Bottom occurs when the price bounces off support three times, strengthening the probability of an uptrend.
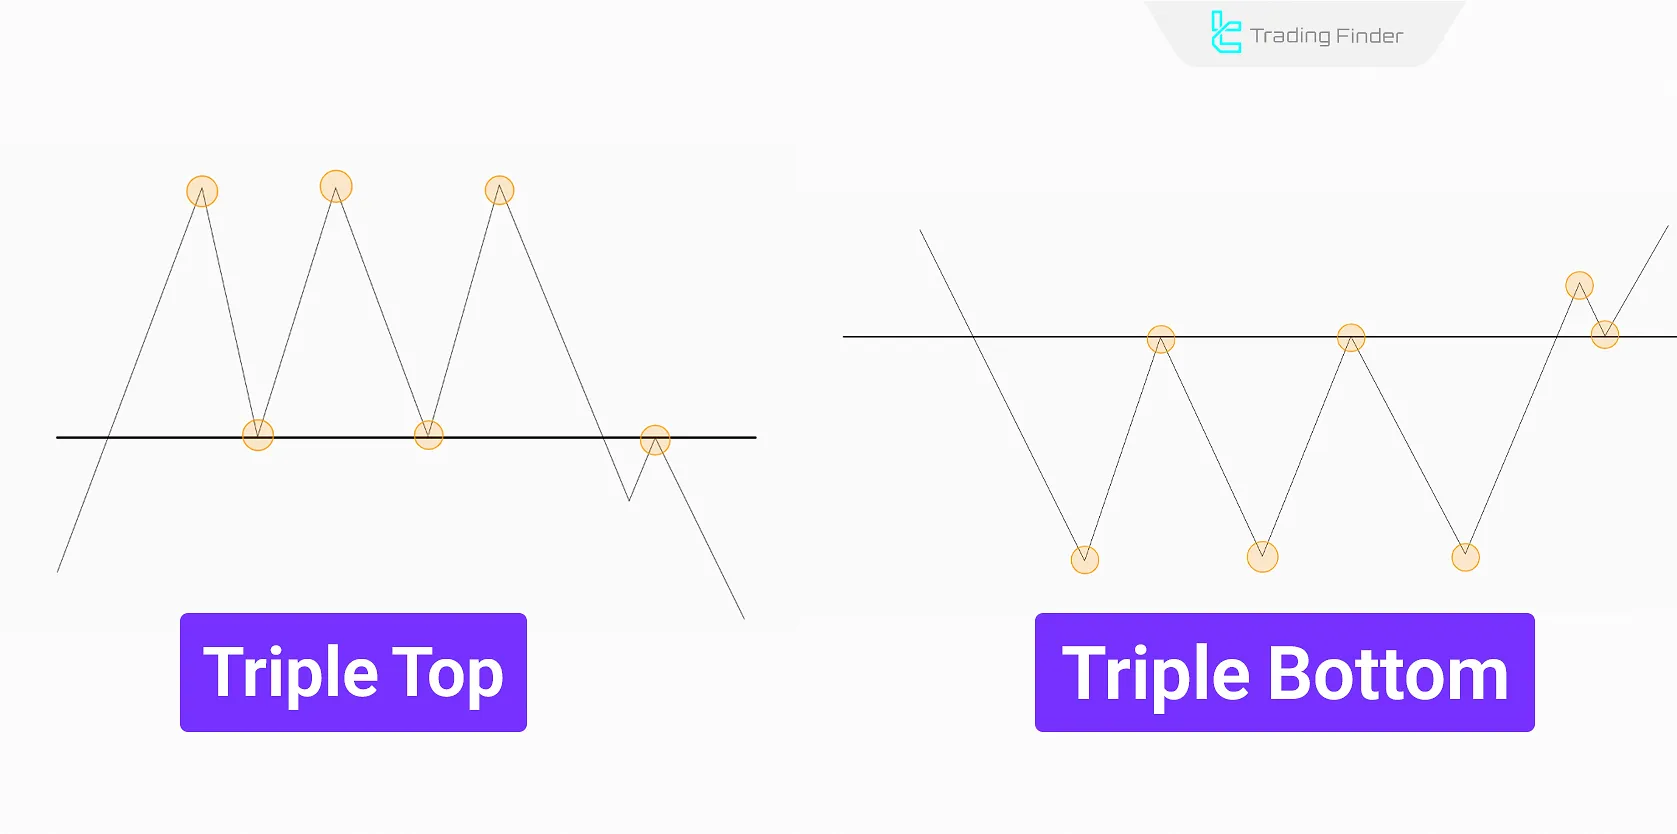
The pattern is more prominent in medium to long term timeframes (H4, Daily, Weekly), as price requires multiple attempts to breach support or resistance.
In this pattern, with each retest of the highs or lows, market volume decreases; usually, at the third high or low, the volume is much lower than at the first.
If the breakout of the support line in this pattern occurs with low volume, there is a possibility of a false breakout and a return of the price to the previous trend.
Rounding Bottom & Rounding Top
A Rounding Bottom appears as a gradual downward movement that slowly turns upward, forming a semi-circular shape at the bottom, indicating an uptrend.
A Rounding Top forms a smooth arc at the peak of a price movement, signaling a downtrend.
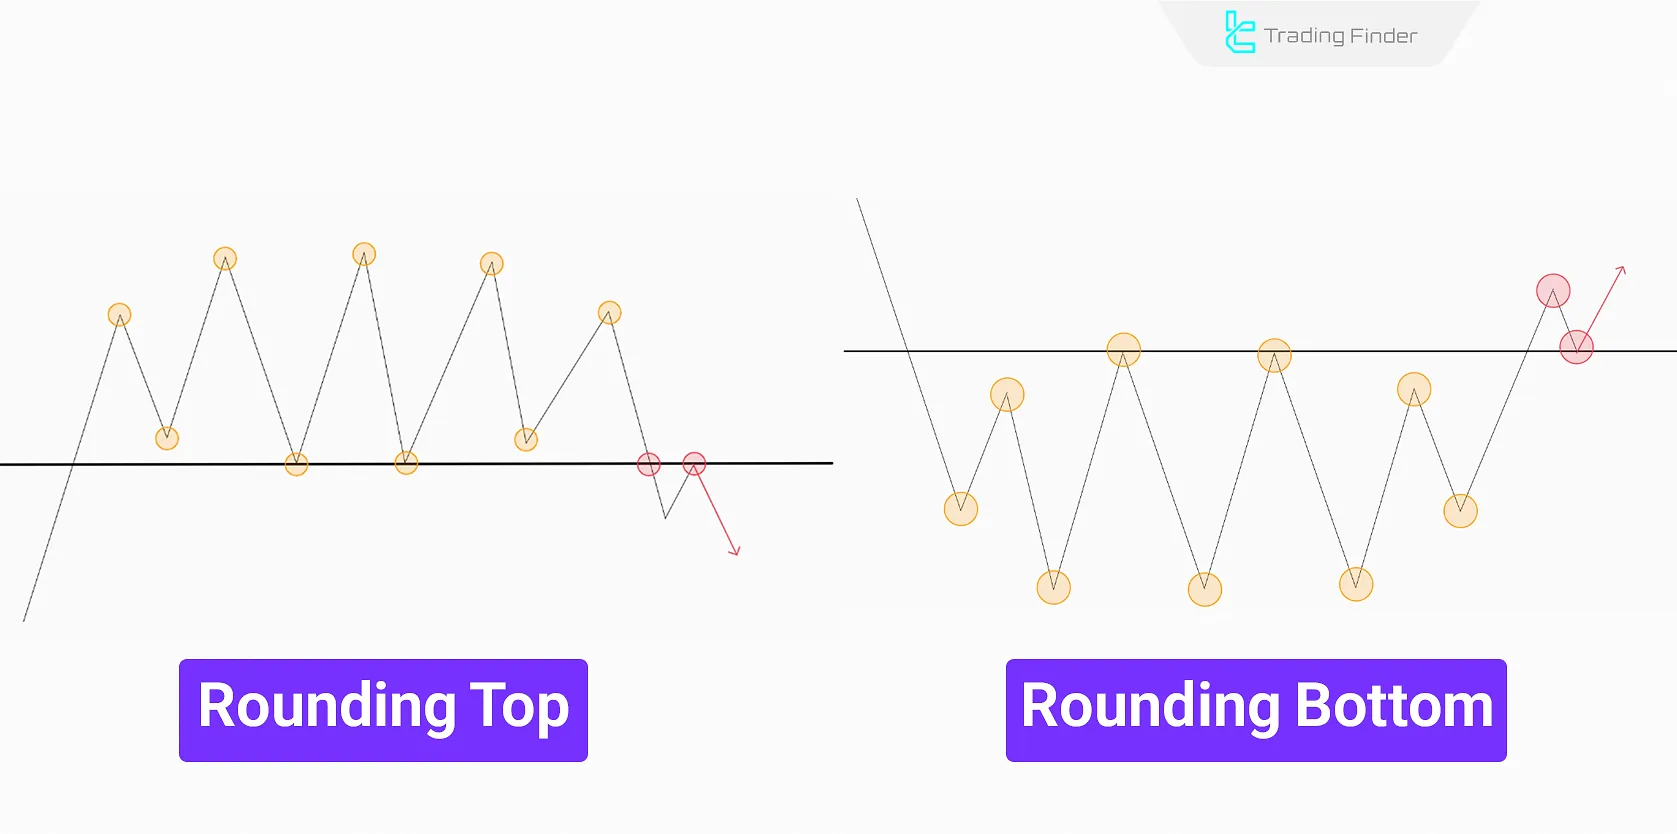
Due to their slow formation, these patterns typically appear in long term timeframes (Daily and Weekly).
In this pattern, there is no specific peak or trough; instead, a wide curved zone forms.
In the rounding top and bottom pattern, the volume of the current trend gradually decreases, and at the end, the volume of the opposite trend suddenly increases with the breakout of the support or resistance zone.
This type of structure is identified in analysis as a rounding top pattern and also as a rounding top and bottom pattern. In practice, rounded top pattern trading is also used to identify trend reversals.
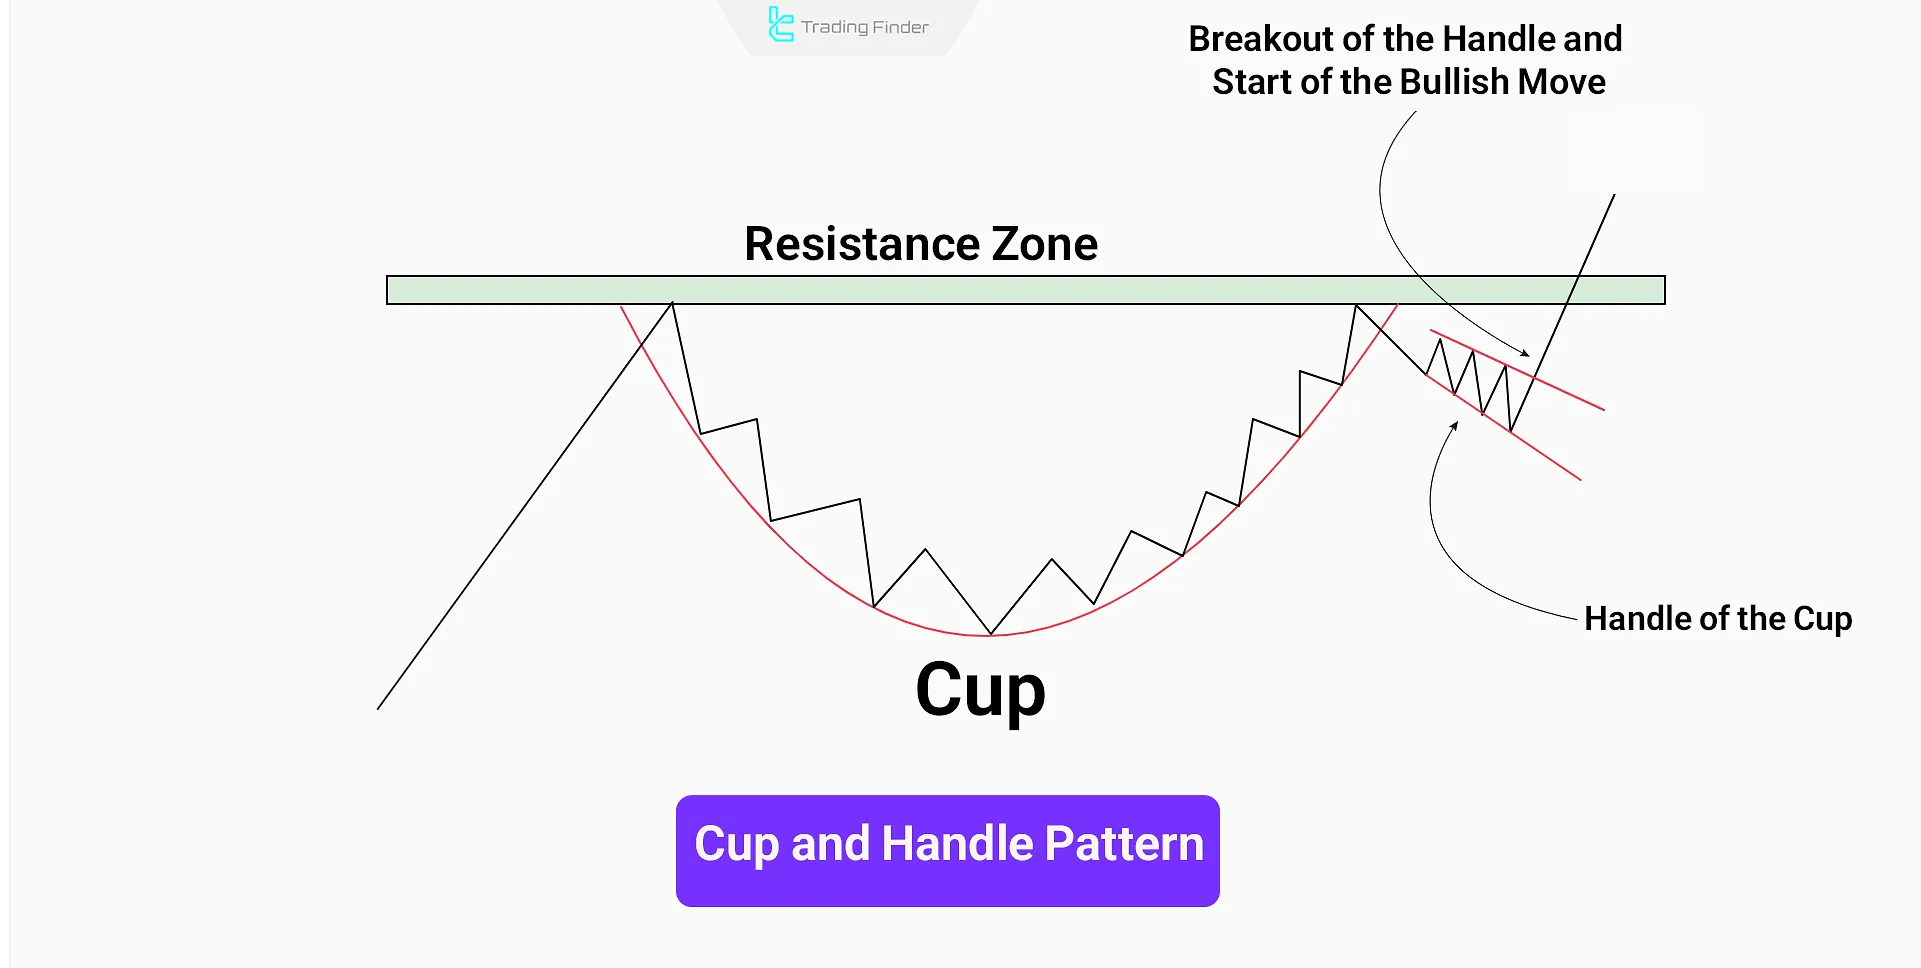
Cup and Handle Pattern
The Cup and Handle is one of the advanced bullish classical patterns. This pattern usually forms after a downtrend and indicates a gradual shift in market sentiment from selling to buying.
The “cup” forms a rounded trough shape, while the “handle” appears as a short-term correction or small flag on the right side.
A breakout above the handle signals the beginning of a new uptrend; this pattern has a special place particularly in classical chart patterns.
For stop-loss, the bottom of the handle is usually considered, and profit targets are determined using the depth of the cup as a measuring metric.
Continuation Patterns
Continuation classic patterns indicate the continuation of the trend after a short correction.
Flag
The Flag pattern is a short-term continuation pattern that forms after a substantial price movement (flagpole).
It consists of a small channel moving in the opposite direction of the primary trend and breaks out in the direction of the previous trend.
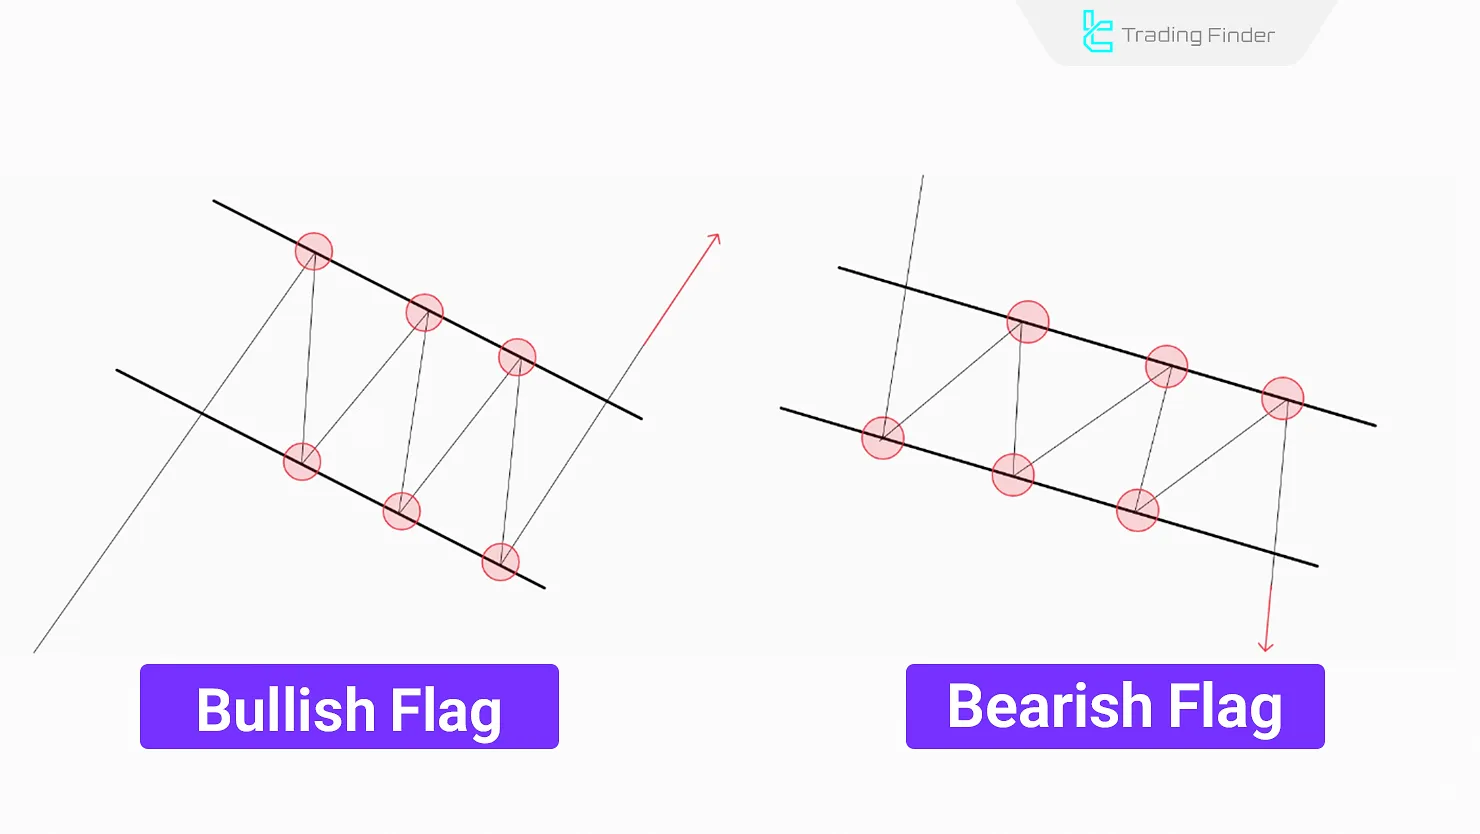
The Flag pattern is most useful for scalping and day trading in short to medium term timeframes (M5, M15, M30, H1).
After a sharp move, the price enters a short-term corrective zone that takes the shape of a small channel; during the formation of this channel, volume decreases.
In this pattern, the size of the flag should be smaller than the main move, ideally less than half of the size of the previous price movement.
Symmetrical Triangle
The Symmetrical Triangle is a continuation Classic chart pattern in which the price fluctuates within a narrowing range. It consists of two converging trendlines and usually leads to a breakout.
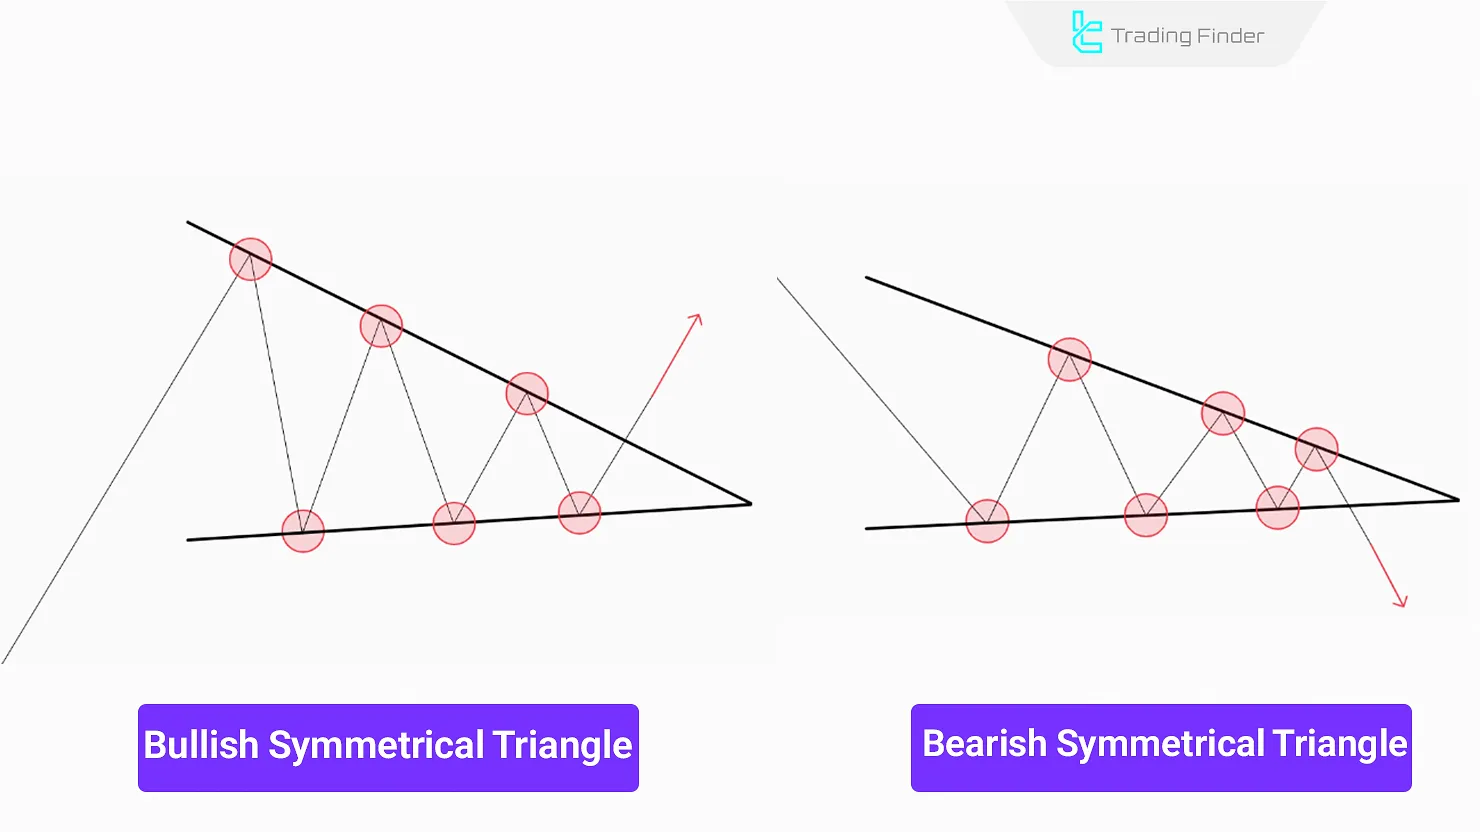
This pattern forms when both buying and selling volume decrease simultaneously, and the price enters a compressed zone.
In this compressed area, price fluctuations gradually diminish, with each high forming lower than the previous high and each low forming higher than the previous low.
In this pattern, the direction of the breakout cannot be predicted, and false breakouts may occur both in the trend’s direction and against it; the validity of the breakout is confirmed by changes in volume.
Ascending & Descending Triangle
An Ascending Triangle has a horizontal resistance and rising lows, often resulting in an upward breakout.
A Descending Triangle has a horizontal support and declining highs, signaling a potential downward breakout.
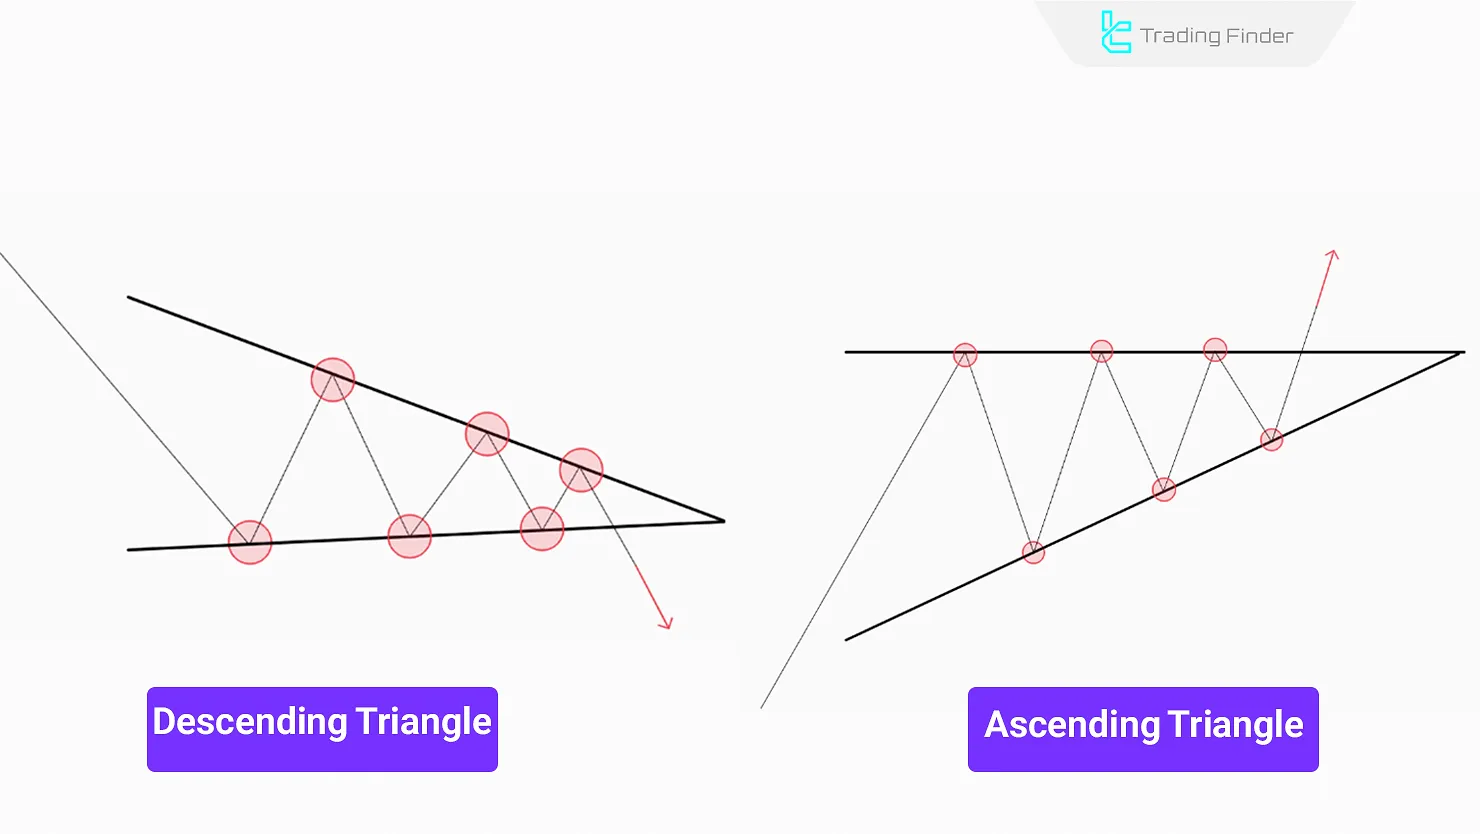
Although this pattern is classified as a continuation pattern, if the triangle breaks in the opposite direction of the price movement and order volume increases against the trend, the likelihood of a complete trend reversal is very high.
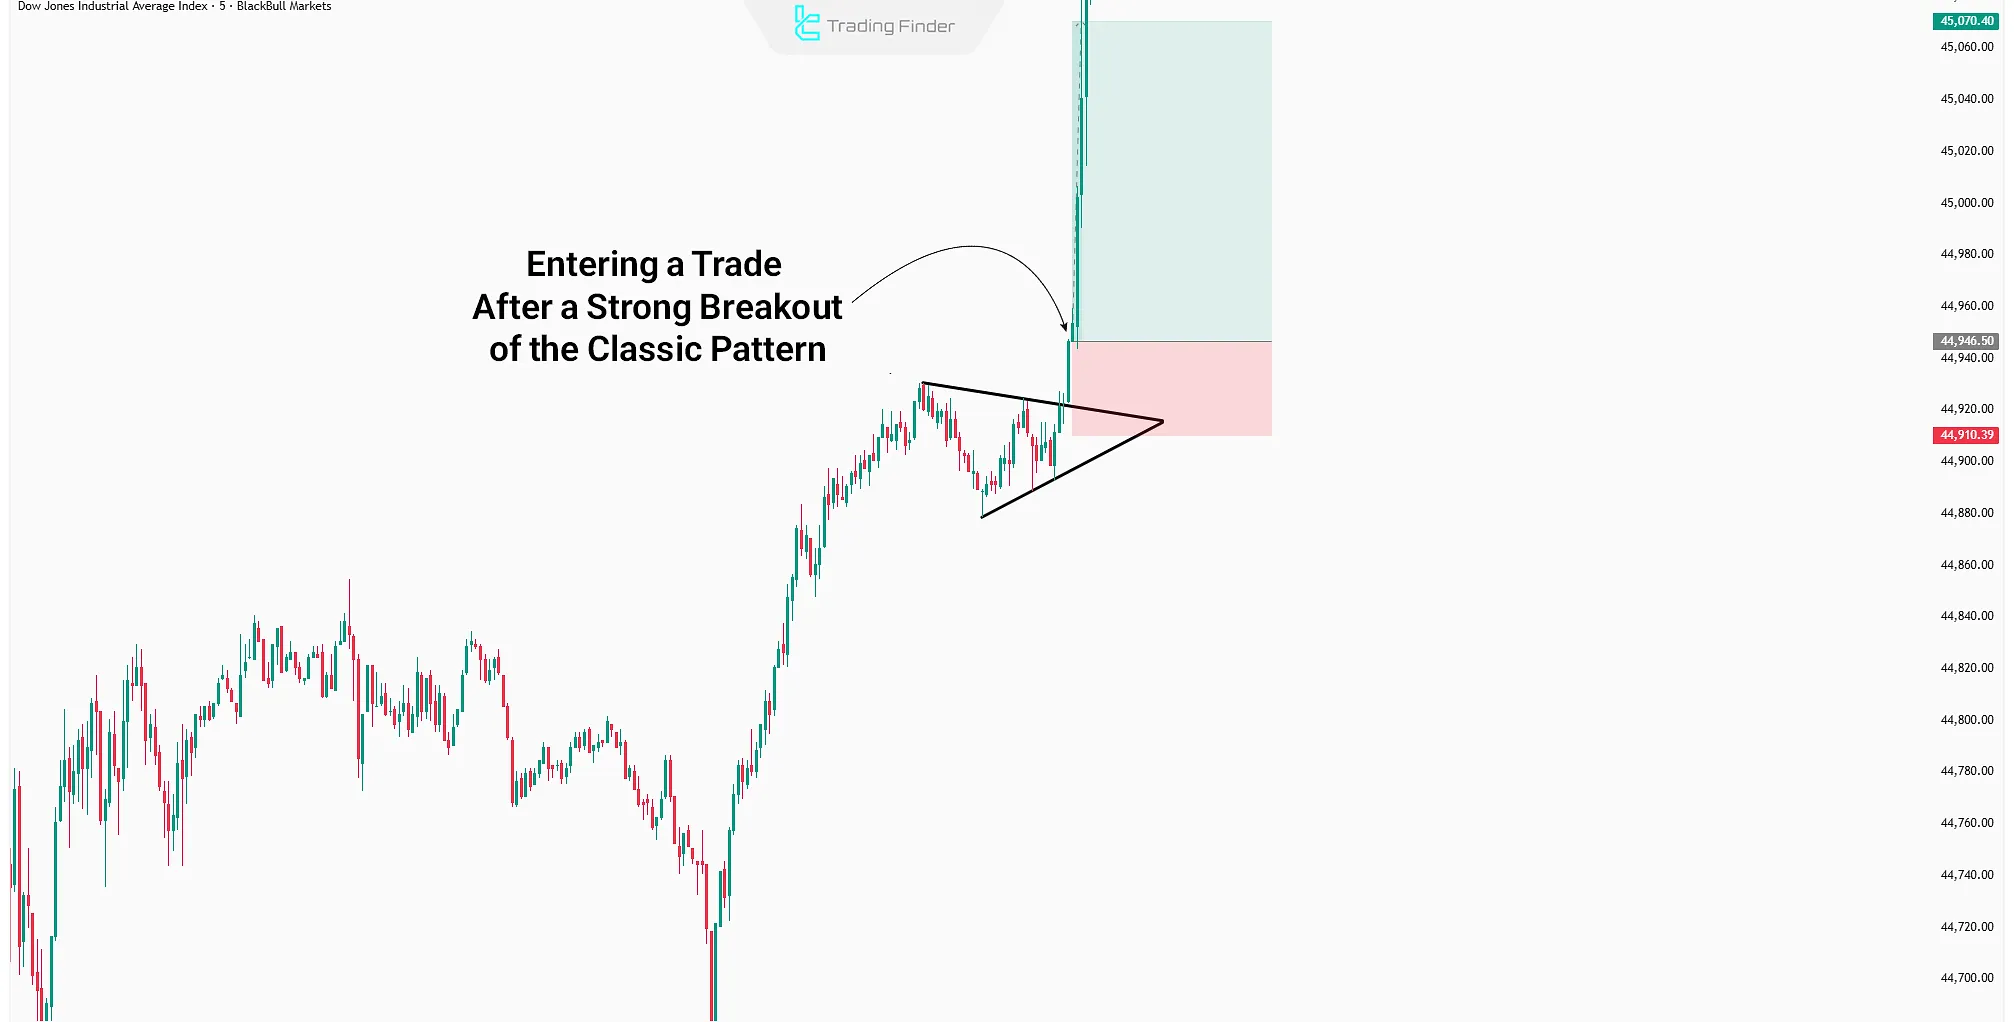
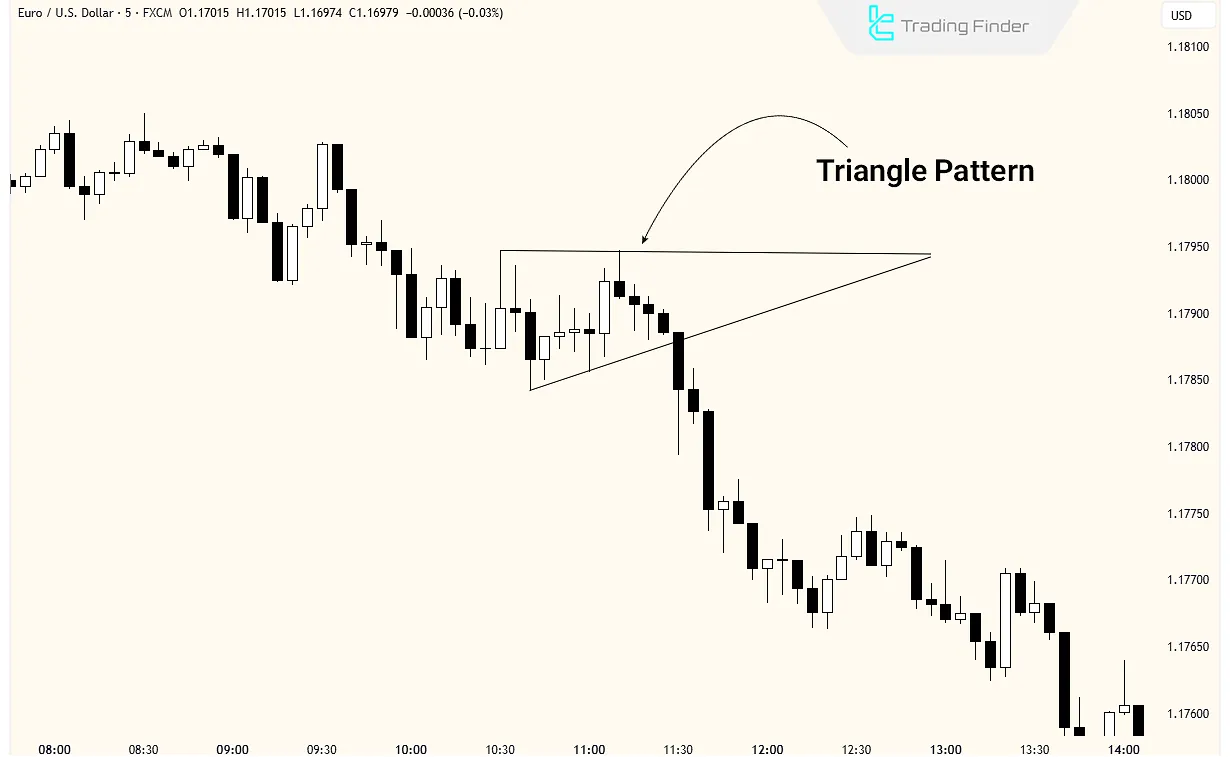
Example of Trading With Triangle Pattern
After a sharp move, the price enters a short-term corrective phase shaped like a small channel; during the formation of this channel, volume decreases.
This pattern forms when both buying and selling volume decrease simultaneously, and price enters a compressed space.
In this space, volatility gradually decreases, with each high lower than the previous high and each low higher than the previous low.
In this pattern, the direction of the breakout is unpredictable, and false breakouts may occur in either direction; the validity of the breakout is confirmed by volume changes.
Although this pattern is generally considered a continuation formation, if the triangle breaks in the opposite direction of the prior trend and order volume increases against the trend, a complete trend reversal is highly likely.
In fact, the symmetrical triangle pattern and reversal triangle are among the best-known types of this structure.
Wedges
Wedges include Rising Wedge and Falling Wedge, typically forming in high-momentum trends.
- Rising Wedge slopes upward and usually results in a bearish breakout
- Falling Wedge slopes downward and typically breaks out bullish
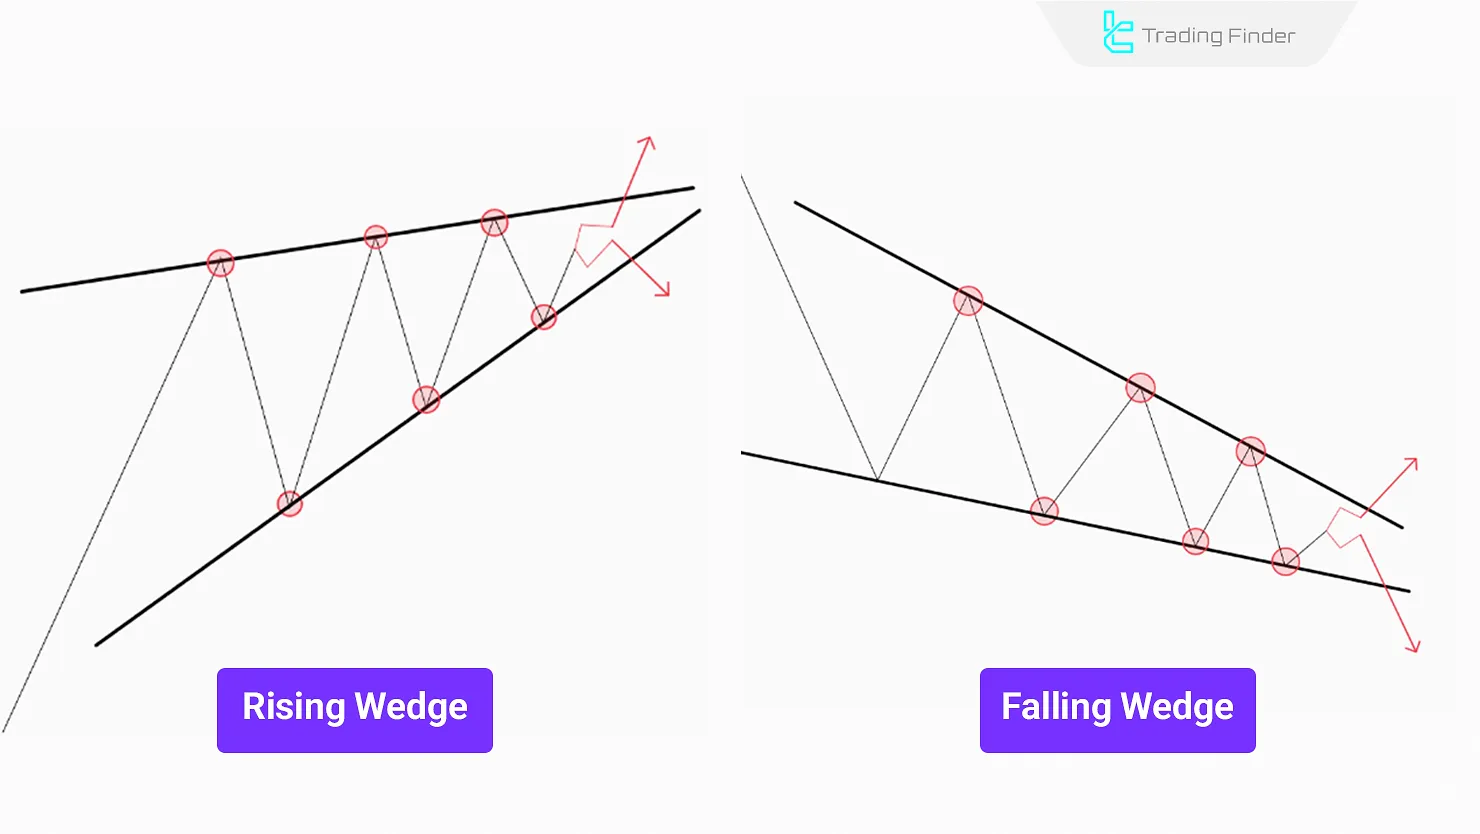
In this rising wedge, the slope of the resistance line is steeper than the support line, and in the falling wedge, the slope of the resistance line is less than the support line.
wedge patterns can act as reversal or continuation structures. In addition, comparing the falling wedge vs descending triangle is one of the key discussions in this category.
Rectangle
The Rectangle pattern indicates sideways price movement where the price oscillates between support and resistance before breaking out.
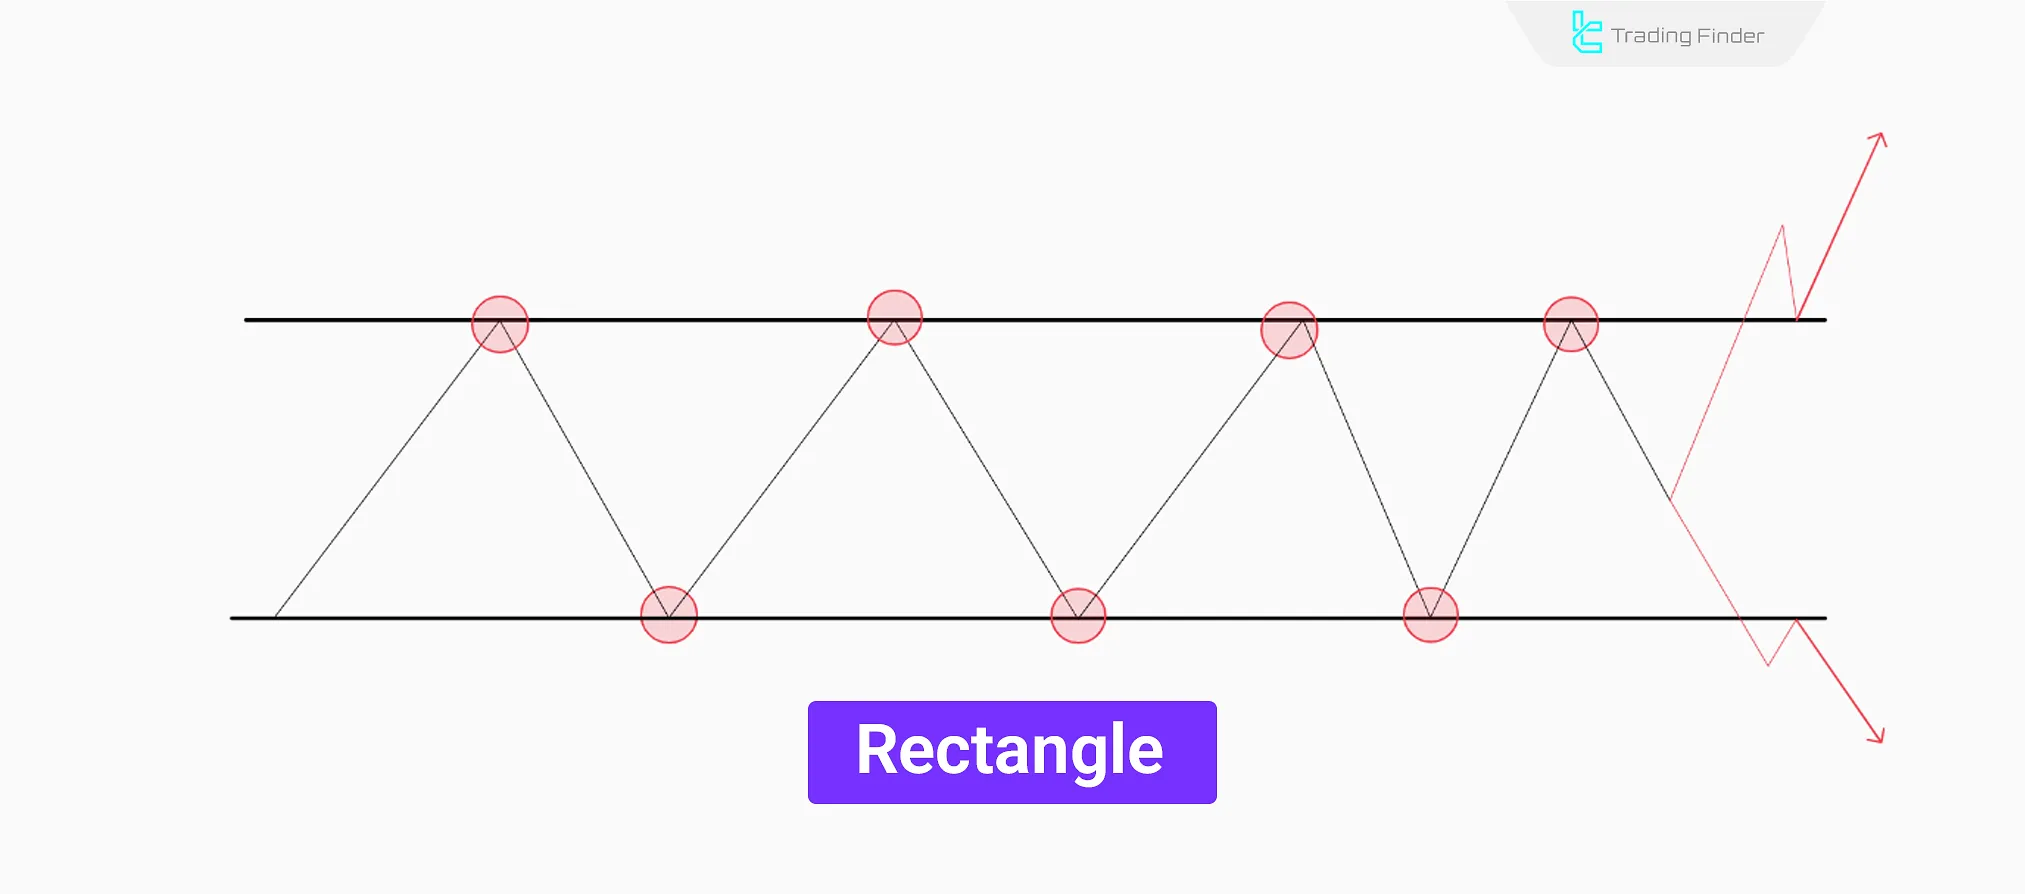
In this pattern, highs and lows form almost within a fixed range and move without a clear direction.
In this structure, trading volume gradually decreases, and upon breakout, there is a sudden increase in volume, the amount of which determines the validity of the breakout and the pattern.
In specialized training.
Application of Classical Patterns in Different Markets
Classical trading patterns are not limited to one market and are a practical concept across all financial markets, such as Forex, cryptocurrency, stocks, and more.
Classical patterns in Forex are mostly used to identify trend continuation or reversal in major currency pairs. Due to the high liquidity of this market, flag and triangle patterns form more clearly here.
These structures are usually provided in educational resources as reversal and continuation patterns pdf so that traders can have written and visual references for their strategies.
Classical patterns in the cryptocurrency market, due to the emotional behavior of investors, are more often formed as reversal patterns such as Double Top or Head and Shoulders.
For this reason, many educational resources, including classical pattern handbooks or brokerage analytical notes, have examined these structures across different markets.
In general, the repeatability of these patterns in all financial markets has led traders to consider them as one of the main tools of technical analysis.
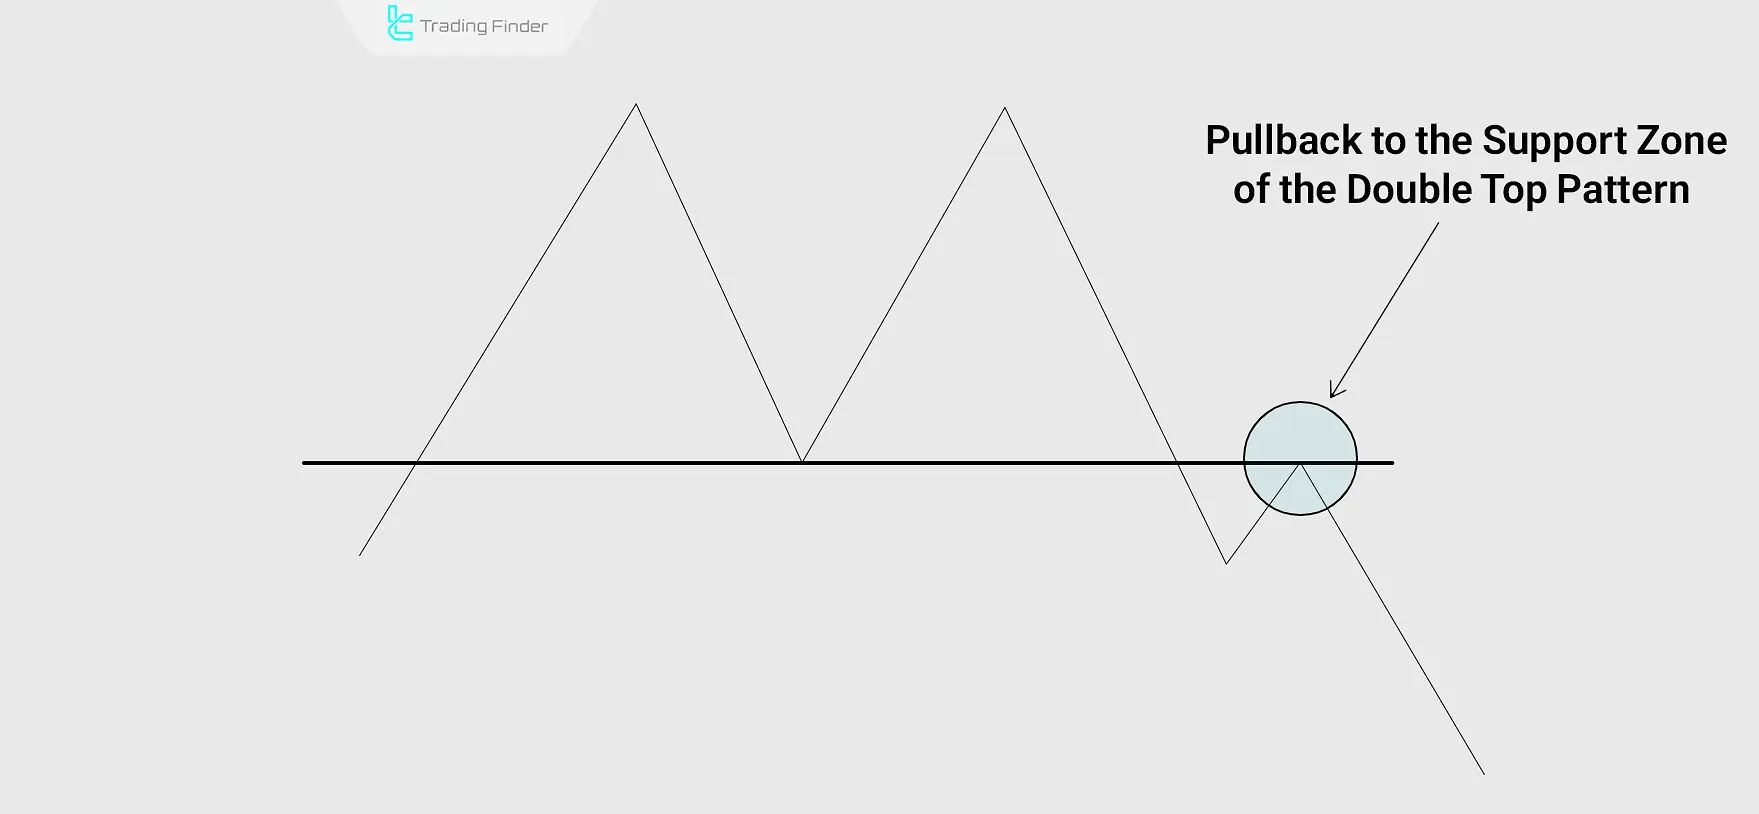
Pullback in Classical Patterns
In classical patterns, a pullback is a temporary return of price to a key broken level of the classical pattern.
After breaking an important level (such as the neckline of a Head and Shoulders pattern), the market requires confirmation of this breakout, which is done through a pullback.
Pullbacks are corrective in nature; during this move, both volume and momentum decrease, and the price movement slows down.
Pullbacks are most clearly observed in patterns such as the symmetrical triangle pattern or the double top and triple top pattern.
The price reaction to contact with the broken level indicates whether the movement is genuine or false.
A quick rebound confirms the breakout’s validity, while failure to react and penetration beyond the level (especially with price stabilization) signals weakness in the breakout.
Key Features of Pullback
Pullbacks occur with different behaviors in volume, candlestick formation, and momentum, which must be examined separately for proper identification.
Psychological Basis of Pullback
After a breakout, the market reaches a point of indecision; a place where both breakout-following traders and breakout-opposing traders attempt to influence market movement.
Traders who followed the breakout look for a better entry point and wait to enter after the pullback forms; in contrast, traders who entered against the breakout try to push the price back toward the pre-breakout path by increasing trading volume.
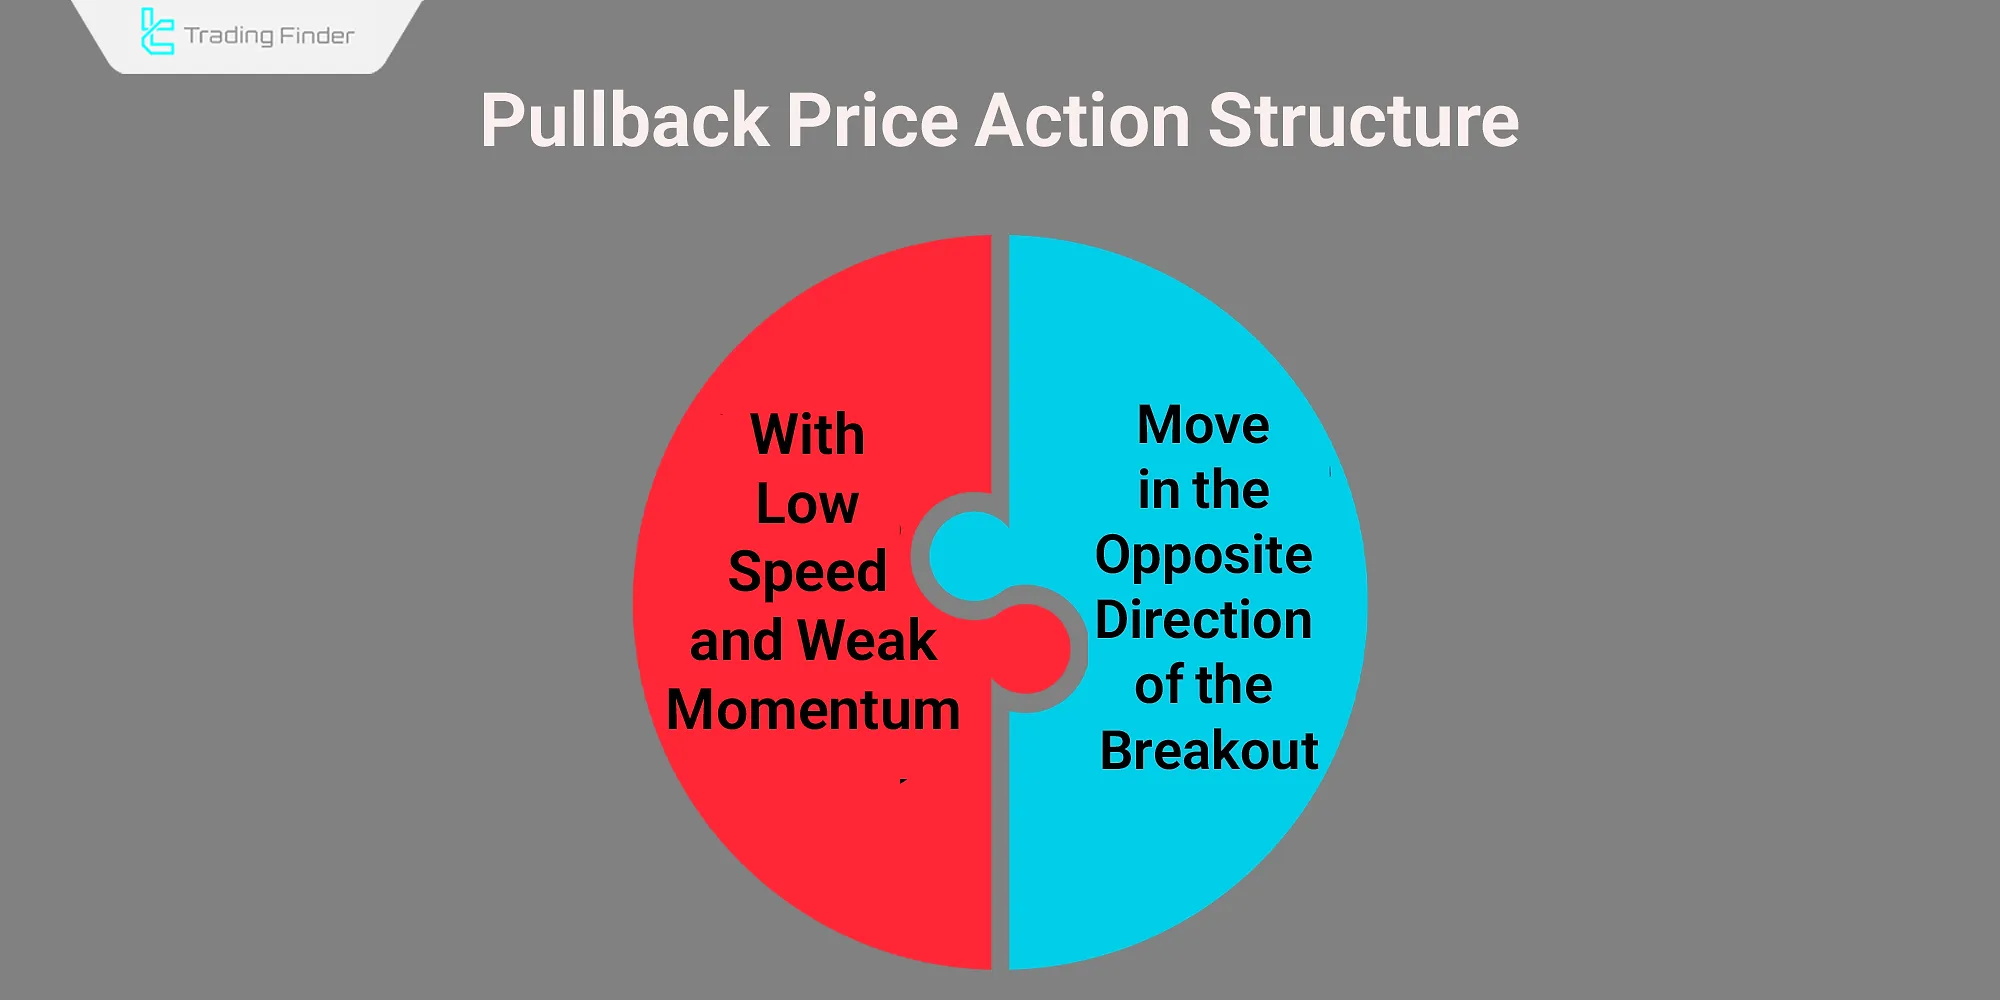
Pullback Price Action Structure
In classical patterns, a pullback has a corrective nature; during this move, volume and momentum decrease, and price movement slows down. The structure of price movement in a pullback has two important features:
- The move is in the opposite direction of the breakout;
- It is usually shorter, slower, and with weaker momentum compared to the main breakout move.
Pullback Timing
A delay in forming a pullback or a prolonged completion process indicates indecision or weakness in the initial breakout and increases the likelihood of a false breakout; effective pullbacks form relatively quickly.
Market Volume During Pullback
To assess the validity of a pullback and breakout, market volume behavior is analyzed:
- During the main breakout, there should be an increase in volume;
- During the pullback phase, volume should noticeably decrease;
- If pullback volume exceeds breakout volume, the likelihood of a false breakout increases.
Price Reaction to the Broken Level
The price reaction upon contact with the broken level indicates whether the price movement is false or genuine:
- A quick reaction to the broken level and price reversal confirms the validity of the breakout;
- Failure to reverse and penetration beyond the broken level, especially with price consolidation, signals weakness in the breakout.
Formation of Pullback Candlesticks
The way candlesticks form during a pullback reflects the behavior of buyers and sellers:
- Reversal candlesticks such as Pin Bar, Engulfing Bar, etc. in the pullback area confirm breakout validity;
- A candlestick with a long body and short shadow in the opposite direction of the breakout indicates weakness in breakout strength.
Measurement Rules for Classical Chart Patterns
To make the use of classical chart patterns more practical in trading, it is essential to understand how to calculate price targets after a breakout.
Each classic trading pattern follows a specific measurement method, which traders use to estimate the potential move of the market.
The following table summarizes the measurement rules and price targets for the most important classical trading patterns, including reversal and continuation formations such as the double top and triple top pattern, symmetrical triangle pattern, and the cup and handle.
Pattern Name | Measurement Method (Measured Move) | Price Target After Breakout |
Double Top / Double Bottom | Distance between the peaks or troughs and the neckline | The same distance projected from the breakout point of the neckline |
Head and Shoulders | Distance between the head (highest or lowest point) and the neckline | The same distance applied after the neckline breakout |
Flag (Reversal Flag Pattern) | The length of the flagpole from the start of the move to the beginning of the flag channel | The same length projected from the breakout point of the flag channel |
Triangle (Ascending Triangle Pattern, Descending Triangle Pattern, Symmetrical Triangle Pattern, Reversal Triangle) | Maximum height of the triangle (highest peak to lowest trough) | The same height measured from the triangle’s breakout point |
Diamond Pattern (compared with Falling Wedge vs Descending Triangle) | Maximum internal distance between peaks and troughs inside the diamond | The same distance projected from the breakout point of the support or resistance line |
Cup and Handle | Depth of the cup from the rim to the bottom | The same depth projected upward from the breakout of the handle |
Advantages and Disadvantages of Classic Patterns
These patterns, like all trading strategies, have their own advantages and disadvantages:
Advantages | Disadvantages |
Simple visual identification | Possibility of fake breakouts |
Usable in all financial markets | Requires confirmation with indicators and volume |
Compatible with other analysis tools | Delayed signal confirmation |
Enhancing Trend Identification with Classic Patterns
To identify strong trends, merely recognizing classic chart patterns is not enough; attention must also be given to how they form within the market liquidity flow.
Combining the analysis of highs and lows structure with candlestick behavior and trading volume can provide confirmatory signals for entering or exiting trades.
- Pattern Shape: Analyze how price forms highs and lows
- Candlestick Charts: Identify buyer/seller pressure
- Volume Analysis: Increasing volume on a breakout confirms the pattern
- Confirmation with Technical Indicators: Uses RSI, MACD, and Moving Averages
- Multiple Timeframe Analysis: Ensure reliability across different timeframes
Double Top & Double Bottom Indicator (DTDB)
The Double Top & Double Bottom (DTDB) indicator is a highly specialized tool designed to assist traders in automatically identifying two of the most well-known reversal formations in technical analysis.
Recognizing these structures manually can sometimes be challenging, especially in volatile markets, but the DTDB indicator simplifies this process by using advanced algorithms to detect pivot points and highlight potential reversal zones.
This indicator works by analyzing swing highs and lows, or pivot points, in the market and then outlining the corresponding price structures that resemble the Double Top or Double Bottom.
In practical trading platforms, the Double Top formation is displayed in blue, while the Double Bottom is shown in red, enabling traders to quickly and clearly distinguish between these two significant reversal signals without confusion.
This visual clarity is particularly beneficial for beginner traders, but even professional analysts appreciate the efficiency it brings to chart analysis.
Another major advantage of the DTDB indicator is its effectiveness across multiple timeframes.
In commonly used intraday timeframes such as the 1-hour or 4-hour charts, this tool provides a sharper and more detailed view of potential market turning points.
By highlighting these reversals early, the indicator allows traders to anticipate shifts in market sentiment and adjust their strategies accordingly.
When used in combination with price action analysis, the DTDB indicator becomes even more powerful.
For example, traders often confirm its signals by examining related classical structures such as the reversal triangle or the rounded top pattern trading. This layered approach adds credibility to trade setups and reduces the risk of false signals.
Additionally, integrating DTDB with support and resistance levels or momentum oscillators can further improve the accuracy of entries and exits.
Overall, the Double Top & Double Bottom indicator is not just a convenience tool but also a highly practical solution for traders aiming to identify and trade reversal opportunities consistently.
Its blend of automation, clarity, and compatibility with classical chart analysis makes it a valuable addition to the toolkit of anyone trading forex, stocks, or cryptocurrency markets.
- Double Top & Double Bottom Pattern Indicator Download for MT5
- Double Top & Double Bottom Pattern Indicator Download for MT4
Common Mistakes in Identifying Classical Patterns
One of the frequent mistakes in analyzing technical patterns is identifying breakouts too early; many traders enter positions before the confirmation candlestick closes and get trapped by false breakouts.
Recognizing and avoiding these errors is an essential part of trading classical patterns, especially when traders confuse the falling wedge vs descending triangle or the triple top and triple bottom pattern.
The most common mistakes include:
- Entering trades prematurely: many traders open positions before the confirmation candle closes and fall into the trap of false breakouts;
- Ignoring volume at breakout: volume must increase during a breakout; neglecting this factor reduces the reliability of the pattern;
- Using very low timeframes: lower timeframes contain a lot of noise, which can lead to errors in recognizing classic trading patterns.

Combining Classic Patterns with Common Indicators
Classic chart patterns frequently appear in all financial markets, but they have inherent weaknesses that can be mitigated by combining them with other trading strategies.
Using the RSI Indicator to Confirm Signals
The RSI indicator can be used alongside classic patterns to identify overbought and oversold zones. For example, if RSI is in the oversold zone and a Double Bottom pattern forms, the likelihood of a trend reversal increases.
Combining Classic Patterns with the MACD Indicator
The MACD indicator helps confirm the breakout of classic chart patterns by analyzing divergence and convergence. If a Head and Shoulders bearish breakout aligns with a MACD bearish crossover, the probability of continued price decline strengthens.
Conclusion
Classic patterns include Reversal Patterns (e.g., Head and Shoulders and Double Top/Bottom) and Continuation Patterns (e.g., Flags, Triangles, and Wedges).
Combining the patterns with candlestick analysis, volume indicators, and momentum tools like RSI and MACD enhances accuracy and reduces false signals.


