


Technical analysis relies on historical price and volume data to forecast future market movements.
This method focuses on price behavior and employs various tools, including price patterns, trendlines and channels, indicators, and support and resistance levels.
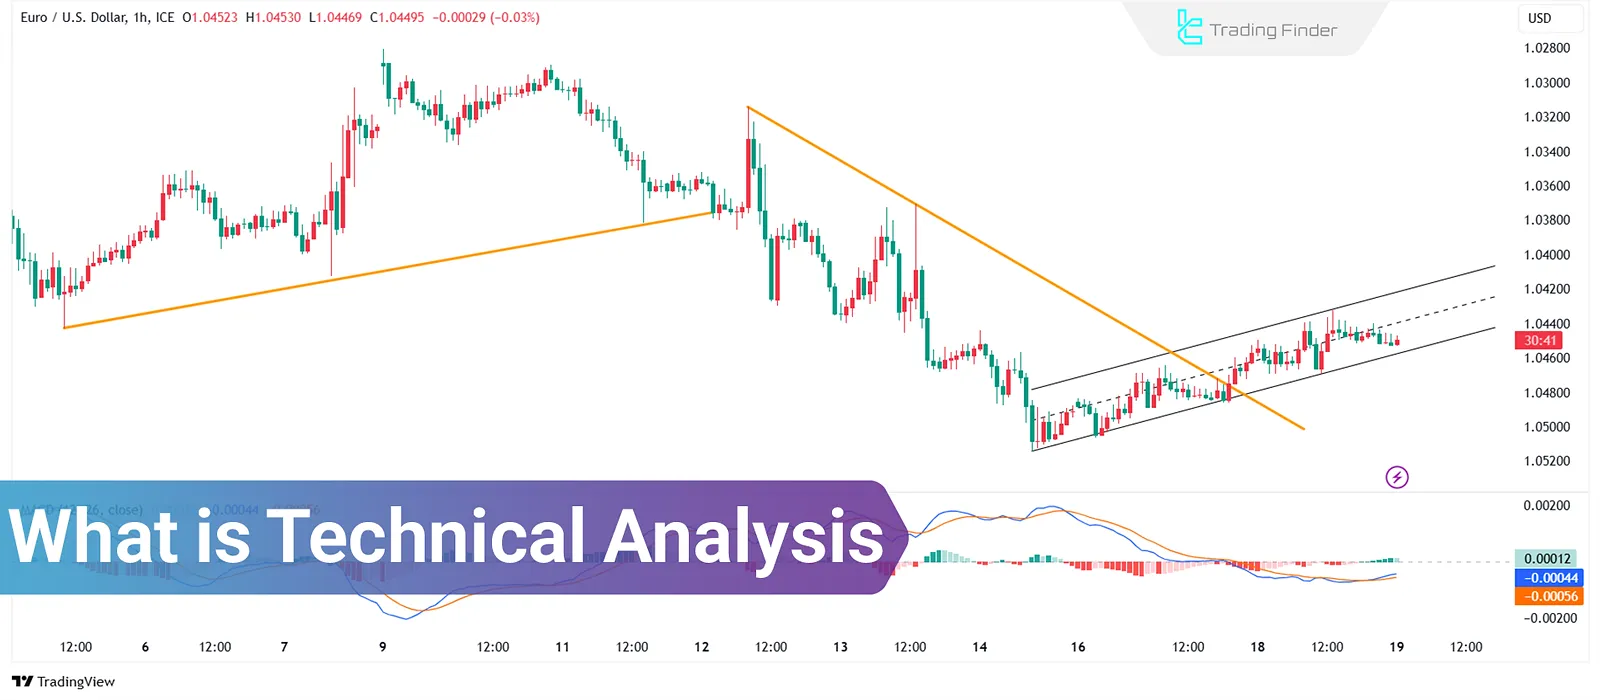
What Is Technical Analysis and What Is It Used For?
Technical analysis is a data-driven approach to studying asset price changes and forecasting market trends, based on the analysis of price charts, volume fluctuations, and historical market patterns.
It assumes that all information affecting the price is reflected in past data and price behavior.
This method is applicable in various financial markets, including Forex Market, cryptocurrencies, stock markets, and commodities.
Technical analysis combines price patterns, indicators, trendlines, and support/resistance concepts to assess future price movements probabilistically.
Advantages and Disadvantages of Technical Analysis
Classical technical analysis enables traders to identify optimal entry and exit points, enhance risk management, and better evaluate price trends. However, it also has drawbacks. Technical analysispros and cons:
Advantages | Disadvantages |
Predicting price trends using patterns and indicators | Potential for false signals due to reliance on past data |
Quick decision-making across multiple timeframes | Ineffectiveness in low-volatility, illiquid markets |
Broad applicability across Forex, stocks, crypto, and commodities | Susceptibility to trader emotions and impulsive decisions |
No need for fundamental data, focus on price behavior | Requires deep experience and knowledge to accurately interpret signals |
Can be combined with other methods like price action and smart money analysis | - |
Core Principles of Classical Technical Analysis
Classical technical analysis is founded on concepts that allow traders to deeply understand market dynamics:
- Understanding price structures
- Analyzing reversal and continuation patterns
- Support and resistance levels
Price Patterns and Market Behavior
Price patterns reflect the collective psychology of traders and are divided into two main categories:
- Reversal Patterns: These indicate a potential trend change and include patterns like double tops/bottoms, head and shoulders, and V-shaped formations. These can help identify key turning points based on price data;
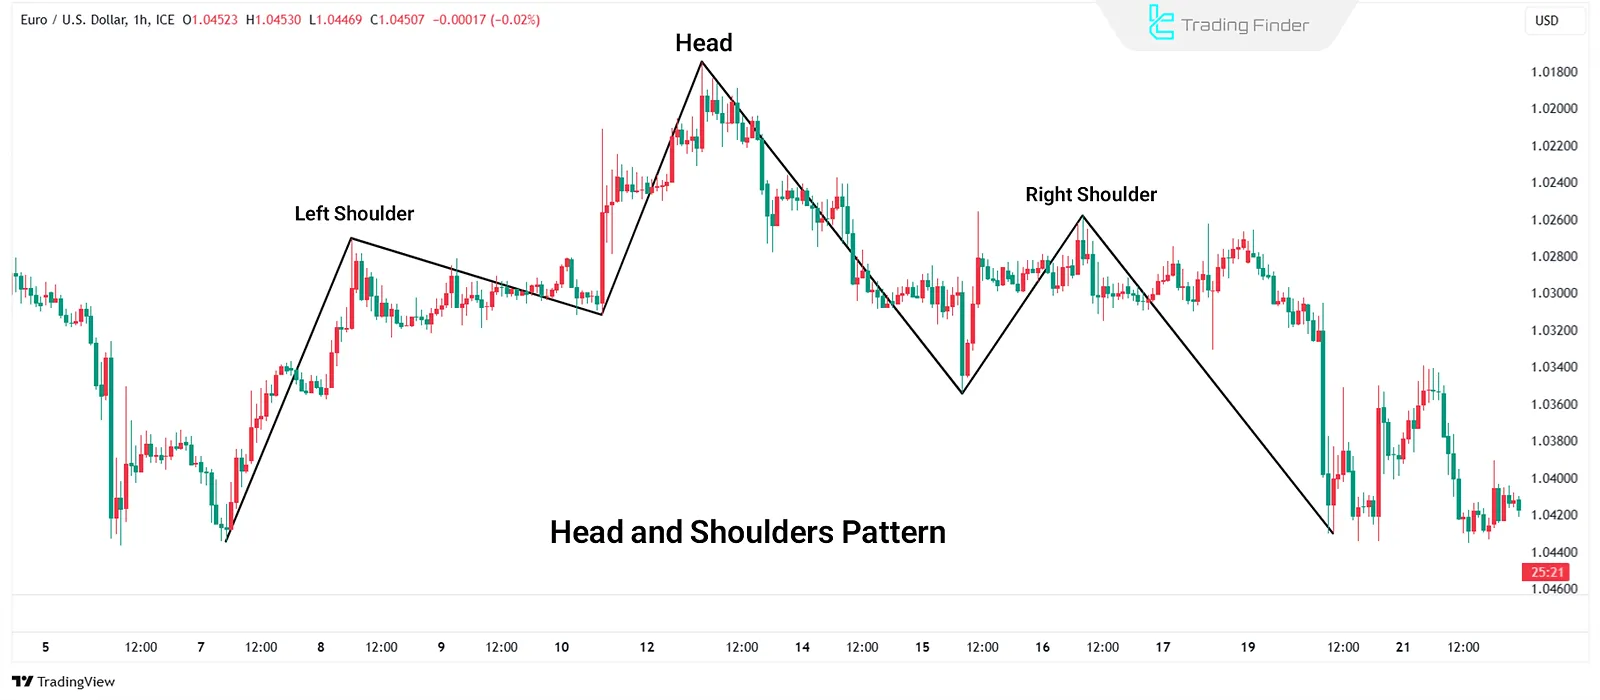
Reversal patterns are a core component of classical technical analysis to detect trend changes - Continuation Patterns: These signify the continuation of an existing trend and include patterns like triangles, flags, and rectangles. Identifying these allows traders to enter trades in the direction of the prevailing trend.
Trendlines and Price Channels
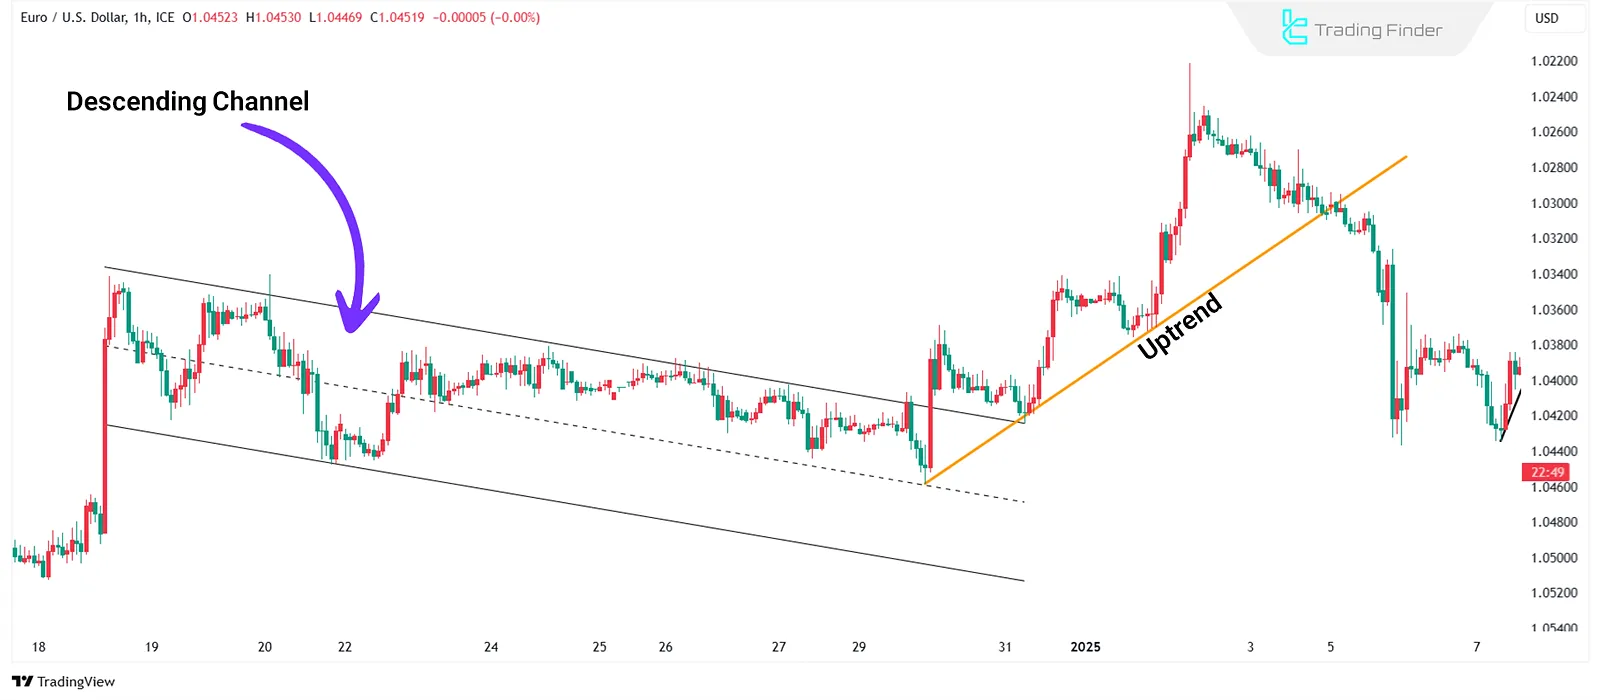
Trendlines determine the general direction of market movement. Uptrends are marked by higher highs and higher lows, while downtrends are characterized by lower highs and lower lows.
In contrast, range-bound markets lack a clear trend, and prices oscillate within a defined range.
A price channel forms when prices fluctuate between two parallel lines, which often act as dynamic support and resistance levels.
These tools help identify trend direction, retracement levels, and potential breakout points.
Support and Resistance in Technical Analysis
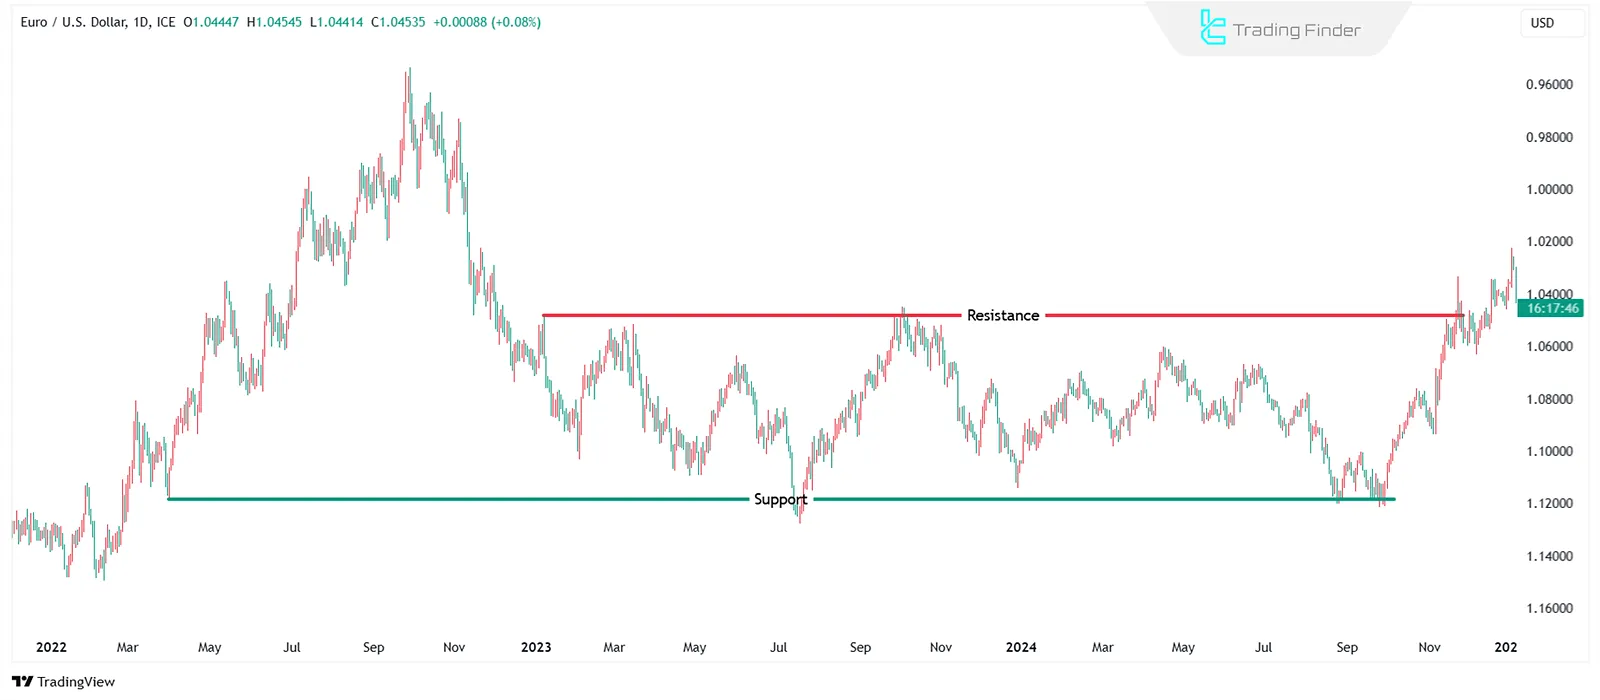
Support and resistance levels represent zones where supply and demand dynamics shift.
Support is where demandincreases and prevents further decline, while resistance is where supplyincreases and restricts price rise.
These levels are used to identify entry and exit points. In classical technical analysis, support and resistance play a crucial role in defining price structure and identifying valid breakouts.
Key Tools in Technical Analysis
To analyze price charts and determine market direction, several tools are essential:
- Indicators
- Moving averages
- Volume
Classical Indicators and Their Application
Indicators are tools used in technical analysis to evaluate trend strength, assess volatility, and identify potential entry and exit points. Best Classical indicators:
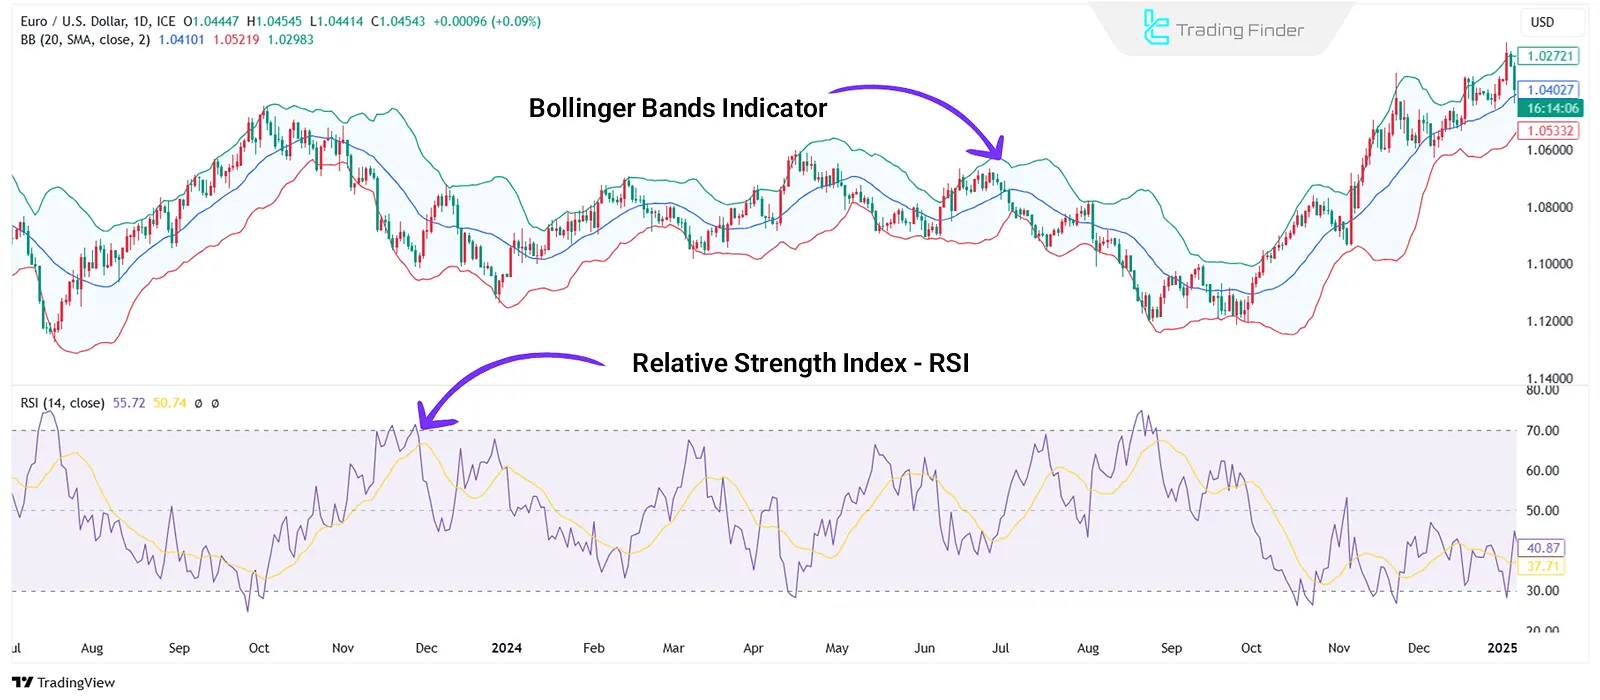
- Relative Strength Index (RSI): Measures overbought/oversold conditions;
- Moving Average Convergence Divergence (MACD): Analyzes momentum and trend reversal signals;
- Harmonic pattern indicators: Used to identify and draw harmonic patterns like Gartley, Bat, and Butterfly;
- Bollinger Bands: Identify unusual market volatility.
Moving Averages and Trend Identification
Moving averages play a vital role in identifying price trends and offer a clearer view of overall market direction by filtering short-term price fluctuations. Typesofmoving averages:
- Simple Moving Average (SMA): Calculates the average price over a specific period and is useful for identifying long-term trends. Price above SMA, signals an uptrend; below SMA, it suggests a downtrend;
- Exponential Moving Average (EMA): Gives more weight to recent prices and reacts faster to market changes, making it suitable for short-term and scalping strategies.
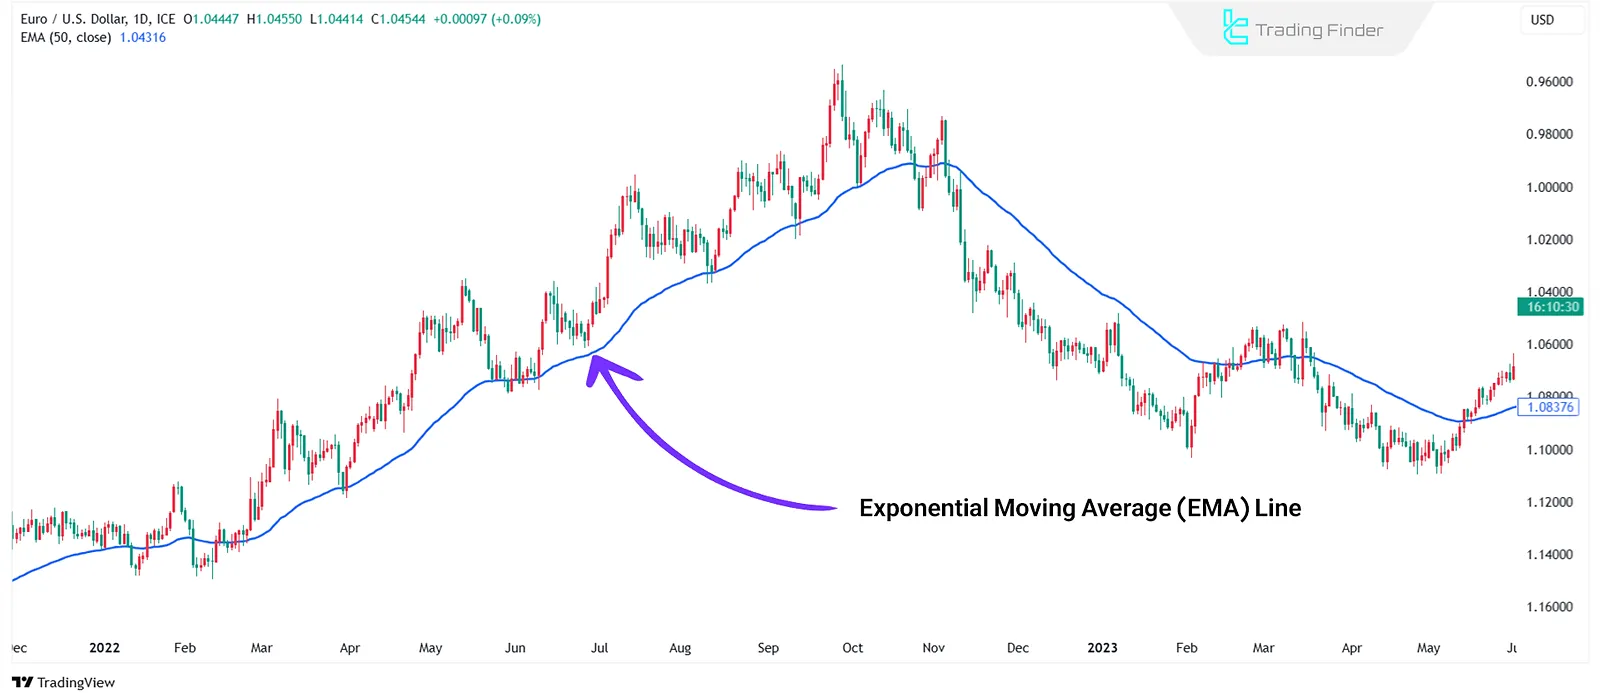
Both types of moving averages can act as dynamic support/resistance levels and offer more precise signals when combined with other tools.
Volume and Its Role in Technical Analysis
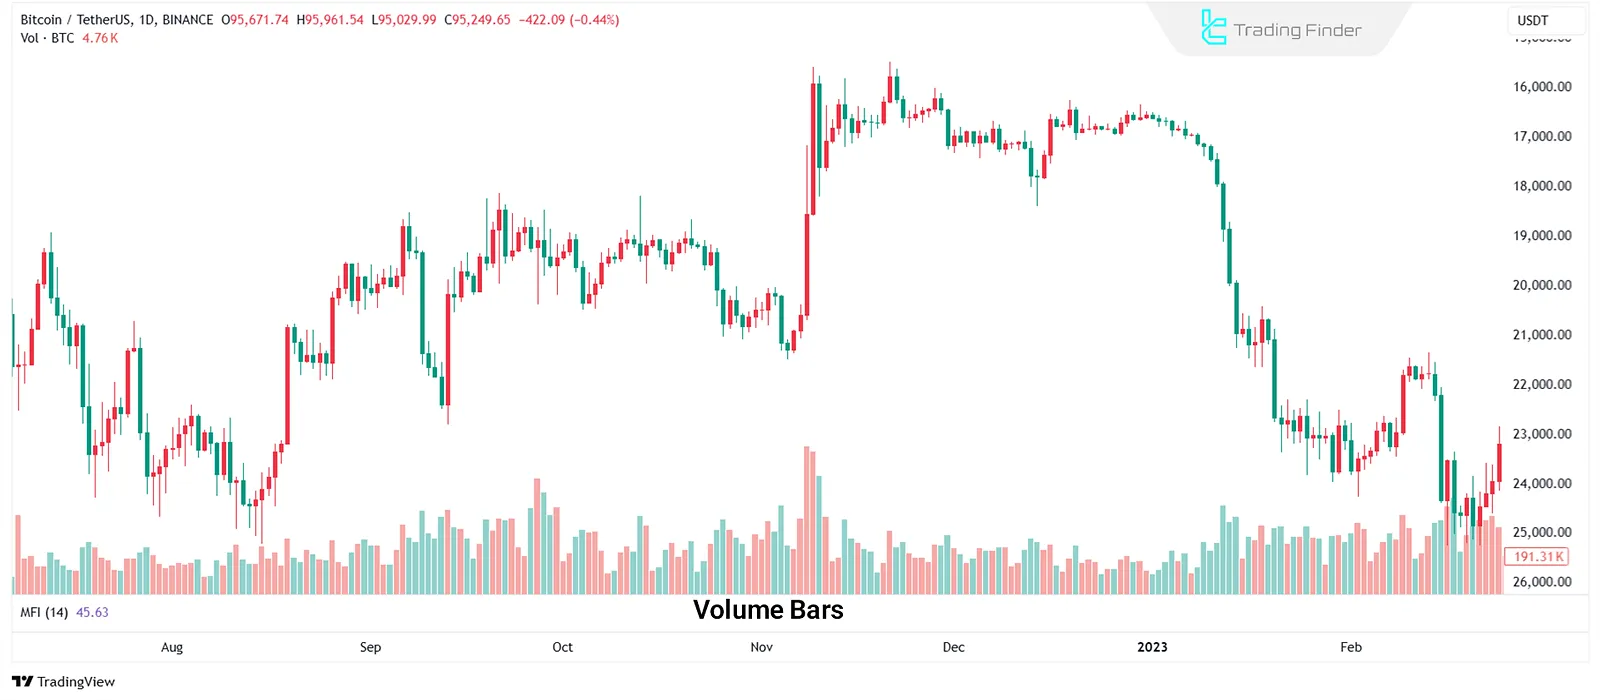
Volume is a key metric for confirming trends and spotting market reversals. A volume increase during a breakout of key levels signals confirmation. Volume-related tools include:
- On-Balance Volume (OBV): Analyzes the relationship between volume and pricetrend;
- Money Flow Index (MFI): Combines volume and pricemovement.
Classical Technical Analysis vs Other Analytical Styles
Classical technical analysis is based on statistical principles and repeating patterns, while other methods like Price Action, Smart Money, and ICT style focus on liquidity behavior, market structure, and price manipulation.
Technical vs Fundamental Analysis
Technical analysis focuses on price patterns and volume, whereas fundamental analysis assesses intrinsic asset value using economic indicators, company earnings, and interest rates.
Features | Technical Analysis | Fundamental Analysis |
Basis of Analysis | Price data, charts, and volume | Economic, financial factors and related news |
Main Objective | Predict short-term price movements and entry/exit points | Determine intrinsic asset value in the long term |
Tools Used | Indicators, chart patterns, trendlines, candlesticks | Financial reports, interest rates, inflation, company earnings, economic policy |
Timeframe | Short- to medium-term | Medium- to long-term |
Market Types | All financial markets (Forex, stocks, crypto, commodities) | Mainly stocks and national currencies |
News Sensitivity | Short-term reaction to news and price fluctuations | Long-term impact from economic/fundamental factors |
Application | Day trading, scalping, swing trading | Long-term investments and strategic analysis |
Classical Technical Analysis vs Price Action
Price Action focuses solely on raw price movements and avoids using indicators. In contrast, classical technical analysis employs various tools to determine market direction.
Features | Technical Analysis | Price Action |
Basis of Analysis | Price data, indicators, charts, volume | Raw price behavior and candlestick movements |
Main Objective | Forecast trends and entry/exit points with supportive tools | Understand price behavior and make decisions based on patterns |
Tools | Indicators (MACD, RSI, EMA), trendlines, chart patterns | Candlesticks, support/resistance, supply/demand zones |
Chart Presentation | Typically, with indicators and tools | Clean charts (no indicators) for direct observation |
Reaction Speed | Somewhat delayed due to reliance on indicators | Quick reaction to price changes |
Complexity Level | Suitable for all levels (beginner to advanced) | Requires deep market behavior understanding and practice |
Reaction Speed | Somewhat delayed due to reliance on indicators | Quick reaction to price changes |
Classical Technical Analysis vs Smart Money and ICT Styles
Classical technical analysis is based on studying past price data and chart patterns. In contrast, Smart Money and ICT (Inner Circle Trader) strategies focus on liquidity, institutional order flow, and marketmanipulation.
Features | Classical Technical Analysis | ICT & Smart Money Styles |
Basis of Analysis | Chart patterns, trendlines, support/resistance | Institutional behavior, market liquidity, market structure |
Main Objective | Predict price movements using repetitive patterns | Identify hidden liquidity and enter at key market turning points |
Tools | Indicators, chart patterns, support/resistance levels | Order blocks, liquidity zones, FVGs, ICT market models |
Chart Presentation | Price charts with indicators | Clean charts with focus on liquidity zones, order blocks, structural breaks |
Reaction Speed | Slower due to indicator lag | Fast response to key level breaks and liquidity zones |
Complexity Level | Suitable for all levels (beginner to advanced) | More complex, requiring deep understanding of market structure and institutions |
Usage | Short, medium, and long-term trades | Intraday, scalping, and precise swing trading |
Top Trading Strategies in Technical Analysis
Technical analysis is not only useful for identifying trends and key levels but also for developing diverse strategies for market entry and exit. Strategies are based on concepts like price patterns, indicators, volume, and price behavior.
Price Pattern Strategies
Price patterns are among the most effective tools in technical analysis. Common strategies include:
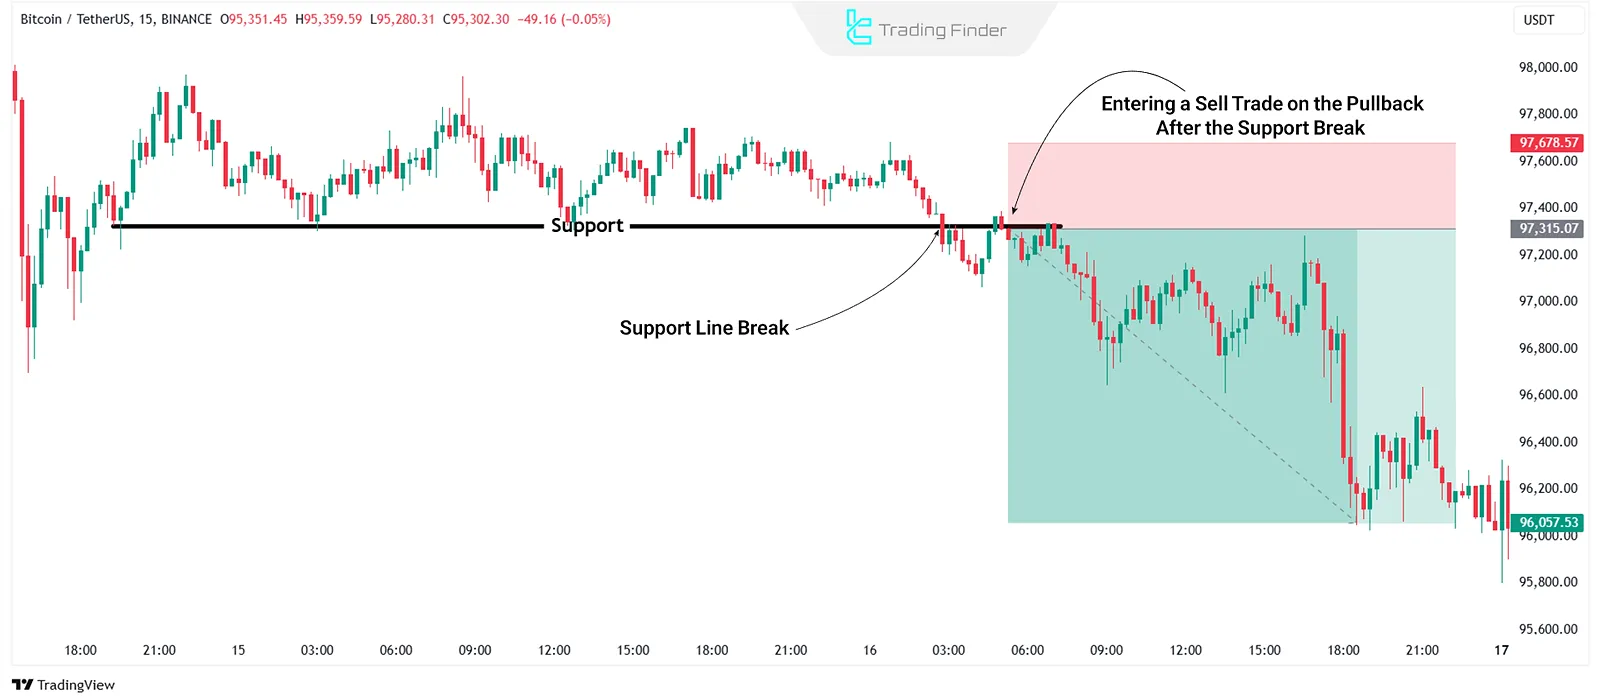
- Breakout Strategy: Traders wait for price to break key support/resistance levels and enter after confirmation;
- Reversal Strategy: Based on identifying reversal patterns like head and shoulders or double tops/bottoms;
- Range Trading Strategy: Effective in sideways markets where price oscillates within horizontal channels.
Risk Management and Stop Loss in Technical Analysis
Risk management and defining stop loss are essential in every strategy. Key techniques include:
- Stop Loss Based on Support/Resistance: Stops are set near key levels to exit if price breaks against the trade;
- Using ATR (Average True Range): Helps place dynamic stop loss based on market volatility;
- Risk/Reward Ratio: A favorable ratio (e.g., 1:2 or more) ensures long-term profitability.
Conclusion
Classical technical analysis offers a structured framework for identifying market trends and key levels.
Through tools like price patterns, indicators, moving averages, and volume, traders can build various strategies such as breakout, and reversal strategies.
However, to improve accuracy and reduce analytical errors, traders should also consider complementary factors like price zones, liquidity, and institutional behavior.
Integrating these with classical methods enables a deeper understanding of market structure and better decision-making.


