![CHT Value Chart Indicator for MetaTrader 4 Download - Free - [TFlab]](https://cdn.tradingfinder.com/image/199432/4-42-en-cht-value-chart-mt4-1.webp)
![CHT Value Chart Indicator for MetaTrader 4 Download - Free - [TFlab] 0](https://cdn.tradingfinder.com/image/199432/4-42-en-cht-value-chart-mt4-1.webp)
![CHT Value Chart Indicator for MetaTrader 4 Download - Free - [TFlab] 1](https://cdn.tradingfinder.com/image/199431/4-42-en-cht-value-chart-mt4-2.webp)
![CHT Value Chart Indicator for MetaTrader 4 Download - Free - [TFlab] 2](https://cdn.tradingfinder.com/image/199419/4-42-en-cht-value-chart-mt4-3.webp)
![CHT Value Chart Indicator for MetaTrader 4 Download - Free - [TFlab] 3](https://cdn.tradingfinder.com/image/199430/4-42-en-cht-value-chart-mt4-4.webp)
The CHT Value Chart indicator is one of the useful tools inMetaTrader 4 indicators, providing a value chart to help traders identify overbought and oversold conditions.
This indicator displays price information using colored bars or candles in the oscillator window, identifying potential price reversal points.
CHT Value Chart Indicator Table
The table below describes the general specifications of the indicator:
Indicator Categories: | Oscillators MT4 Indicators Currency Strength MT4 Indicators Trading Assist MT4 Indicators |
Platforms: | MetaTrader 4 Indicators |
Trading Skills: | Intermediate |
Indicator Types: | Leading MT4 Indicators Reversal MT4 Indicators |
Timeframe: | Daily & Weekly Timeframe MT4 Indicators |
Trading Style: | Intraday MT4 Indicators |
Trading Instruments: | Share Stocks MT4 Indicators Forward Market MT4 Indicators Stock Market MT4 Indicators Cryptocurrency MT4 Indicators Forex MT4 Indicators |
Overview of the Indicator
When the chart bars reach the upper lines (Overbought) or lower lines (Oversold), the likelihood of a Trend Reversal increases. This oscillator divides the overbought and oversold areas into five sections in the chart’s lower window to determine the intensity of the price reversal area.
Indicator in an Uptrend
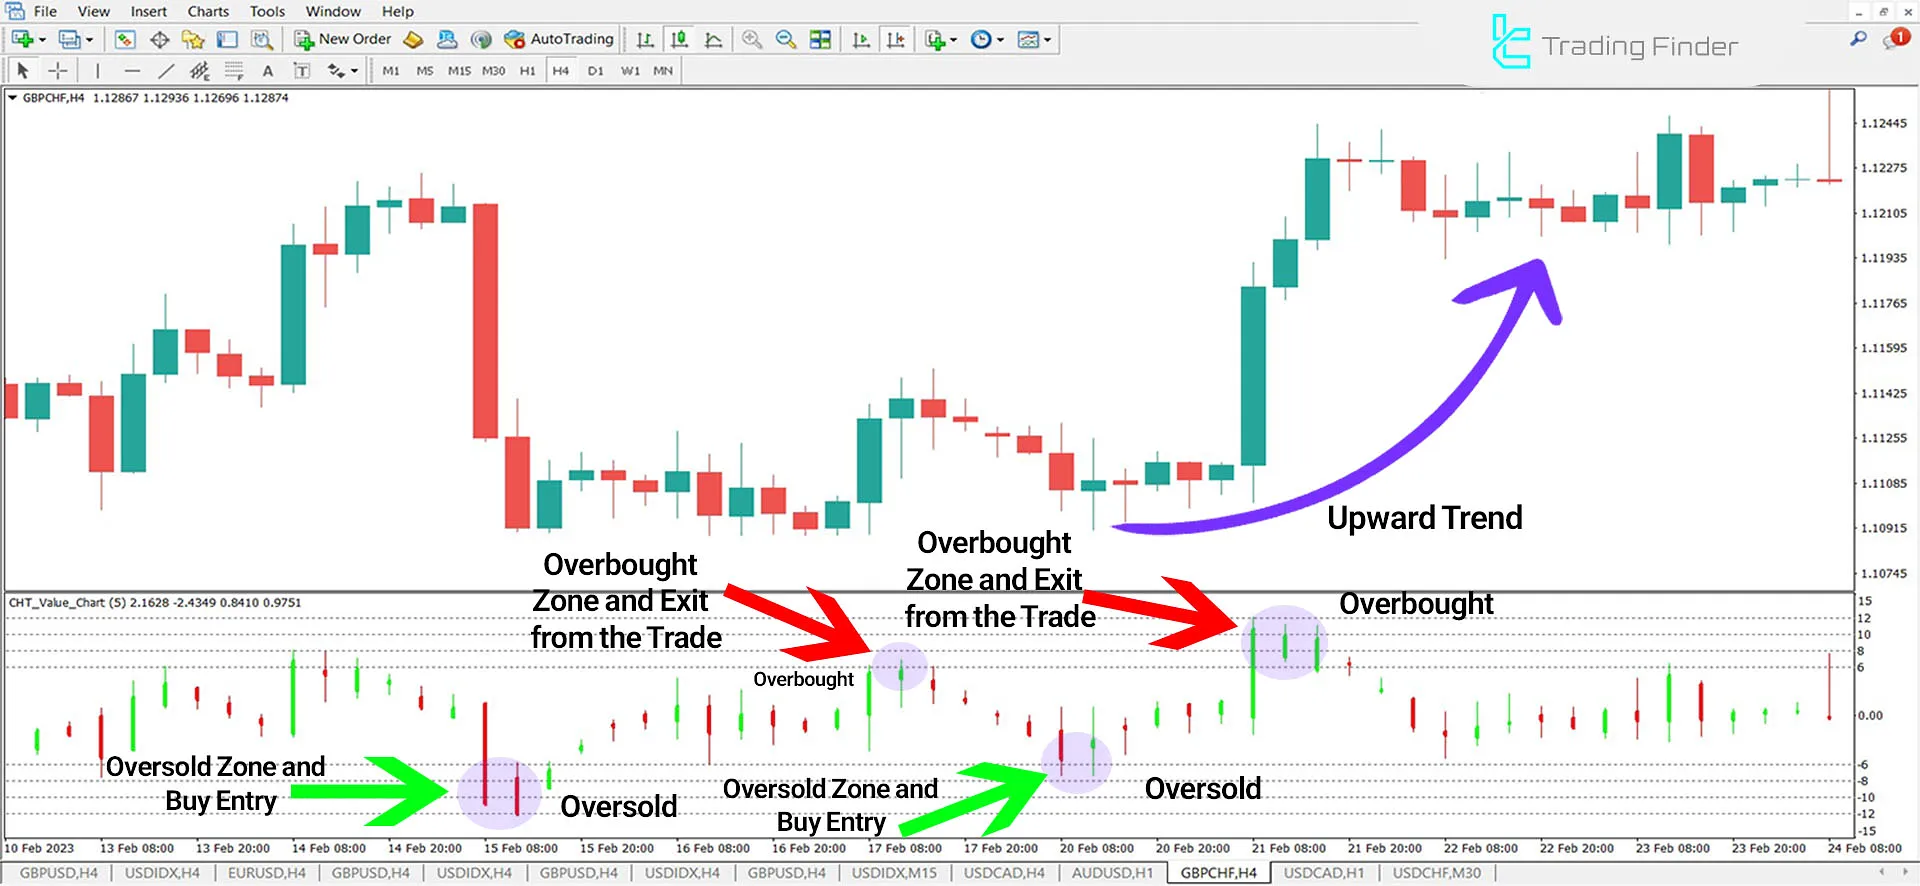
In the chart of British Pound to Swiss Franc (GBP/CHF), the price reaches the oversold area and decreases to -12 in the indicator window. After reaching this level, the price begins its upward trend.
Traders can enter positions in these areas and exit the trade as the price reaches the overbought area.

Indicator in a Downtrend
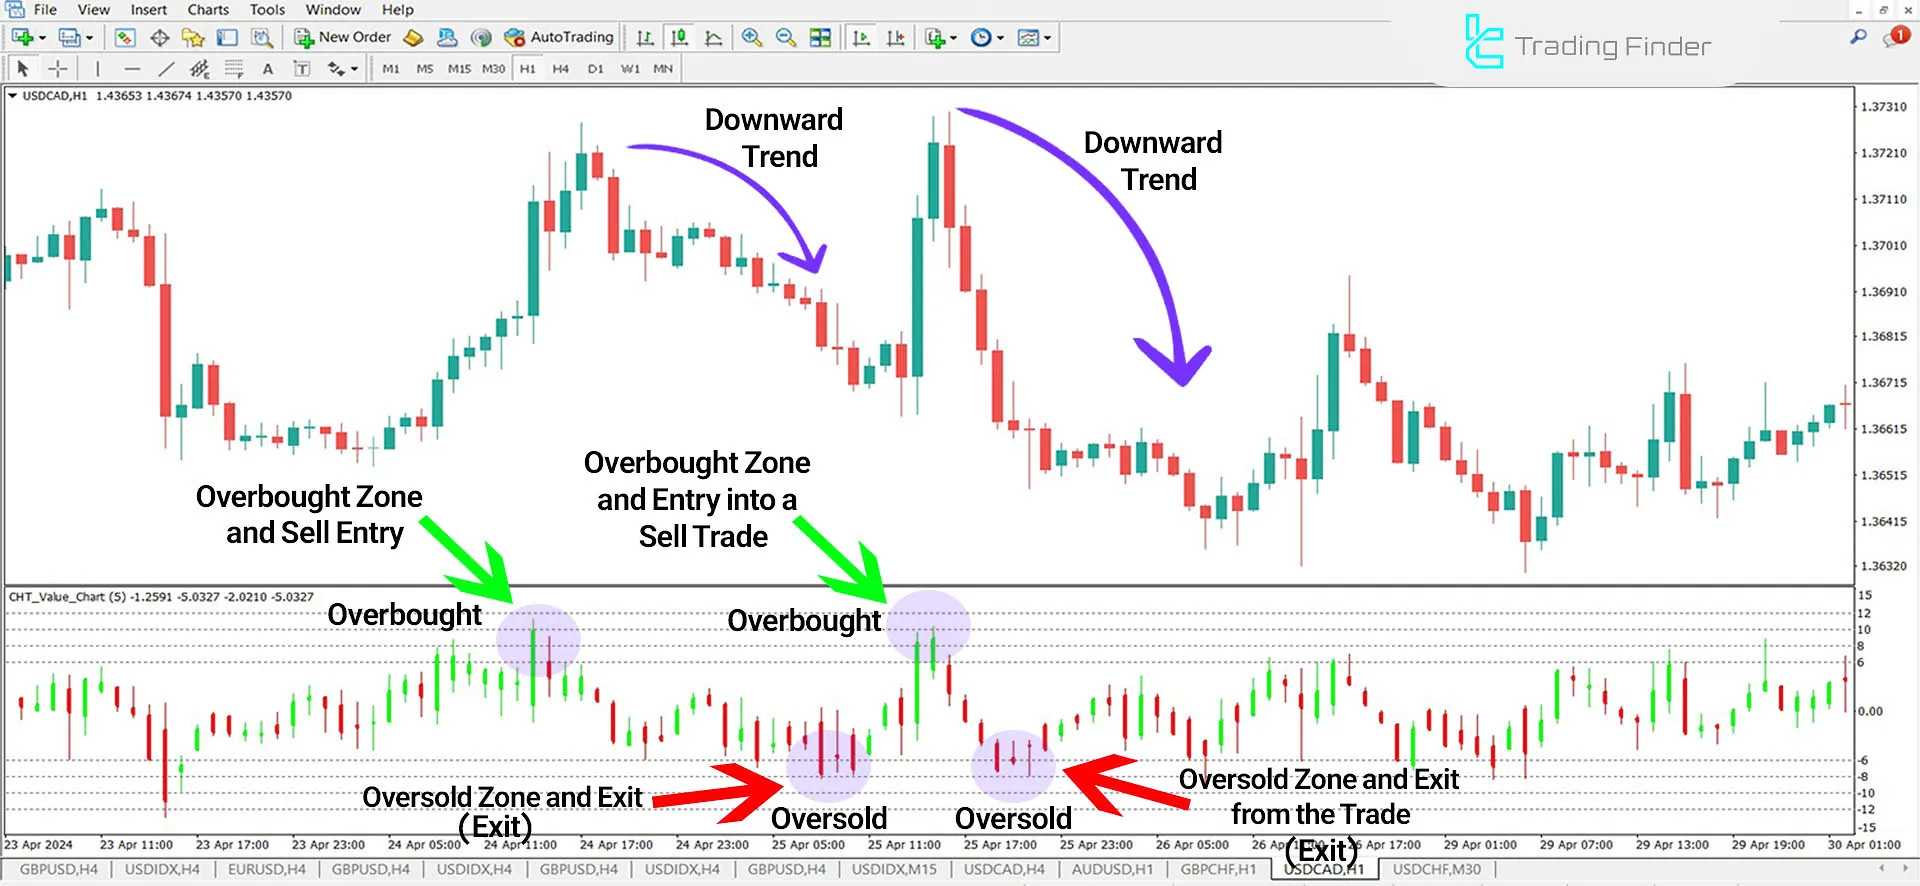
In the following chart of the US Dollar to Canadian Dollar (USD/CAD), the price reaches the overbought area, rising to level 10, and then begins a downward trend.
Traders can open a Sell position after receiving the necessary confirmations. Also, they can exit the trade when the price reaches the oversold areas in the oscillator window.

CHT Value Chart Indicator Settings
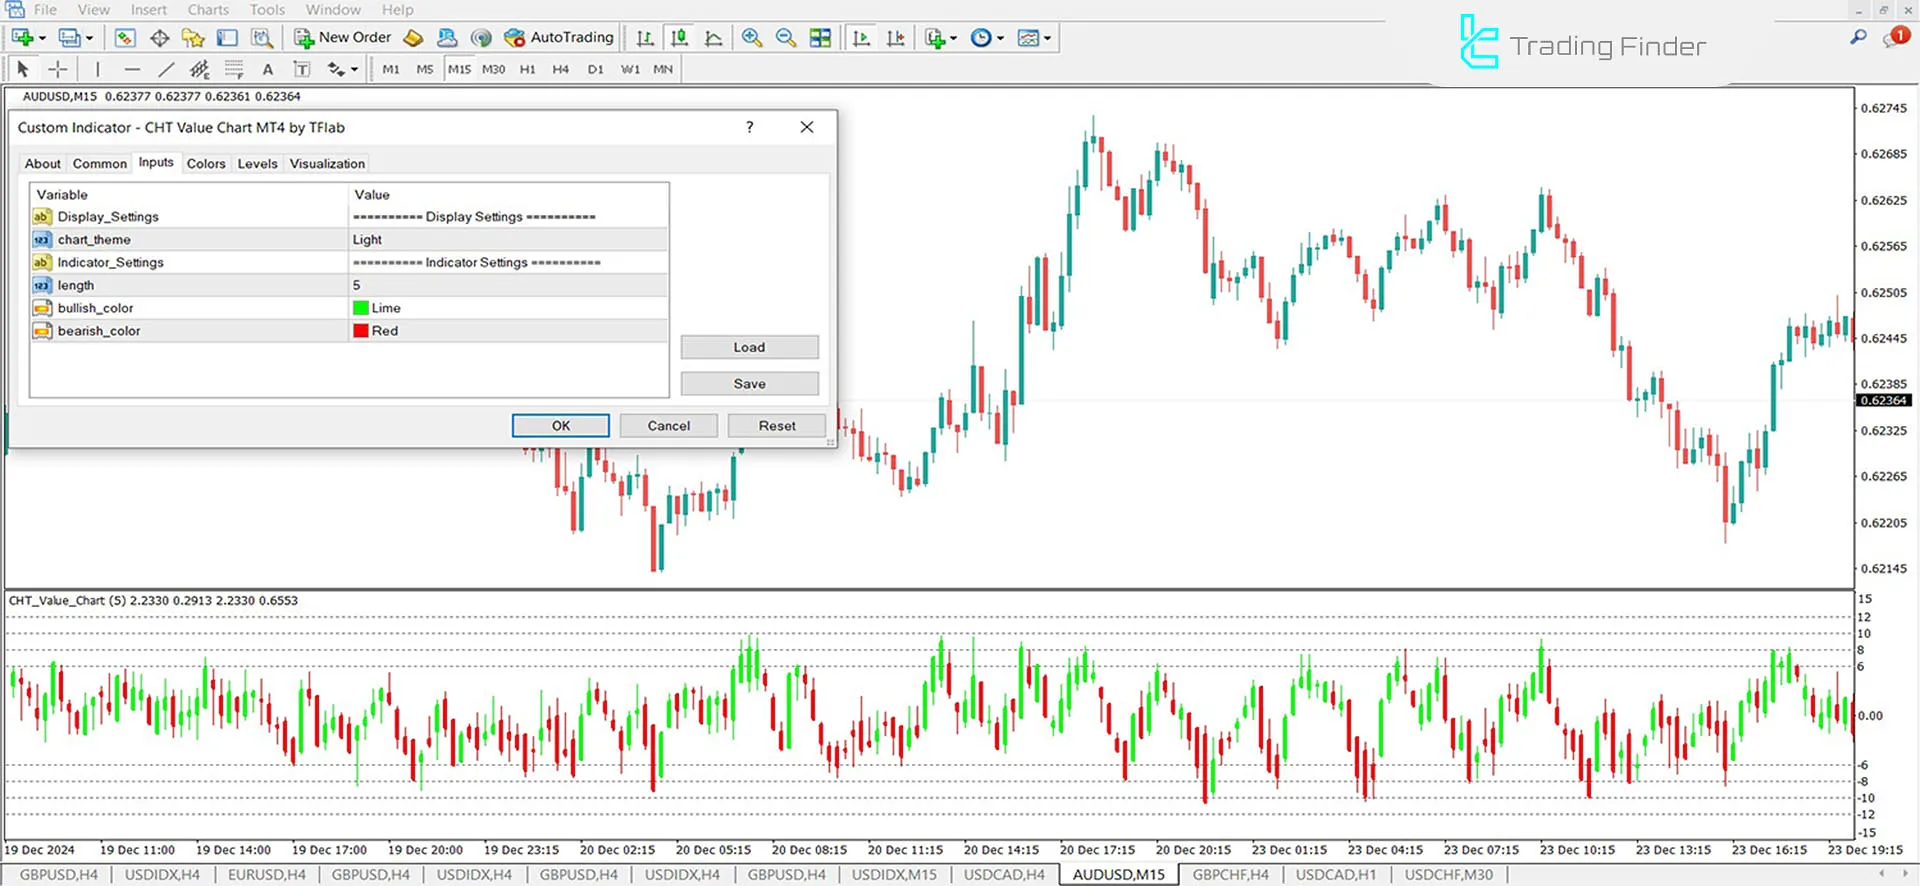
The settings for this indicator are straightforward and include sections like [Display Setting, Indicator Setting]:

- Chart Theme: Background theme for the indicator
- Length: Number of candles required for indicator analysis
- Bullish Color: Color ofbullish candles in the oscillator window
- Bearish Color: Color of bearish candles in the oscillator window
Conclusion
The CHT Value Chart Oscillator is a technical analysis tool that provides a value chart and displays overbought and oversold levels to identify potential price reversal points in financial markets.
This indicator is specifically designed to detect critical price trend changes and can be used on all timeframes.
CHT Value Chart MT4 PDF
CHT Value Chart MT4 PDF
Click to download CHT Value Chart MT4 PDFWhat is the CHT Value Chart Indicator?
It is an indicator for the MetaTrader 4 platform that displays overbought and oversold conditions.
What is the primary use of this indicator?
Its main use is identifying potential price reversal points in overbought and oversold conditions.


