![Advanced ADX Indicator for MetaTrader 5 Download – Free – [Trading Finder]](https://cdn.tradingfinder.com/image/110716/11-7-en-advanced-adx-mt-5.webp)
![Advanced ADX Indicator for MetaTrader 5 Download – Free – [Trading Finder] 0](https://cdn.tradingfinder.com/image/110716/11-7-en-advanced-adx-mt-5.webp)
![Advanced ADX Indicator for MetaTrader 5 Download – Free – [Trading Finder] 1](https://cdn.tradingfinder.com/image/93266/11-07-en-advanced-adx-mt5-04.webp)
![Advanced ADX Indicator for MetaTrader 5 Download – Free – [Trading Finder] 2](https://cdn.tradingfinder.com/image/93287/11-07-en-advanced-adx-mt5-03.webp)
![Advanced ADX Indicator for MetaTrader 5 Download – Free – [Trading Finder] 3](https://cdn.tradingfinder.com/image/93288/11-07-en-advanced-adx-mt5-02.webp)
The Advanced ADX Indicator is a histogram used to measure the strength of price trends on the MetaTrader 5 (MT5) platform. The Advanced ADX MT5 Oscillator fluctuates between levels 0 and 100, with its settings defaulted to a 13-period.
Green bars indicate an uptrend, while red bars indicate a downtrend. An increase in the ADX value reflects the strengthening of the market trend.
Advanced ADX Indicator Table
Indicator Categories: | Oscillators MT5 Indicators Currency Strength MT5 Indicators Trading Assist MT5 Indicators |
Platforms: | MetaTrader 5 Indicators |
Trading Skills: | Intermediate |
Indicator Types: | Leading MT5 Indicators |
Timeframe: | M1-M5 Timeframe MT5 Indicators M15-M30 Timeframe MT5 Indicators H1-H4 Timeframe MT5 Indicators |
Trading Style: | Intraday MT5 Indicators Day Trading MT5 Indicators Fast Scalper MT5 Indicators |
Trading Instruments: | Forex MT5 Indicators Crypto MT5 Indicators Indices MT5 Indicators Forward MT5 Indicators |
Indicator at a Glance
The Advanced ADX Indicator calculates classical ADX values and displays them in a histogram format within the Technical Analysis indicator window. When the D-oscillator is above D+, the histogram turns red, and when D+ is above D-, the histogram turns green.
The size of the histogram is based on the values of the ADX oscillator line, providing a clear visualization of trend dynamics.
Uptrend

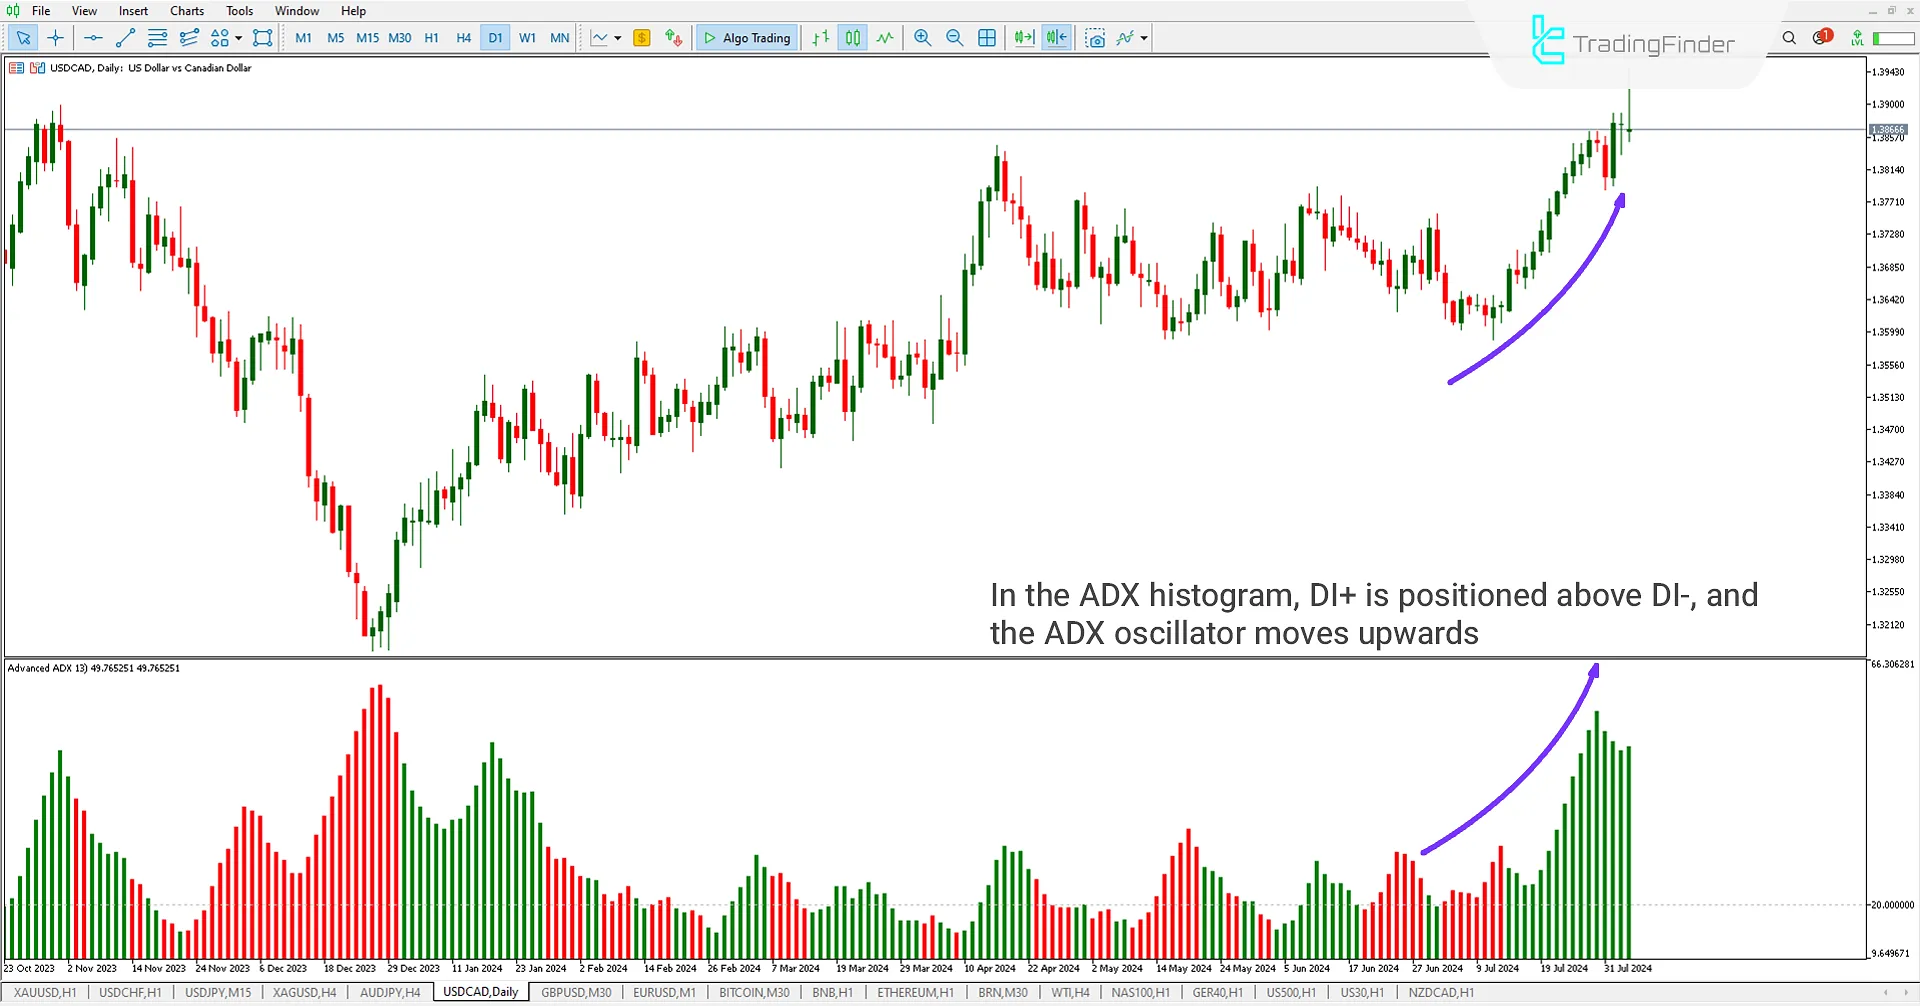
In the daily chart of USD/CAD, the Advanced ADX Indicator's histogram shows green bars indicating an uptrend. When the DI+ oscillator is above the DI- oscillator, green bars appear in the histogram.
Additionally, as the ADX oscillator value increases, the size of the histogram bars also increases, indicating the strength of the market trend.
Downtrend

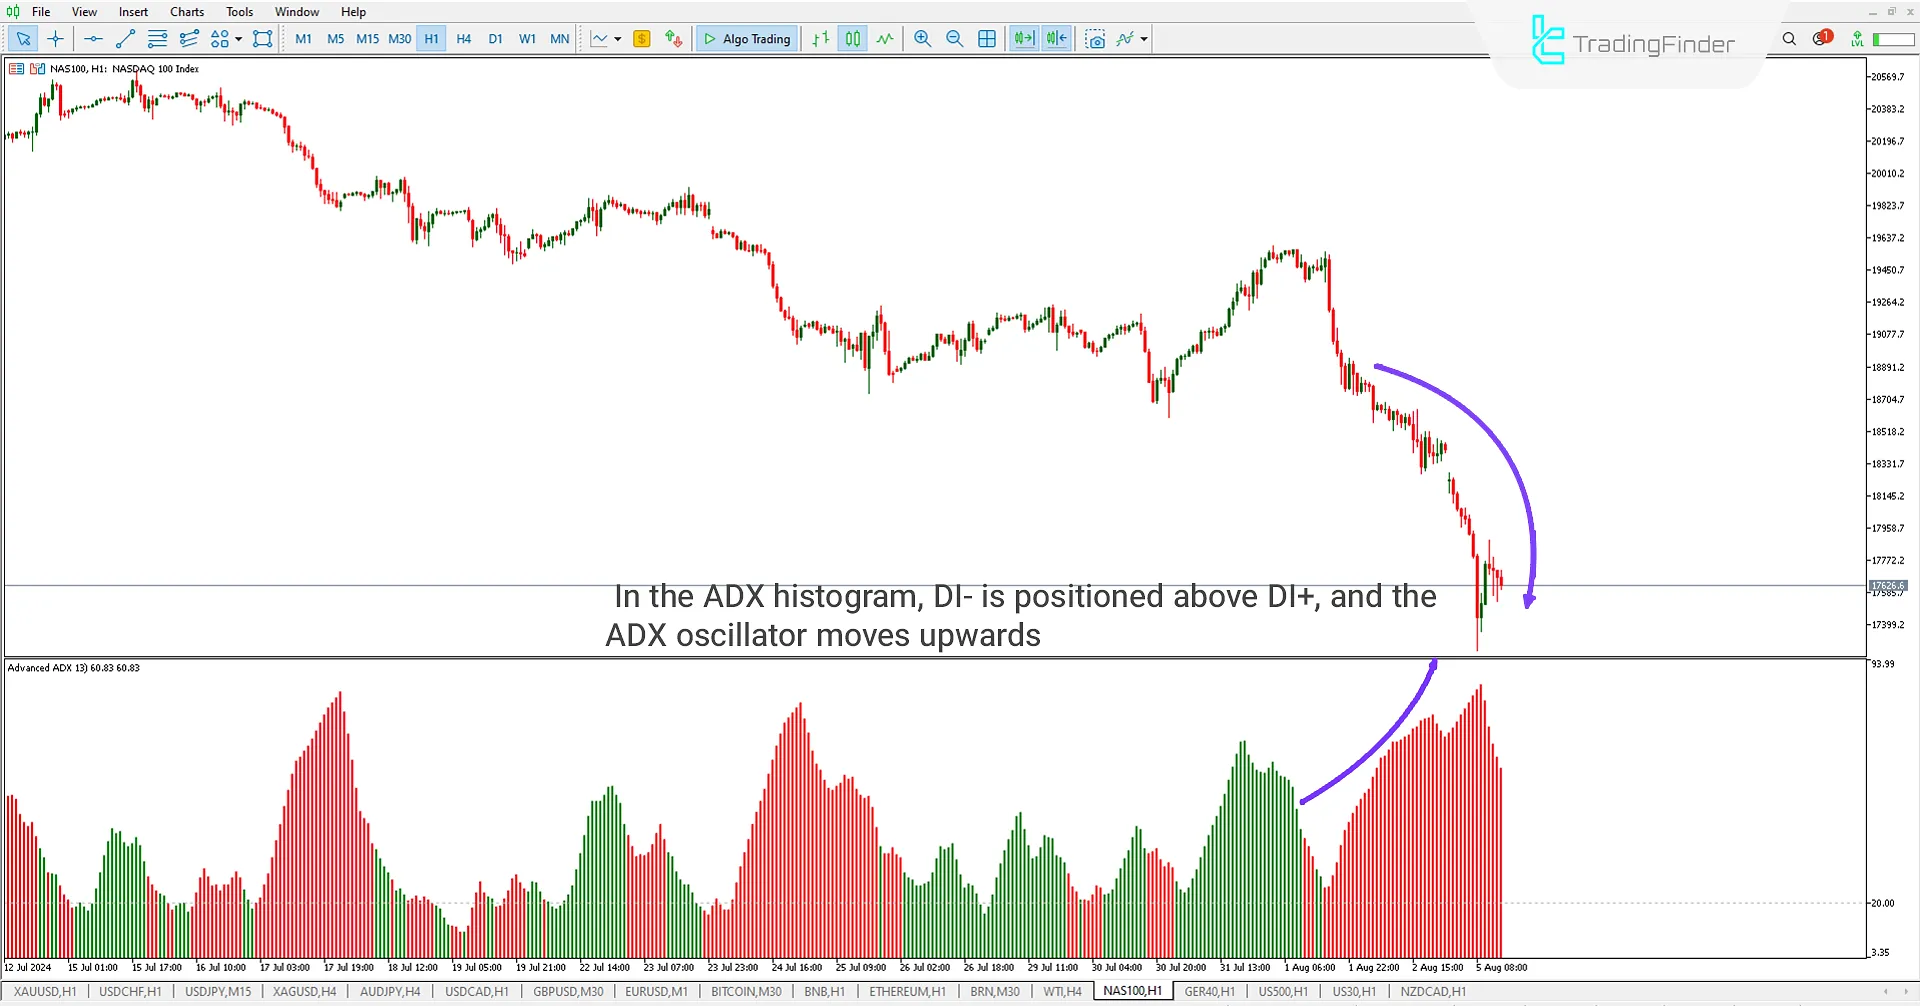
In the 1-hour chart of NAS100, the Advanced ADX Indicator's histogram shows red bars indicating a downtrend. When the DI- oscillator is above the DI+ oscillator, red bars appear in the histogram.
Additionally, as the ADX oscillator value increases, the size of the histogram bars also increases, indicating the strength of the market trend.
Advanced ADX Oscillator Settings

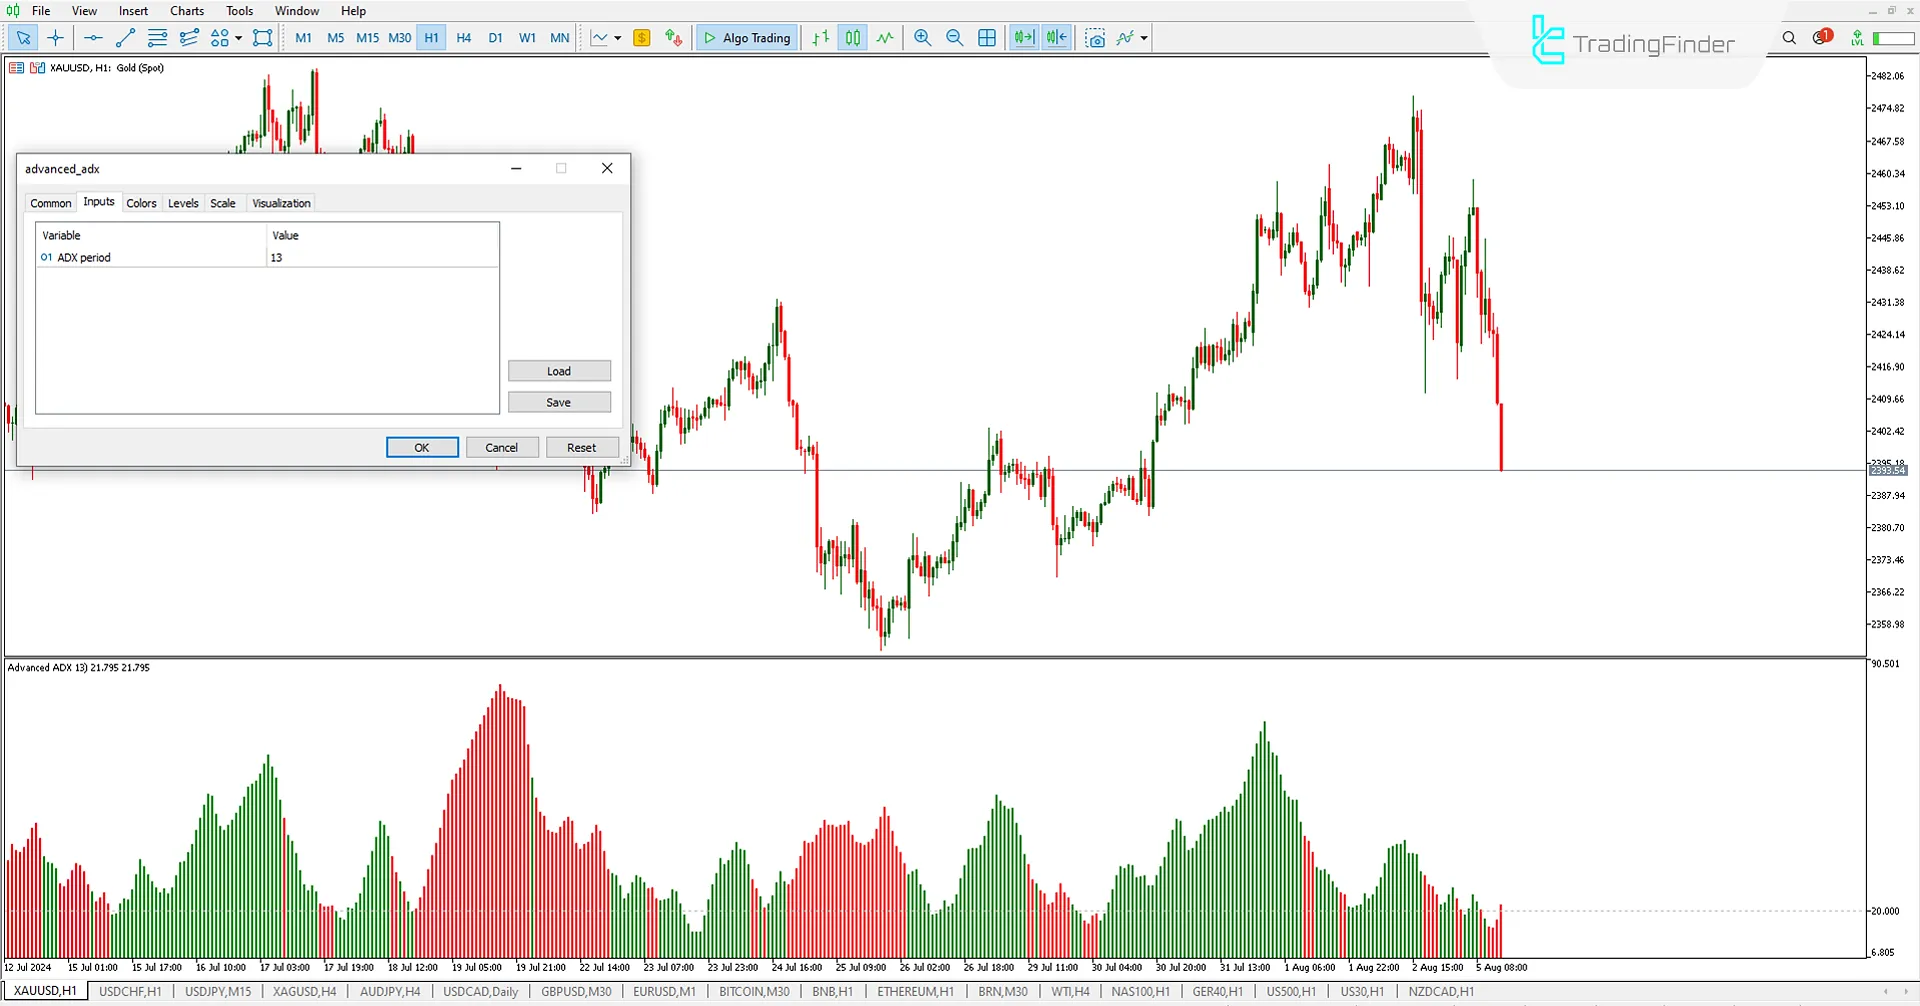
- ADXPeriod: Setting the ADX Period
Conclusion
The Advanced ADX Oscillator and MT5 Trading Tool are most useful in trending markets, fluctuating between levels 0 and 100.
When the ADX oscillator is below the 25 level, it indicates a weak trend. When it moves above the 25 level, it signals a strong trend to the trader.
Advanced ADX MT5 PDF
Advanced ADX MT5 PDF
Click to download Advanced ADX MT5 PDFHow can the Advanced ADX Indicator be used to identify trends?
When the ADX value is above 25, it indicates the presence of a strong trend in the market. If the ADX value is below 20, it indicates a non-trending or weak trend market. Values between 20 and 25 usually indicate the beginning or end of a trend.
How can the +DI and -DI signals be used in the Advanced ADX Indicator?
A buy signal is generated when the +DI crosses above the -DI. Similarly, a sell signal is generated when the -DI crosses above the +DI. These signals are usually confirmed with the ADX value to assess the strength of the trend.


