![Bollinger Squeeze Advanced Indicator for MT5 Download – Free – [TradingFinder]](https://cdn.tradingfinder.com/image/462505/13-168-en-bollinger-squeeze-advanced-mt5-01.webp)
![Bollinger Squeeze Advanced Indicator for MT5 Download – Free – [TradingFinder] 0](https://cdn.tradingfinder.com/image/462505/13-168-en-bollinger-squeeze-advanced-mt5-01.webp)
![Bollinger Squeeze Advanced Indicator for MT5 Download – Free – [TradingFinder] 1](https://cdn.tradingfinder.com/image/462489/13-168-en-bollinger-squeeze-advanced-mt5-02.webp)
![Bollinger Squeeze Advanced Indicator for MT5 Download – Free – [TradingFinder] 2](https://cdn.tradingfinder.com/image/462492/13-168-en-bollinger-squeeze-advanced-mt5-03.webp)
![Bollinger Squeeze Advanced Indicator for MT5 Download – Free – [TradingFinder] 3](https://cdn.tradingfinder.com/image/462496/13-168-en-bollinger-squeeze-advanced-mt5-04.webp)
The Bollinger Squeeze Advanced Indicator is developed to identify periods of reduced price volatility (squeeze) on the MetaTrader 5 platform.
This trading tool is displayed on the chart as histograms accompanied by a swinging curve, providing early alerts for strong upcoming price moves. In this oscillator, bar color changes reflect market shifts green shows buyer strength, red indicates seller dominance, and blue highlights low-volatility periods with the potential for major moves.
Specification Table of the Bollinger Squeeze Advanced Oscillator
The specifications of the Bollinger Squeeze Advanced Indicator are presented in the table below.
Indicator Categories: | Signal & Forecast MT5 Indicators Currency Strength MT5 Indicators Trading Assist MT5 Indicators |
Platforms: | MetaTrader 5 Indicators |
Trading Skills: | Intermediate |
Indicator Types: | Reversal MT5 Indicators |
Timeframe: | Multi-Timeframe MT5 Indicators |
Trading Style: | Swing Trading MT5 Indicators Intraday MT5 Indicators Scalper MT5 Indicators |
Trading Instruments: | Forex MT5 Indicators Crypto MT5 Indicators Stock MT5 Indicators |
Overview of the Bollinger Squeeze Advanced Indicator
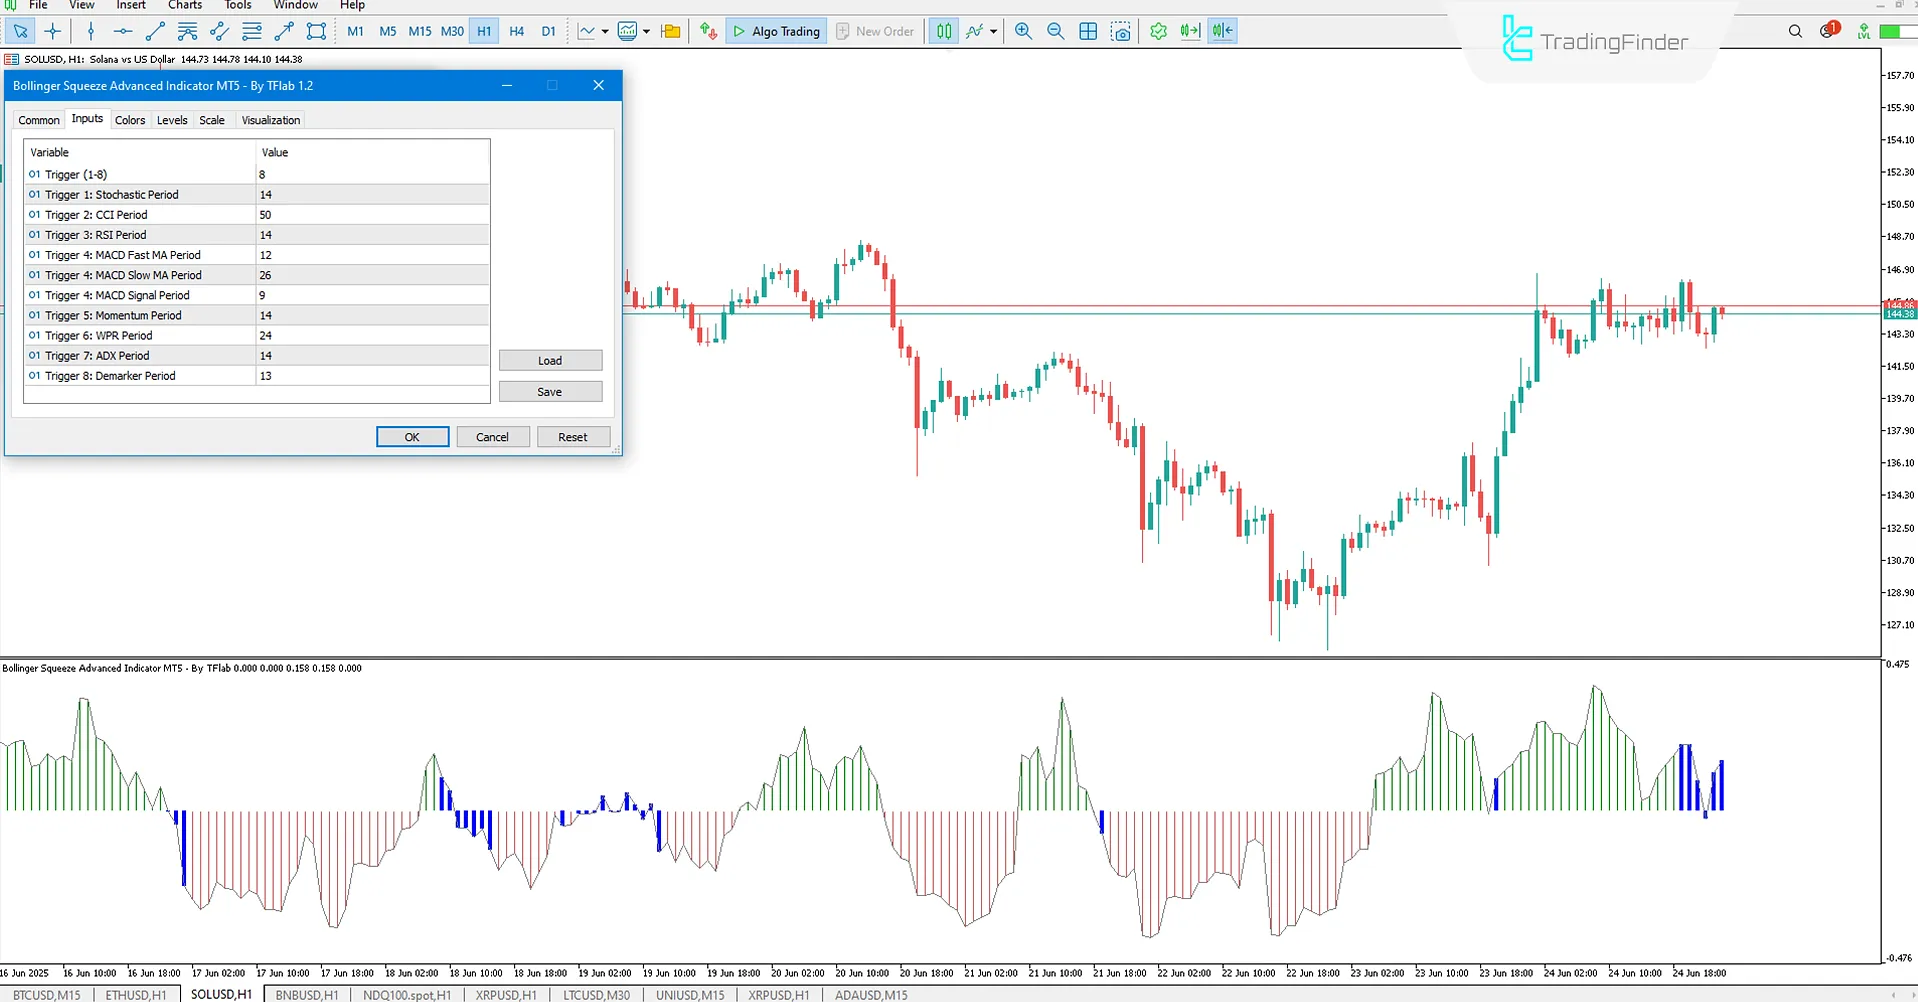
The Bollinger Squeeze Advanced Indicator allows users to choose from eight analytical tools, including the Relative Strength Index (RSI), CCI oscillator, Momentum, and others as the base for calculations.
Note: By default, this indicator uses the DeMarker algorithm for analysis and data display.
Bullish Trend Conditions
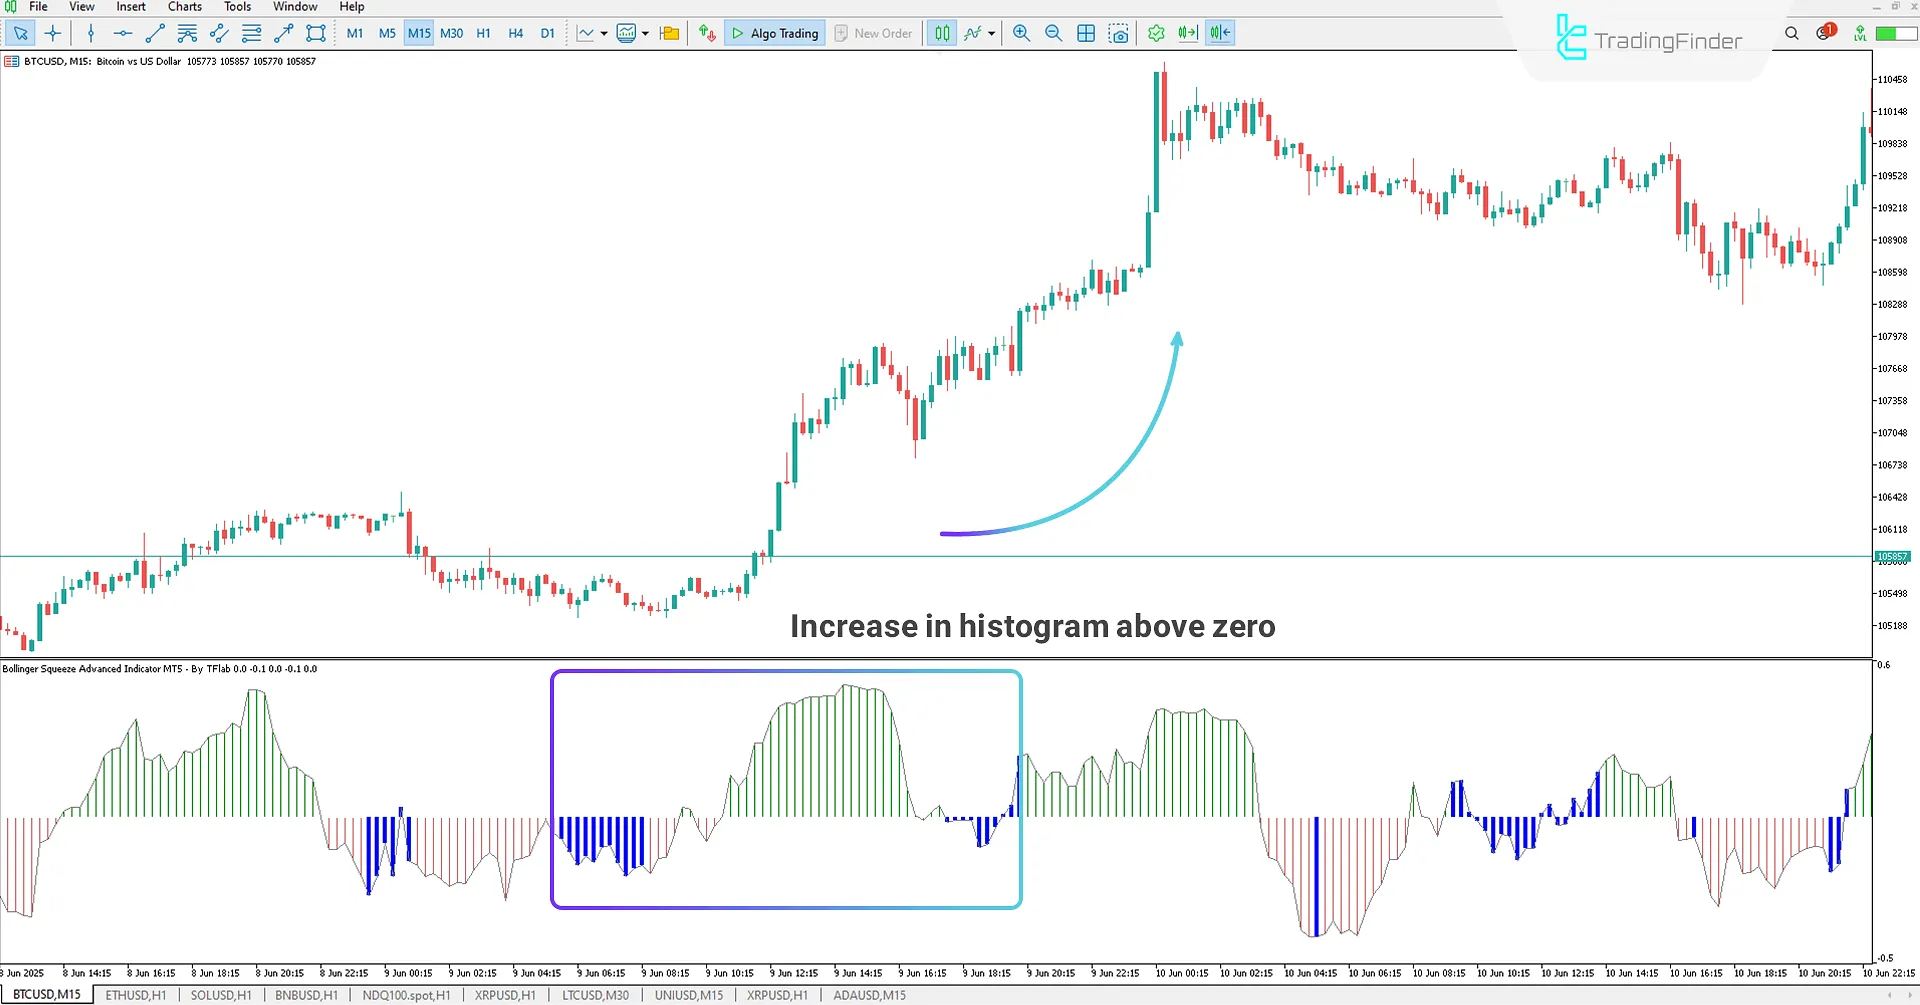
According to the 15-minute Bitcoin (BTC) chart, blue bars indicate low volatility and price compression. When the histogram color shifts from blue to green, it often signals the beginning of a bullish market move.

Bearish Trend Conditions
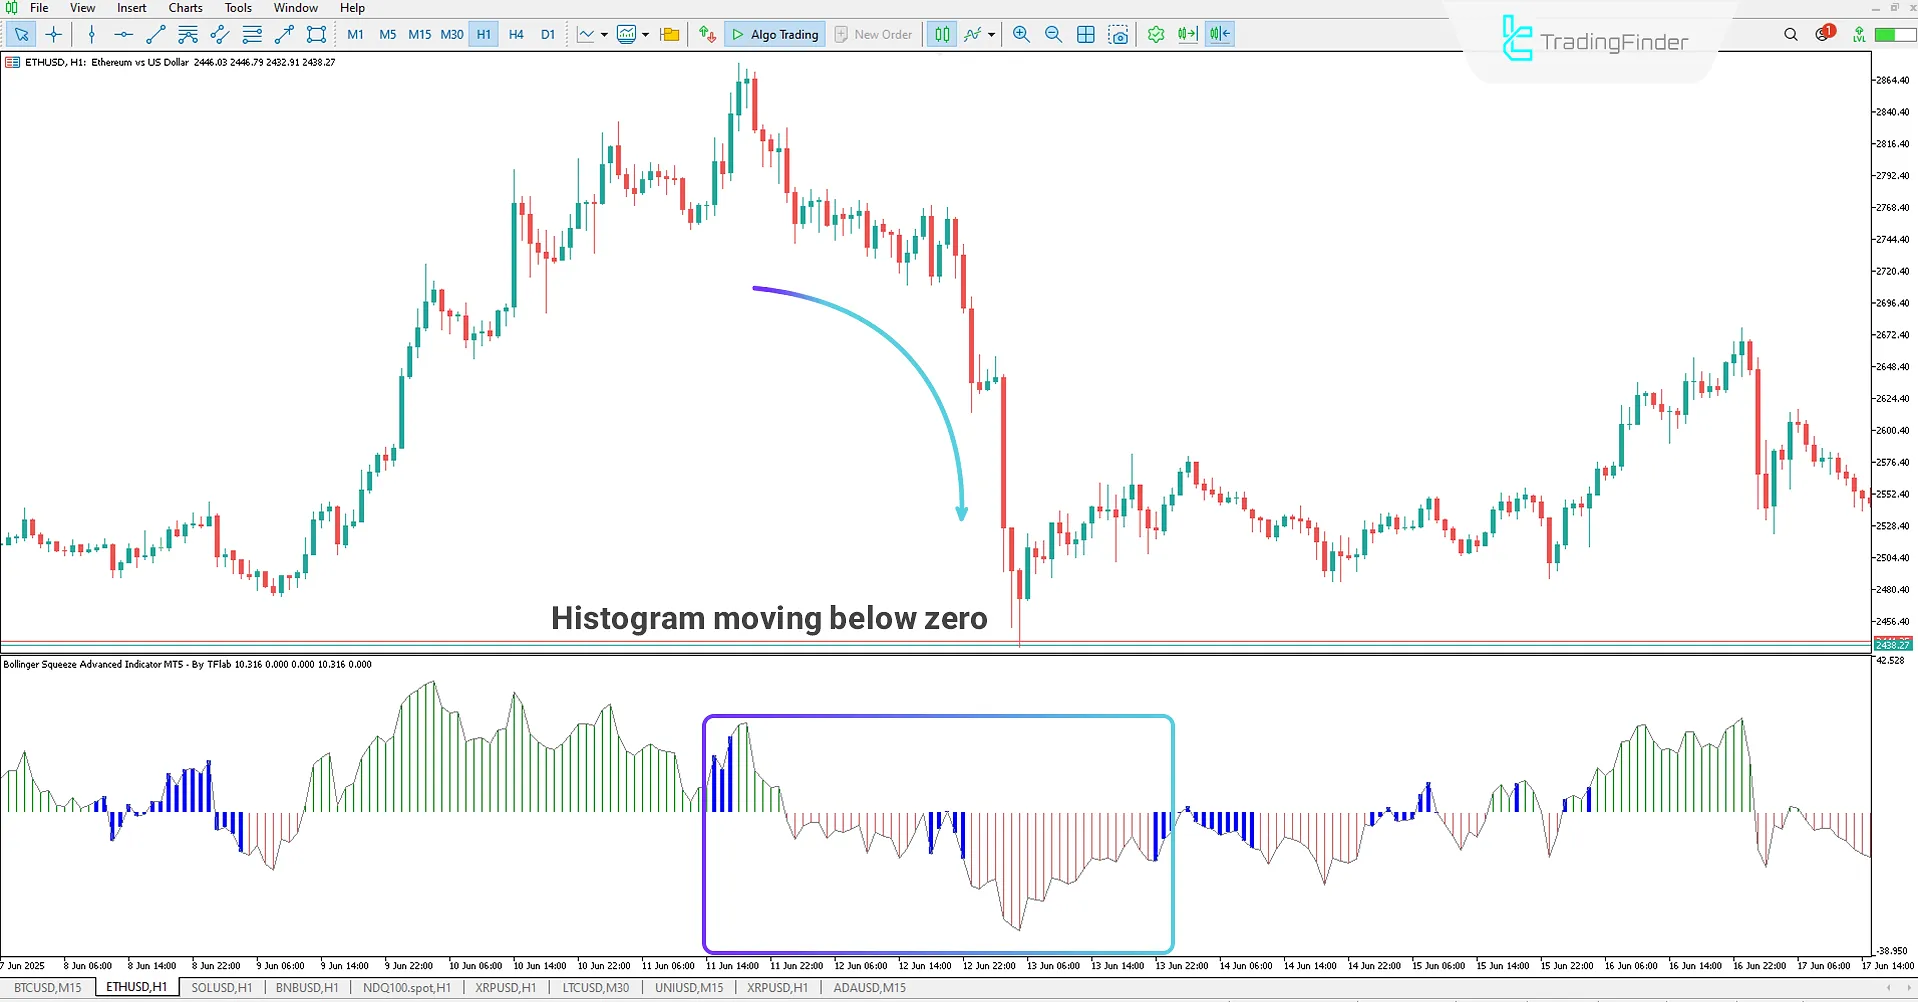
Based on the 1-hour Ethereum (ETH) chart, a drop in the histogram direction below zero indicates a decline in buyer strength. Additionally, a color transition from blue to red marks the market's entry into a downward trend.

Settings of the Bollinger Squeeze Advanced Indicator
The settings of the Bollinger Pressure Oscillator are outlined as follows:

- Trigger: Select indicator number from 1 to 8
- Stochastic Period: Period for calculating the Stochastic oscillator
- CCI Period: Calculation period for the CCI
- RSI Period: Calculation period for the RSI
- MACD Fast MA Period: Fast moving average period in MACD
- MACD Slow MA Period: Slow moving average period in MACD
- MACD Signal Period: Signal line period in MACD
- Momentum Period: Period for Momentum calculation
- WPR Period: Calculation period for Williams %R
- ADX Period: Period for the ADX indicator
- DeMarker Period: Calculation period for the DeMarker indicator
Conclusion
The Bollinger Pressure Oscillator is designed to identify periods of price squeeze and detect the onset of strong market trends.
Using color-coded histograms (green for bullish, red for bearish, and blue for compression) this tool provides a clear view of market conditions. It is compatible across various markets, including cryptocurrencies, commodities, Forex, and stocks.
Bollinger Squeeze Advanced MT5 PDF
Bollinger Squeeze Advanced MT5 PDF
Click to download Bollinger Squeeze Advanced MT5 PDFWhat does the appearance of green histograms indicate?
Green bars signal the start of a bullish trend.
Can the base indicator type be changed?
Yes, users can select one of the eight available indicators in the settings panel.


