![CHT Value Chart Indicator for MetaTrader 5 Download - Free - [TFlab]](https://cdn.tradingfinder.com/image/199476/4-42-en-cht-value-chart-mt5-1.webp)
![CHT Value Chart Indicator for MetaTrader 5 Download - Free - [TFlab] 0](https://cdn.tradingfinder.com/image/199476/4-42-en-cht-value-chart-mt5-1.webp)
![CHT Value Chart Indicator for MetaTrader 5 Download - Free - [TFlab] 1](https://cdn.tradingfinder.com/image/199464/4-42-en-cht-value-chart-mt5-2.webp)
![CHT Value Chart Indicator for MetaTrader 5 Download - Free - [TFlab] 2](https://cdn.tradingfinder.com/image/199463/4-42-en-cht-value-chart-mt5-3.webp)
![CHT Value Chart Indicator for MetaTrader 5 Download - Free - [TFlab] 3](https://cdn.tradingfinder.com/image/199465/4-42-en-cht-value-chart-mt5-4.webp)
The CHT Value Chart indicator is specifically designed for trend analysis and identifying overbought and oversold conditions.
This oscillator provides a value chart in the form of colored bars or candles in a separate window, displaying price information and identifying potential reversal points.
CHT Value Chart Indicator Table
The key specifications of this indicator are outlined in the table below:
Indicator Categories: | Oscillators MT5 Indicators Currency Strength MT5 Indicators Trading Assist MT5 Indicators |
Platforms: | MetaTrader 5 Indicators |
Trading Skills: | Intermediate |
Indicator Types: | Leading MT5 Indicators Reversal MT5 Indicators |
Timeframe: | Daily-Weekly Timeframe MT5 Indicators |
Trading Style: | Intraday MT5 Indicators |
Trading Instruments: | Forex MT5 Indicators Crypto MT5 Indicators Stock MT5 Indicators Forward MT5 Indicators Share Stock MT5 Indicators |
Indicator at a Glance
This indicator divides the overbought and oversold zones into five distinct sections, enabling detailed analysis of the intensity of price reversal points. Analyzing these levels helps identify key market trend changes.
Furthermore, the oscillator is applicable across all timeframes, providing insights into entry (Entry) and exit (Exit) points.
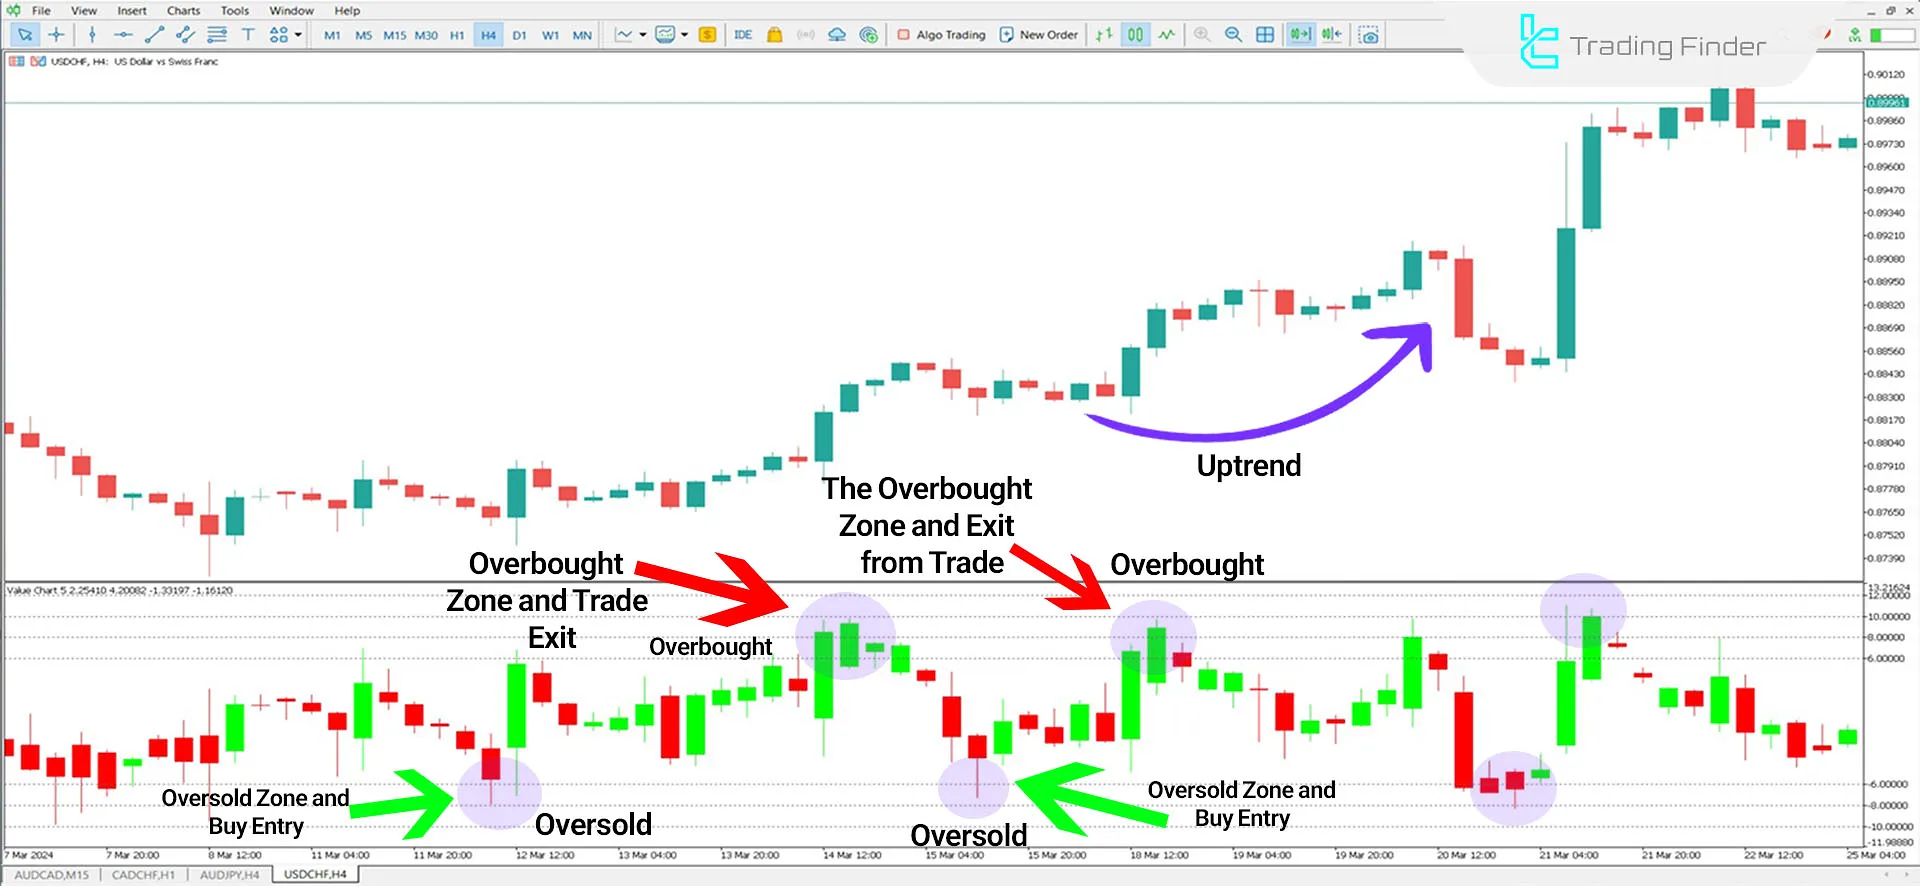
Indicator in an Uptrend
In the price chart of the USD/CHF pair (US Dollar to Swiss Franc), overbought and oversold zones are marked. The price moves upward after dropping to the -8 level on the indicator line.
Traders can open Buy positions in these zones and exit their trades as the price reaches the overbought zones.

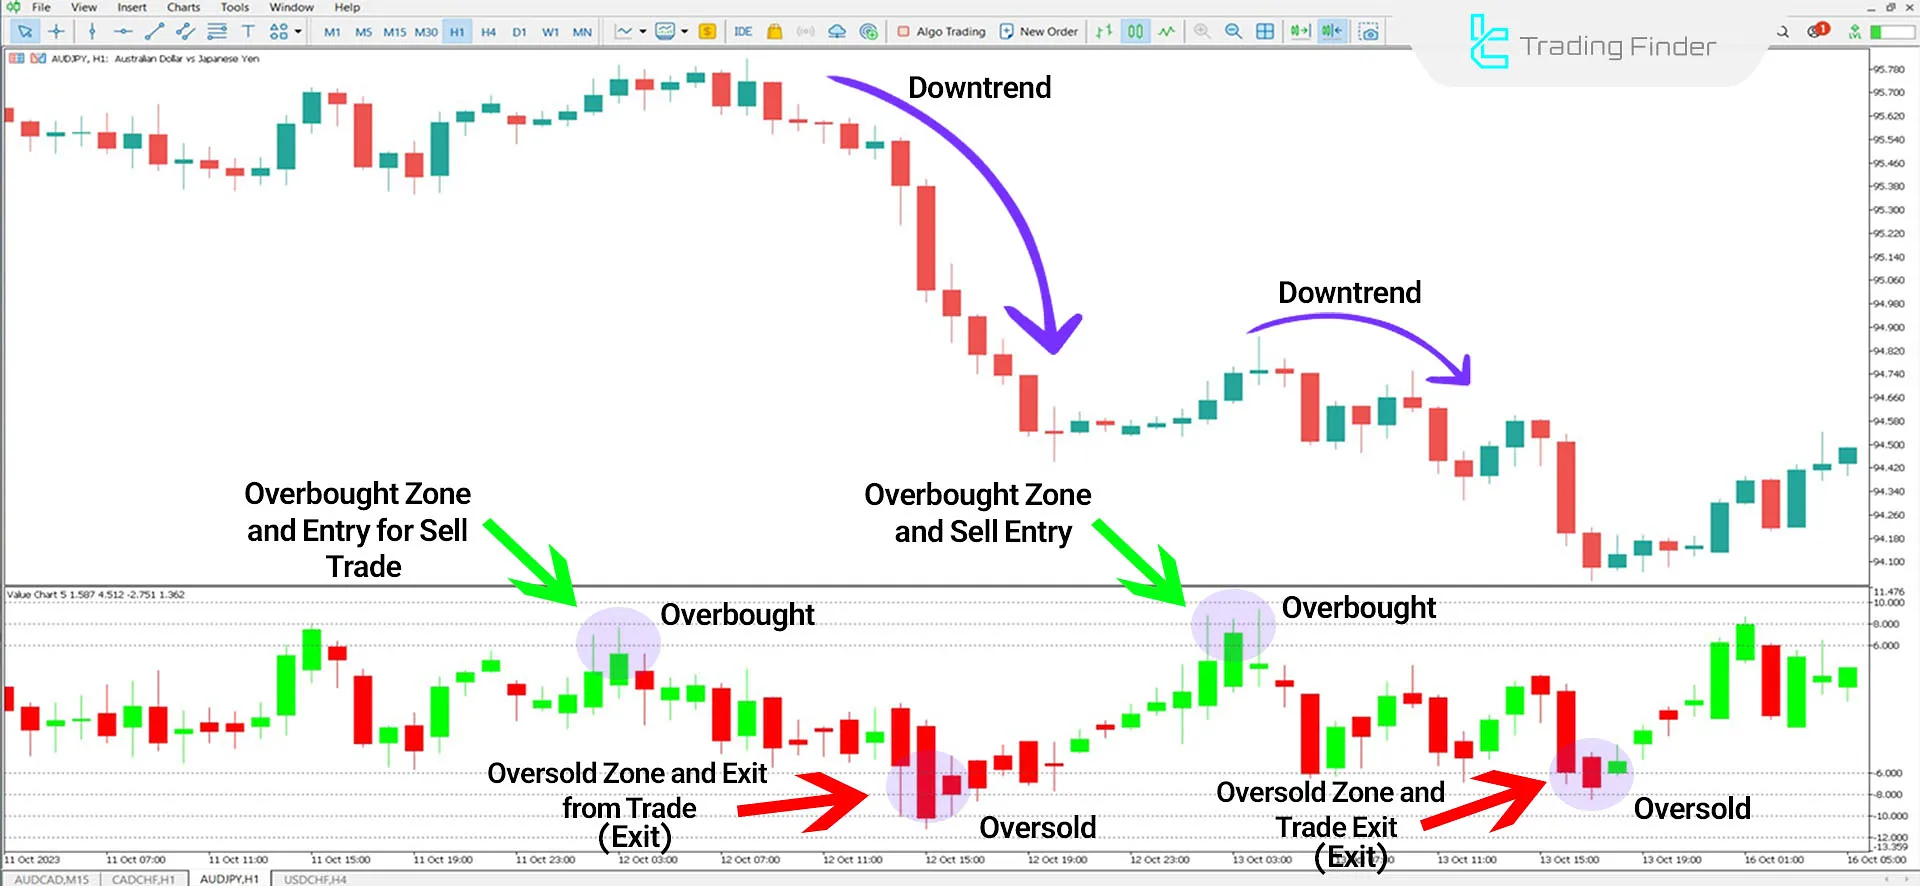
Indicator in a Downtrend
In the chart of the AUD/JPY pair (Australian Dollar to Japanese Yen) in a 1-hour timeframe, the price enters the overbought zone and initiates a downward trend.
Traders can use this indicator as a complementary tool, aligning it with their strategies to determine entry and exit points for their trades.

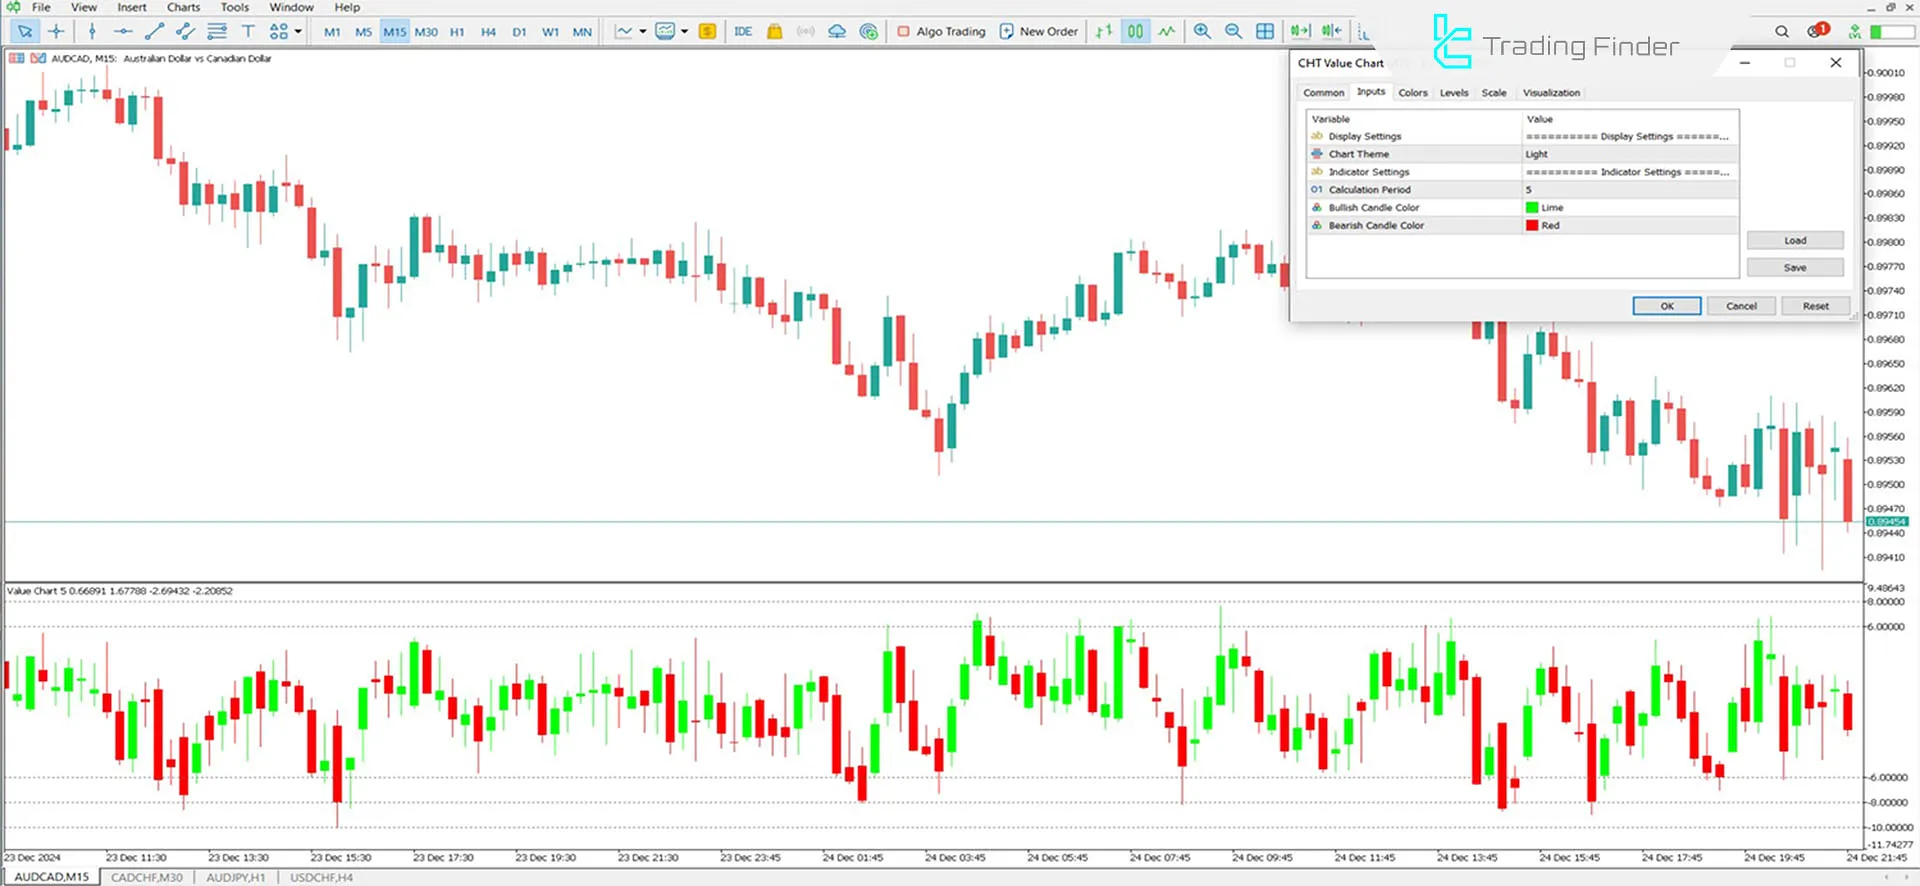
CHT Value Chart Oscillator Settings
This indicator offers straightforward settings with two sections:

- Chart Theme: Customize the indicator’s background theme
- Length: Define the number of candlesticks required for analysis
- Bullish Color: Set the color for bullish candles in the oscillator window
- Bearish Color: Set the color for bearish candles in the indicator window
Conclusion
The CHT Value Chart oscillator is a technical analysis tool used in MetaTrader 5 indicators, providing a value chart to display overbought and oversold zones.
This indicator identifies potential price reversal points and is applicable across all timeframes for analyzing significant changes in price trends.
CHT Value Chart MT5 PDF
CHT Value Chart MT5 PDF
Click to download CHT Value Chart MT5 PDFHow are entry and exit points identified?
By examining overbought (Overbought) and oversold (Oversold) levels, traders can easily spot entry and exit points in key support and resistance areas.
How does this indicator display overbought and oversold zones?
It uses colored bars or candles to divide the overbought and oversold zones into five sections, showing their intensity.


