![ICT ADR Levels and Zones indicator for MT5 Download – Free – [TradingFinder]](https://cdn.tradingfinder.com/image/460939/13-166-en-ict-adr-levels-and-zones-mt5-01.webp)
![ICT ADR Levels and Zones indicator for MT5 Download – Free – [TradingFinder] 0](https://cdn.tradingfinder.com/image/460939/13-166-en-ict-adr-levels-and-zones-mt5-01.webp)
![ICT ADR Levels and Zones indicator for MT5 Download – Free – [TradingFinder] 1](https://cdn.tradingfinder.com/image/460935/13-166-en-ict-adr-levels-and-zones-mt5-02.webp)
![ICT ADR Levels and Zones indicator for MT5 Download – Free – [TradingFinder] 2](https://cdn.tradingfinder.com/image/460937/13-166-en-ict-adr-levels-and-zones-mt5-03.webp)
The ICT ADR Levels and Zones Indicator is developed based on the principles and methodology of the ICT trading style, making it a useful tool for analyzing daily price volatility in the market.
By analyzing price movements over the past five days and evaluating previous highs and lows, this indicator identifies the Average Daily Range(ADR) and displays it directly on the chart.
These zones are marked in three proportions (1/3, 1/2, and 1x ADR) and are visually represented in green, blue, and red, respectively.
Specifications Table – ICT ADR Levels and Zones Indicator
Below is the specification table for the ADR Levels Indicator in ICT style.
Indicator Categories: | Liquidity Indicators MT5 Indicators Trading Assist MT5 Indicators ICT MT5 Indicators |
Platforms: | MetaTrader 5 Indicators |
Trading Skills: | Advanced |
Indicator Types: | Reversal MT5 Indicators |
Timeframe: | Multi-Timeframe MT5 Indicators |
Trading Style: | Swing Trading MT5 Indicators Scalper MT5 Indicators Day Trading MT5 Indicators |
Trading Instruments: | Forex MT5 Indicators Crypto MT5 Indicators Stock MT5 Indicators |
ICT ADR Levels and Zones Indicator at a Glance
One of the key features of the ICT ADR Levels and Zones Indicator is its ability to help identify early deceptive market moves at the beginning of trading sessions, such as those in London or New York moves commonly referred to as Judas Swings in the ICT methodology.
In such moves, the market typicallypenetrates an ADR zone, absorbs liquidity, and then reverses direction to start the main trend of the day.
Bullish Scenario
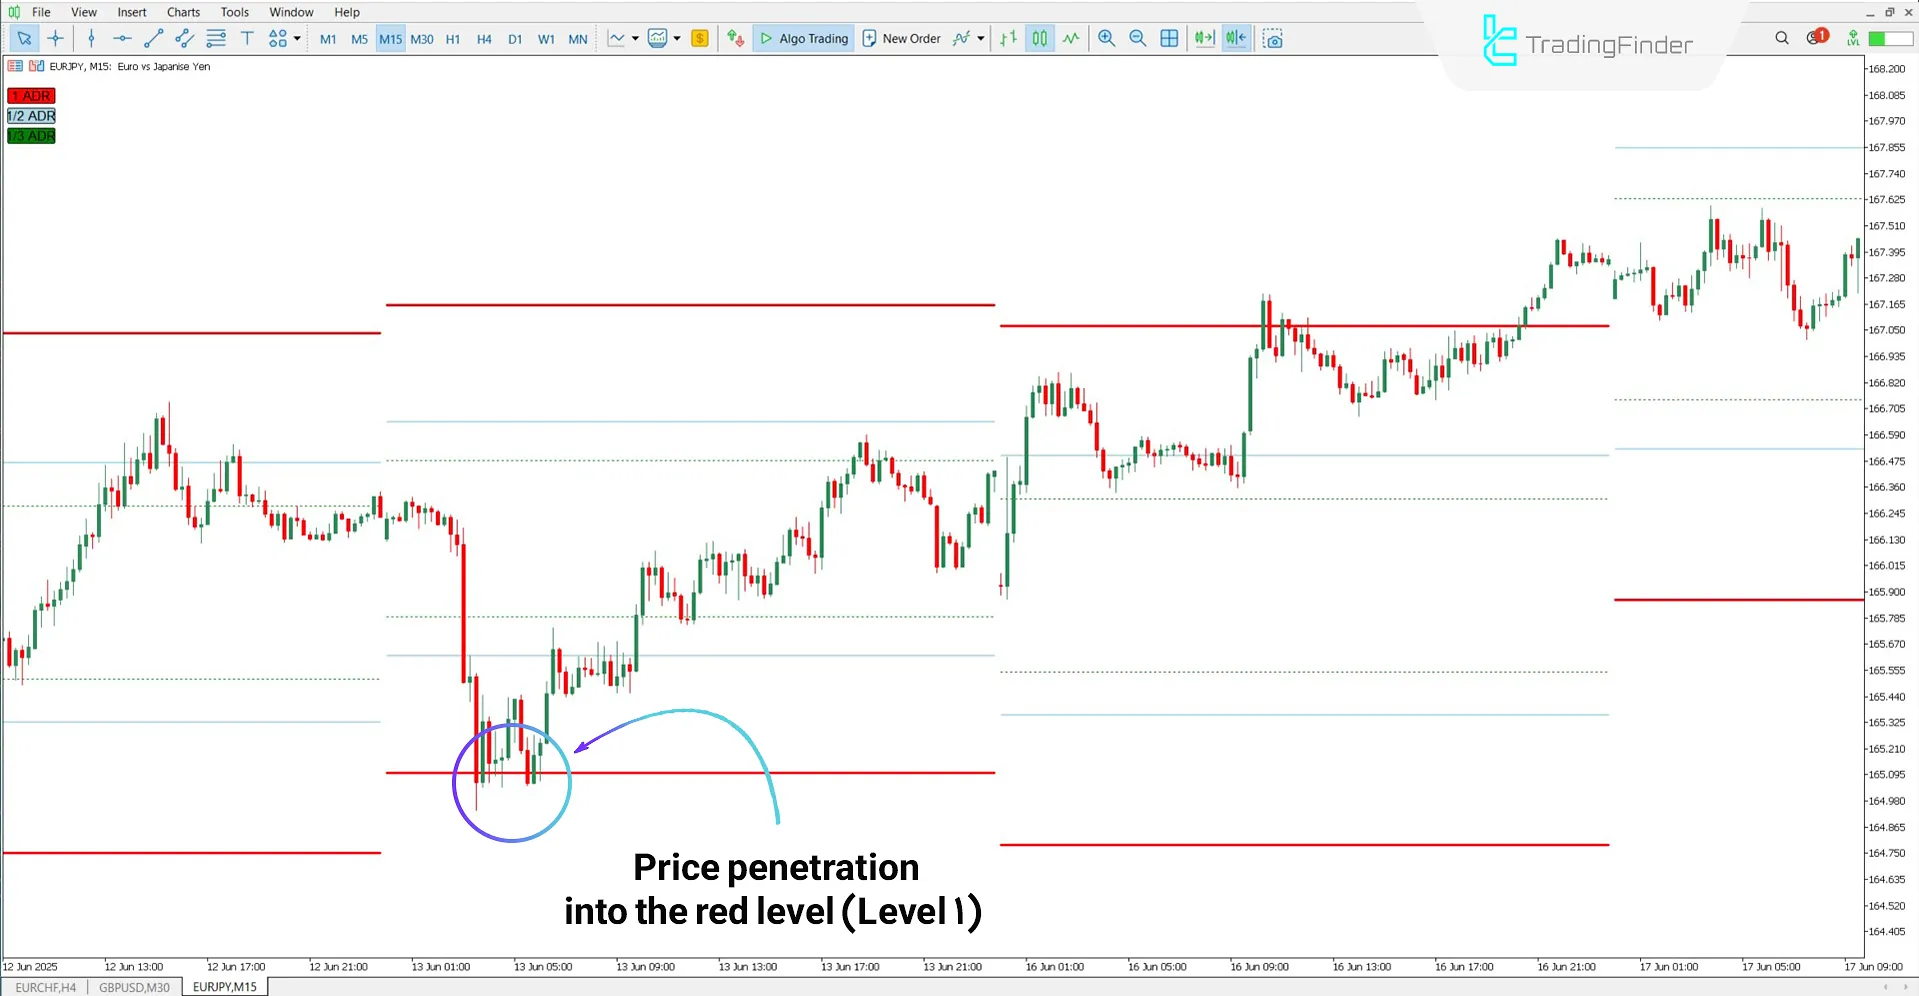
Based on the 15-minute chart of the EUR/JPY pair, the price enters the red ADR zone, absorbs seller liquidity, and then initiates a bullish phase.
In such conditions, we can expect the price to move toward the opposite ADR level, considering the short-term trend as bullish.

Bearish Move
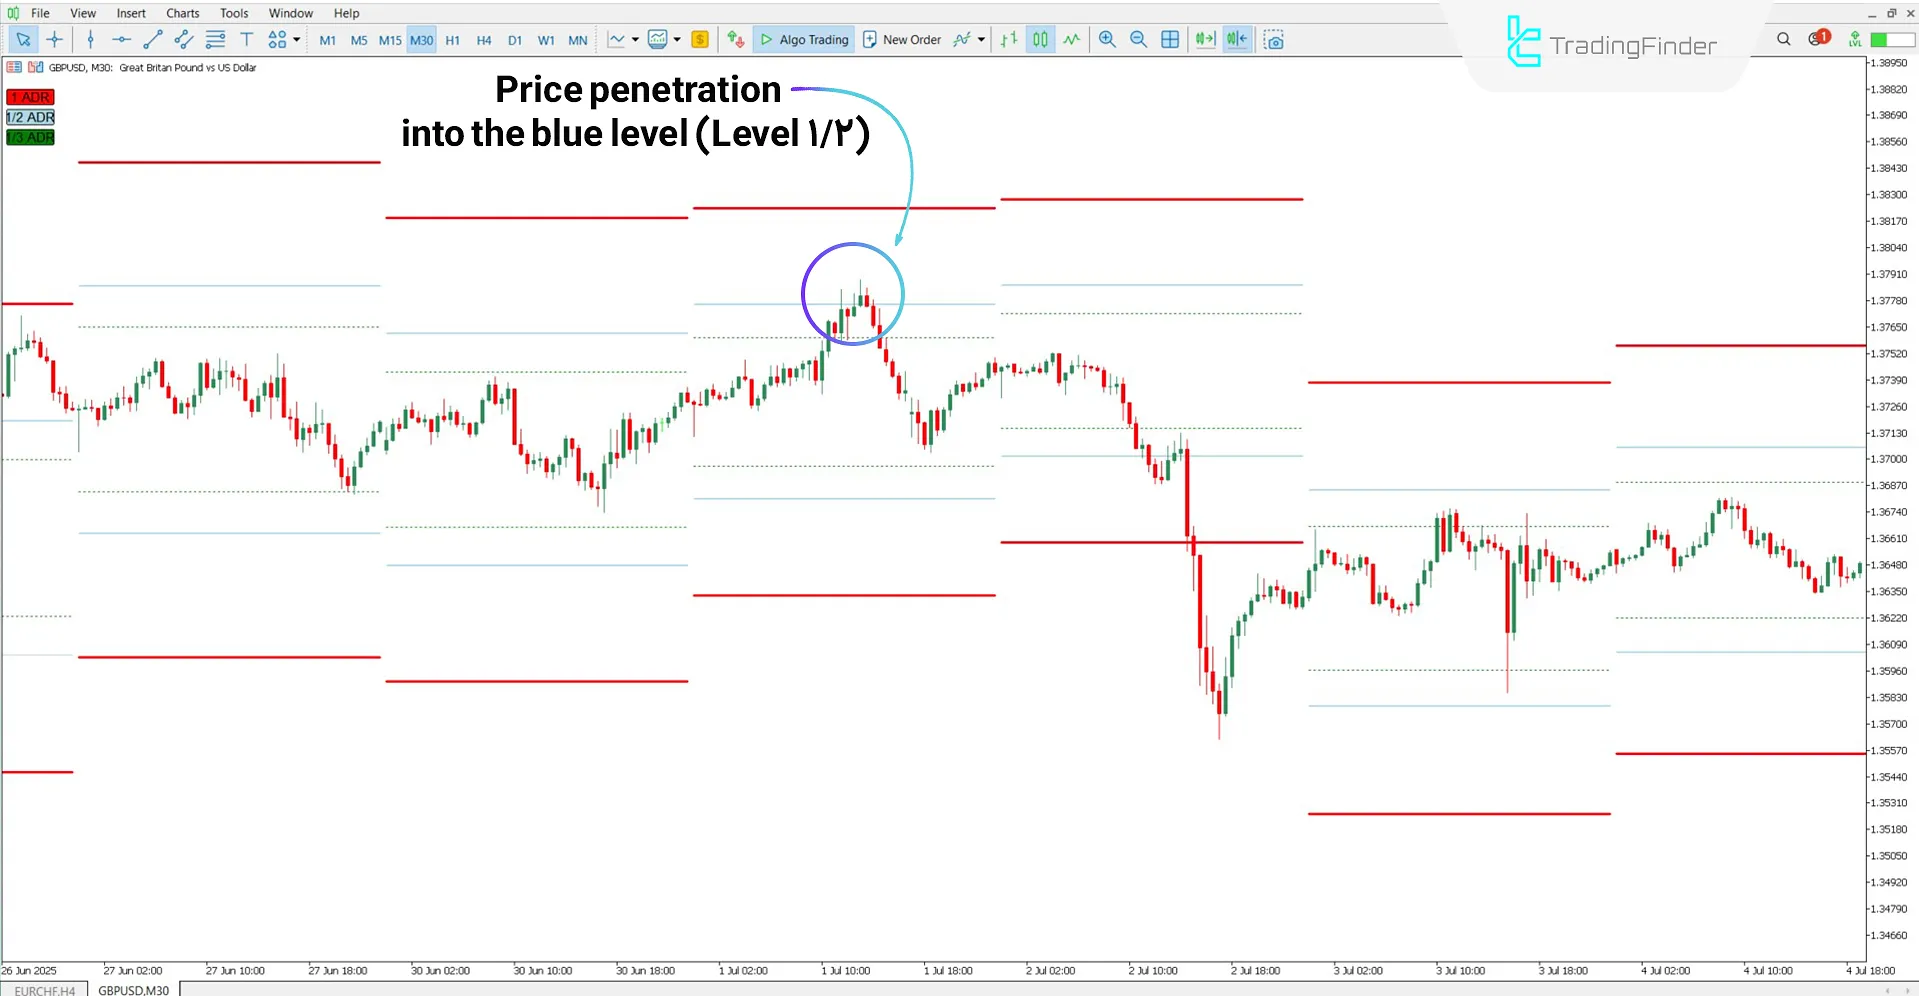
The 30-minute chart of the GBP/USD pair demonstrates how the ICT ADR Zones Indicator operates.
As shown in the chart, the price first moves toward the higher ADR levels absorbs buyer liquidity in those regions, and then reverses into a downward movement.

Conclusion
TheICT ADR Levels and Zones Indicatoris a powerful trading tool for analyzing daily market volatility.
By displaying levels equal to 1/3, 1/2, and 1x the Average Daily Range, it simplifies the process of identifying potential price reversal zones.
ICT ADR Levels & Zones MT5 PDF
ICT ADR Levels & Zones MT5 PDF
Click to download ICT ADR Levels & Zones MT5 PDFWhat is the basis for the design of this indicator?
The ADR Levels and Zones Indicator is based on ICT trading concepts, focusing on price behavior and liquidity to identify key market levels.
How many days are considered for ADR calculation?
The indicator typically uses the last five trading days to calculate the Average Daily Range.
What is the basis for the design of this indicator?
The ADR Levels and Zones Indicator is based on ICT trading concepts, focusing on price behavior and liquidity to identify key market levels.
How many days are considered for ADR calculation?
The indicator typically uses the last five trading days to calculate the Average Daily Range.
Not working
The indicator works correctly. Please watch the tutorial video first, and if any issues remain, you can contact support through the online chat.
Thank you for sharing this indicator for free. However, I would like to point out the 2 issues I found while testing it. 1) Selection of timeframes: whatever the choice, the lines keep showing on ALL timeframes. 2) After deleting the indi from the template, the lines remain on the chart. 3) Would you consider letting the user decide which ADR lines to show? Personally, I only use the High and Low, ie. without 1/2 and 1/3. Kind regards
For the review you mentioned, please coordinate with our support team on Telegram.


