


![RAVI Indicator for MT5 – [TradingFinder] – Free Download](https://cdn.tradingfinder.com/image/450243/2-97-en-ravi-mt5-1.webp)
![RAVI Indicator for MT5 – [TradingFinder] – Free Download 1](https://cdn.tradingfinder.com/image/450246/2-97-en-ravi-mt5-2.webp)
![RAVI Indicator for MT5 – [TradingFinder] – Free Download 2](https://cdn.tradingfinder.com/image/450244/2-97-en-ravi-mt5-3.webp)
![RAVI Indicator for MT5 – [TradingFinder] – Free Download 3](https://cdn.tradingfinder.com/image/450245/2-97-en-ravi-mt5-4.webp)
The RAVI Indicator is a practical trend analysis tool available on the MetaTrader 5 platform, primarily focused on detecting structural changes in market behavior.
This oscillator is based on the percentage difference between two Simple Moving Averages(SMA) with different time periods. The difference is calculated relative to the current price, allowing the indicator to display trend strength and direction with higher precision.
RAVI Indicator Table
The general specifications of the Range Action Verification Index indicator are listed in the table below:
Indicator Categories: | Oscillators MT5 Indicators Currency Strength MT5 Indicators Trading Assist MT5 Indicators |
Platforms: | MetaTrader 5 Indicators |
Trading Skills: | Intermediate |
Indicator Types: | Reversal MT5 Indicators |
Timeframe: | Multi-Timeframe MT5 Indicators |
Trading Style: | Intraday MT5 Indicators |
Trading Instruments: | Forex MT5 Indicators Crypto MT5 Indicators Stock MT5 Indicators |
RAVI at a Glance
The Range Action Verification Index (RAVI) is designed as a wave-like line chart that oscillates around a zero axis. This line reflects the intensity and direction of the dominant market trend, and its crossover through the zero line may indicate a structural shift in market movement from bullish to bearish or vice versa.
RAVI in a Bullish Trend
The image below shows the AUD/JPY currency pair on a 15-minute timeframe. When the RAVI signal line crosses the zero axis from below to above, it may indicate the start of an uptrend.
If, in this condition, the price also breaks a significant resistance level, it serves as a strong confirmation of the signal generated by the RAVI indicator.
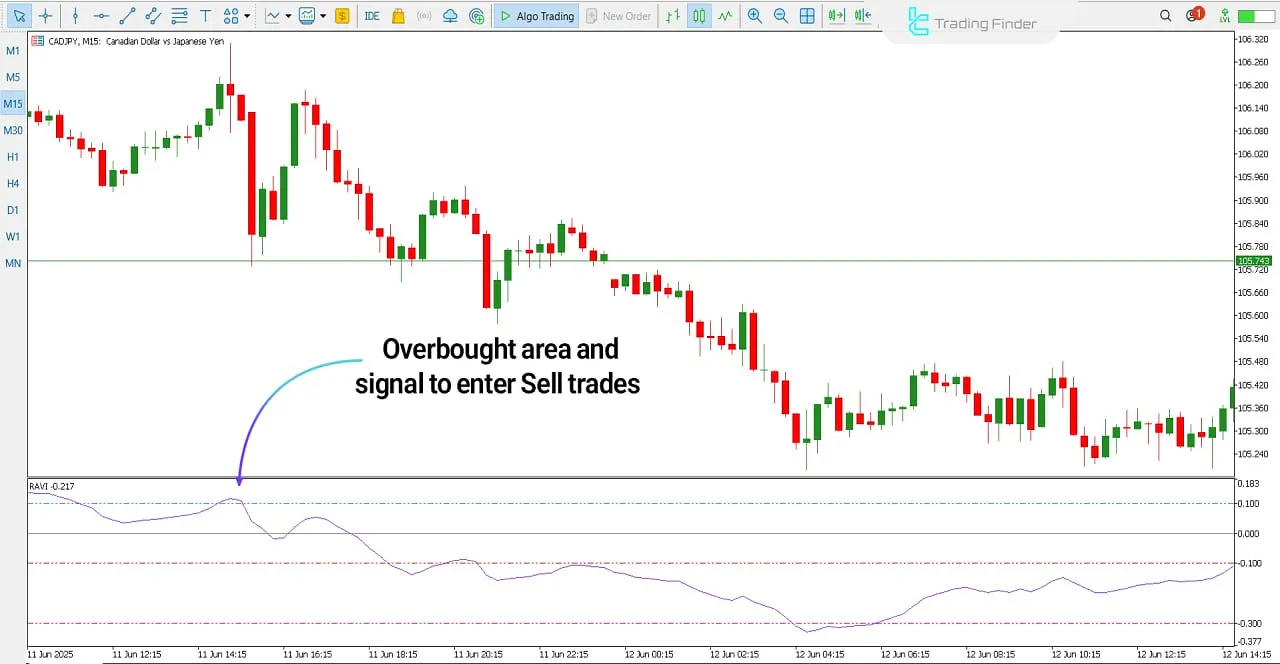
RAVI in a Bearish Trend
The chart below shows the CAD/JPY currency pair on a 15-minute timeframe. When the RAVI signal line crosses from above to below the zero axis, this movement can indicate a weakening of the bullish trend and the beginning of a bearish trend, thus providing a signal for short trade entries.
RAVI Indicator Settings
The RAVI Indicator Settings Panel is shown in the image below:
- FastMethod: Fast moving average method;
- FastLength: Fast moving average period;
- FastPhase: Fast moving average phase;
- SlowMethod: Slow moving average method;
- SlowLength: Slow moving average period;
- SlowPhase: Slow moving average phase;
- IPC: Input price for calculation;
- Shift: Offset.
Conclusion
The RAVI Indicator is a practical tool in technical analysis used for identifying market trend directions, detecting new trends, and signaling potential overbought or oversold conditions.
RAVI MT5 PDF
RAVI MT5 PDF
Click to download RAVI MT5 PDFCan the RAVI indicator be used alongside other indicators?
Yes; the RAVI Indicator is often used in combination with indicators like RSI, MACD, or EMA.
Can RAVI be used to detect overbought or oversold zones?
Yes; when the indicator value reaches extreme high or low levels, it may signal an overbought or oversold condition.


