![Renko Chart indicator for MT5 Download - Free - [TradingFinder]](https://cdn.tradingfinder.com/image/120193/13-9-en-renko-mt5-1.webp)
![Renko Chart indicator for MT5 Download - Free - [TradingFinder] 0](https://cdn.tradingfinder.com/image/120193/13-9-en-renko-mt5-1.webp)
![Renko Chart indicator for MT5 Download - Free - [TradingFinder] 1](https://cdn.tradingfinder.com/image/120208/13-9-en-renko-mt5-2.webp)
![Renko Chart indicator for MT5 Download - Free - [TradingFinder] 2](https://cdn.tradingfinder.com/image/120204/13-9-en-renko-mt5-3.webp)
![Renko Chart indicator for MT5 Download - Free - [TradingFinder] 3](https://cdn.tradingfinder.com/image/120207/13-9-en-renko-mt5-4.webp)
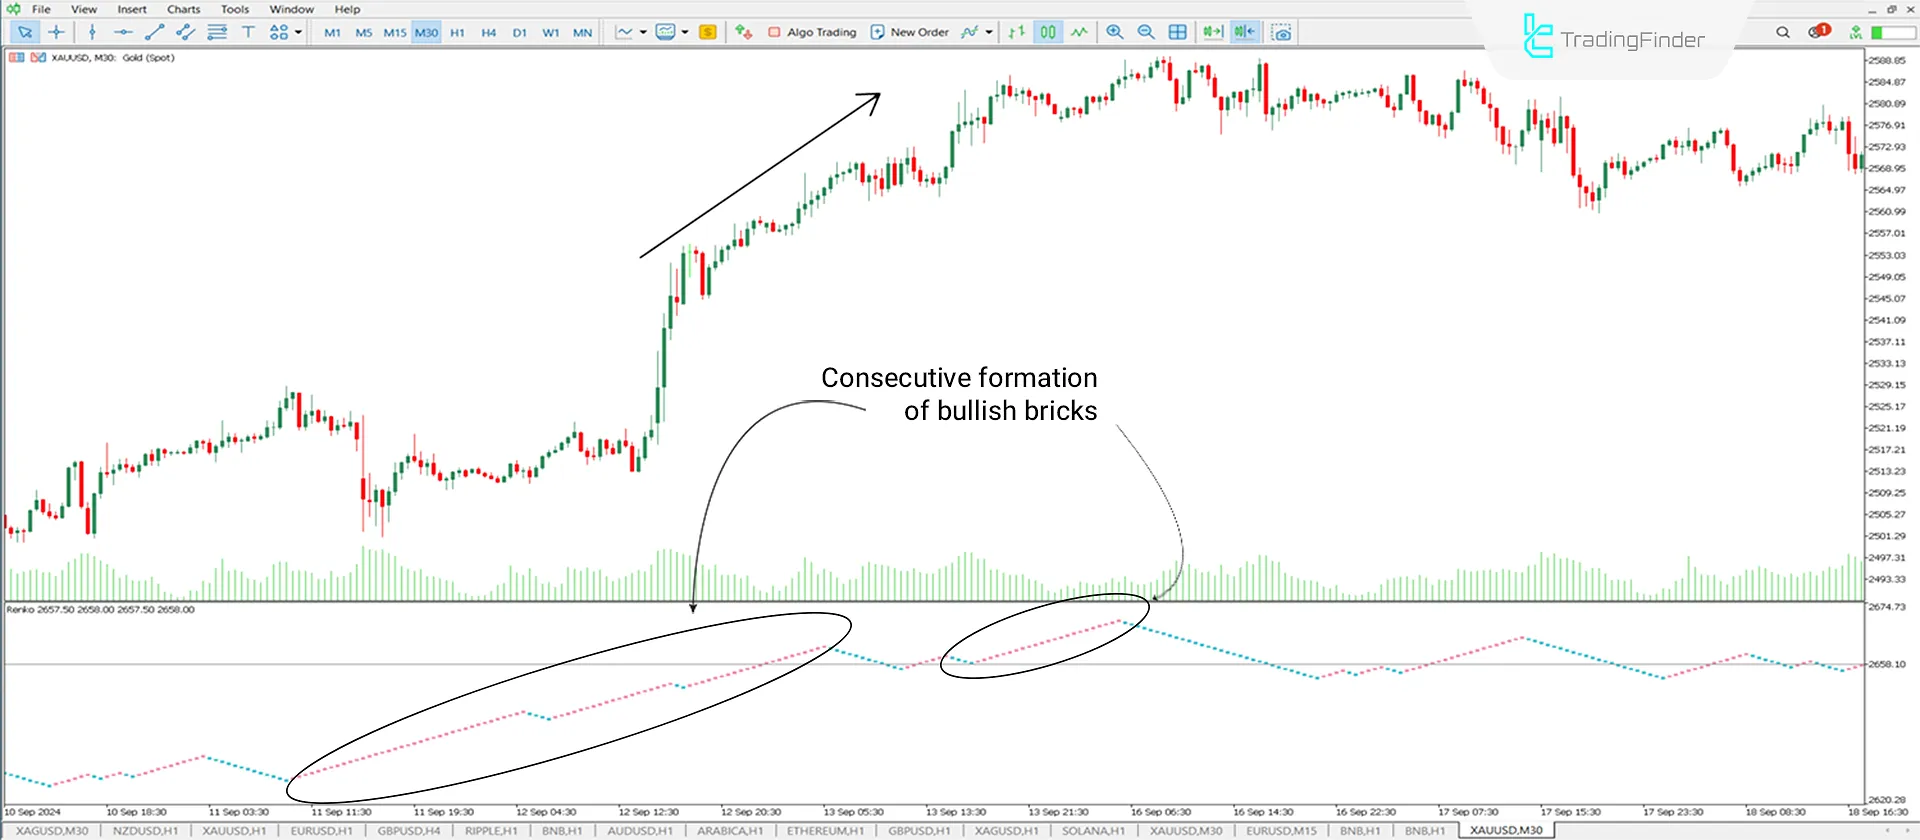
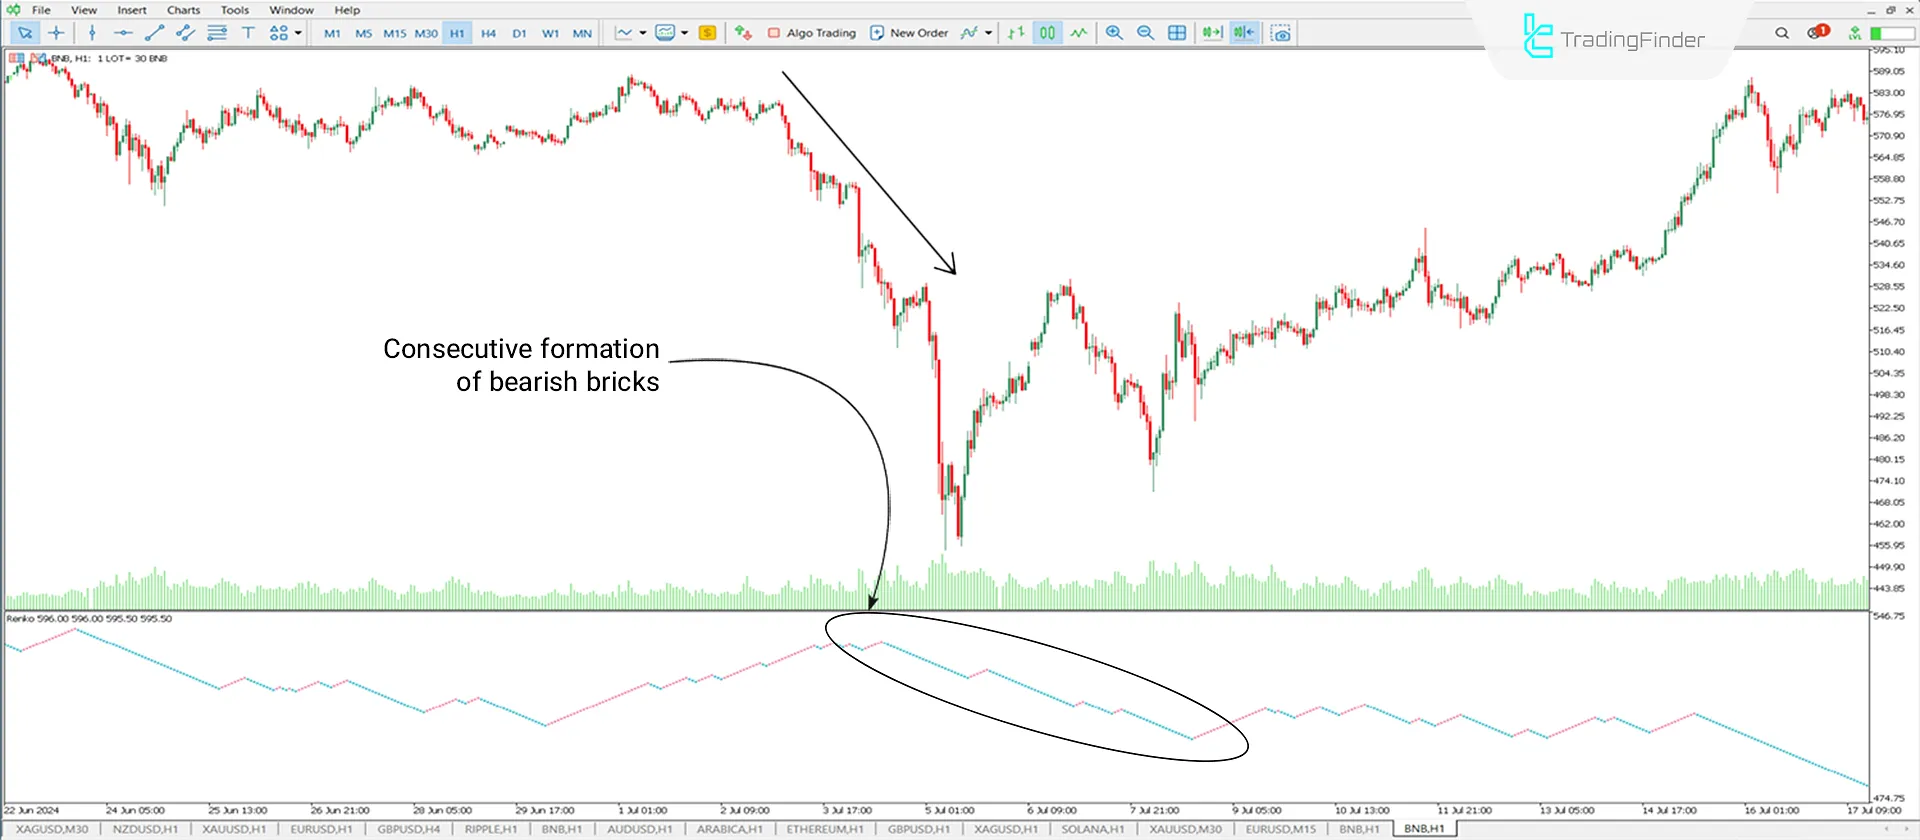
The Renko Chart indicator is one of the indicators available. This MetaTrader 5 oscillator provides traders with a Renko bricks chart representing specific price movements. It removes the noise of price trends and plots price movements based on predetermined amounts simply and clearly. A series of red bricks indicates buying pressure, while a series of blue bricks indicates selling pressure.
Indicator Specifications Table
Indicator Categories: | Oscillators MT5 Indicators Support & Resistance MT5 Indicators Levels MT5 Indicators |
Platforms: | MetaTrader 5 Indicators |
Trading Skills: | Elementary |
Indicator Types: | Reversal MT5 Indicators |
Timeframe: | M1-M5 Timeframe MT5 Indicators H1-H4 Timeframe MT5 Indicators |
Trading Style: | Day Trading MT5 Indicators |
Trading Instruments: | Forex MT5 Indicators Crypto MT5 Indicators Stock MT5 Indicators Commodity MT5 Indicators Indices MT5 Indicators Forward MT5 Indicators Share Stock MT5 Indicators |
Overview of the Indicator
This trading tool chart removes the time factor and uses extracted price data to form Renko bricks. This feature makes it easy to identify Support and Resistance levels that may be difficult to spot on standard charts. Using Renko brick charts alongside price charts provides traders with a broader perspective.
Performance of the Renko Brick Chart in an Uptrend
The 30-minute price chart of Gold against the US Dollar (XAU/USD) shows how the indicator performs in uptrend conditions. As shown in the image, a Renko brick is formed whenever the price fluctuates by the predetermined amount. In an uptrend, if the bricks are formed higher than the previous ones consecutively, it indicates buying pressure and the continuation of the uptrend.

Performance of the Renko Brick Chart in a Downtrend
The 1-hour price chart of the cryptocurrency Binance Coin (BNB) shows how the indicator performs in downtrend conditions. As shown in the image, a Renko brick is formed whenever the price fluctuates by the predetermined amount. In a downtrend, if the bricks are formed lower than the previous ones consecutively, it indicates selling pressure and the continuation of the downtrend.

Settings

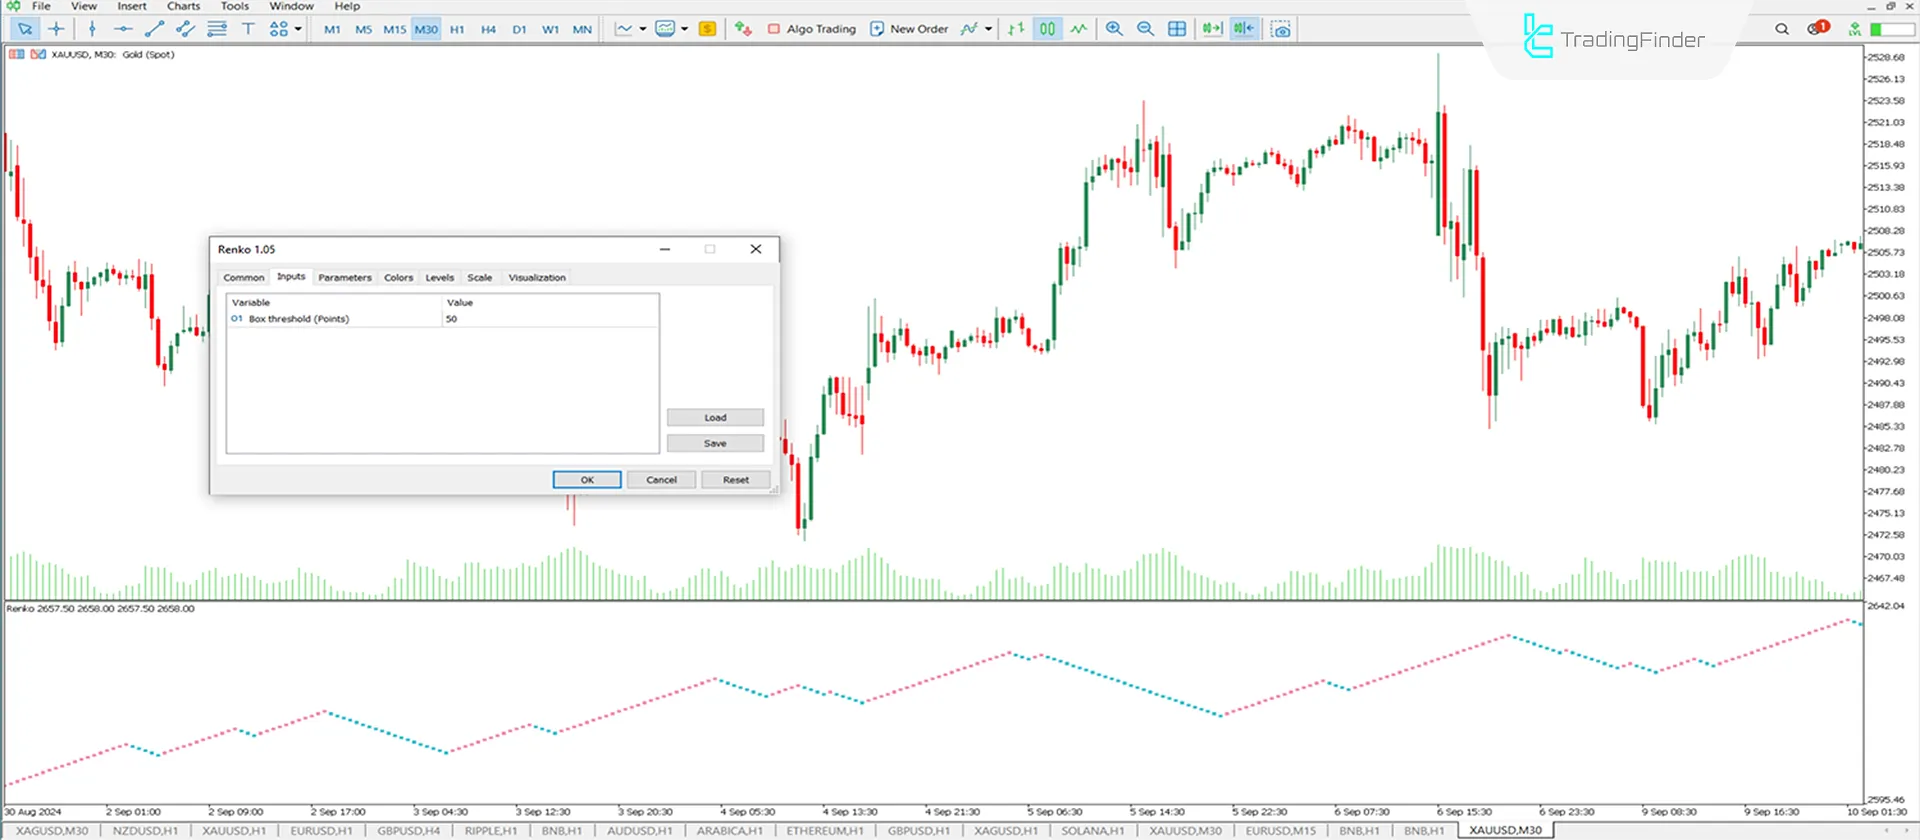
- Box Threshold: The threshold required for forming a brick is 55.
Conclusion
The Renko Brick Chart indicator is a useful tool. This indicator removes the time factor and uses price data to provide traders with a simple and clear chart. Using this indicator alongside price charts and other trading tools helps traders analyze price movements more effectively.
This trading tool is also suitable for use in various markets, including cryptocurrencies, forex, stocks, and commodities.
Renko Chart indicator MT5 PDF
Renko Chart indicator MT5 PDF
Click to download Renko Chart indicator MT5 PDFWhat is the appropriate skill level for using this indicator?
Due to its simplicity, this indicator is suitable for all traders, regardless of their skill level.
What is the suitable time frame for using this indicator?
This indicator is suitable for use in time frames ranging from 5 minutes to 1 day.


