![Super Arrow Indicator for MetaTrader5 Download - Free - [TF Lab]](https://cdn.tradingfinder.com/image/105107/10-3-en-super-arrow-mt5.webp)
![Super Arrow Indicator for MetaTrader5 Download - Free - [TF Lab] 0](https://cdn.tradingfinder.com/image/105107/10-3-en-super-arrow-mt5.webp)
![Super Arrow Indicator for MetaTrader5 Download - Free - [TF Lab] 1](https://cdn.tradingfinder.com/image/29949/10-03-en-super-arrow-mt5-02.avif)
![Super Arrow Indicator for MetaTrader5 Download - Free - [TF Lab] 2](https://cdn.tradingfinder.com/image/29955/10-03-en-super-arrow-mt5-03.avif)
![Super Arrow Indicator for MetaTrader5 Download - Free - [TF Lab] 3](https://cdn.tradingfinder.com/image/29960/10-03-en-super-arrow-mt5-04.avif)
On June 22, 2025, in version 2, alert/notification functionality was added to this indicator
The Super Arrow indicator is part of the MetaTrader 5 indicator series, which combines signals from multiple indicators to provide the most likely signals for reversal points and pivot highs and lows.
This combination includes the RSI, Bollinger Bands, Moving Average, and Magic Filter indicators, identifying lows with green arrows and highs with red arrows.
Indicator Table
Indicator Categories: | Pivot Points & Fractals MT5 Indicators Signal & Forecast MT5 Indicators Trading Assist MT5 Indicators |
Platforms: | MetaTrader 5 Indicators |
Trading Skills: | Elementary |
Indicator Types: | Lagging MT5 Indicators Reversal MT5 Indicators |
Timeframe: | M15-M30 Timeframe MT5 Indicators H1-H4 Timeframe MT5 Indicators |
Trading Style: | Swing Trading MT5 Indicators Intraday MT5 Indicators Day Trading MT5 Indicators |
Trading Instruments: | Forex MT5 Indicators Crypto MT5 Indicators Indices MT5 Indicators Binary Options MT5 Indicators |
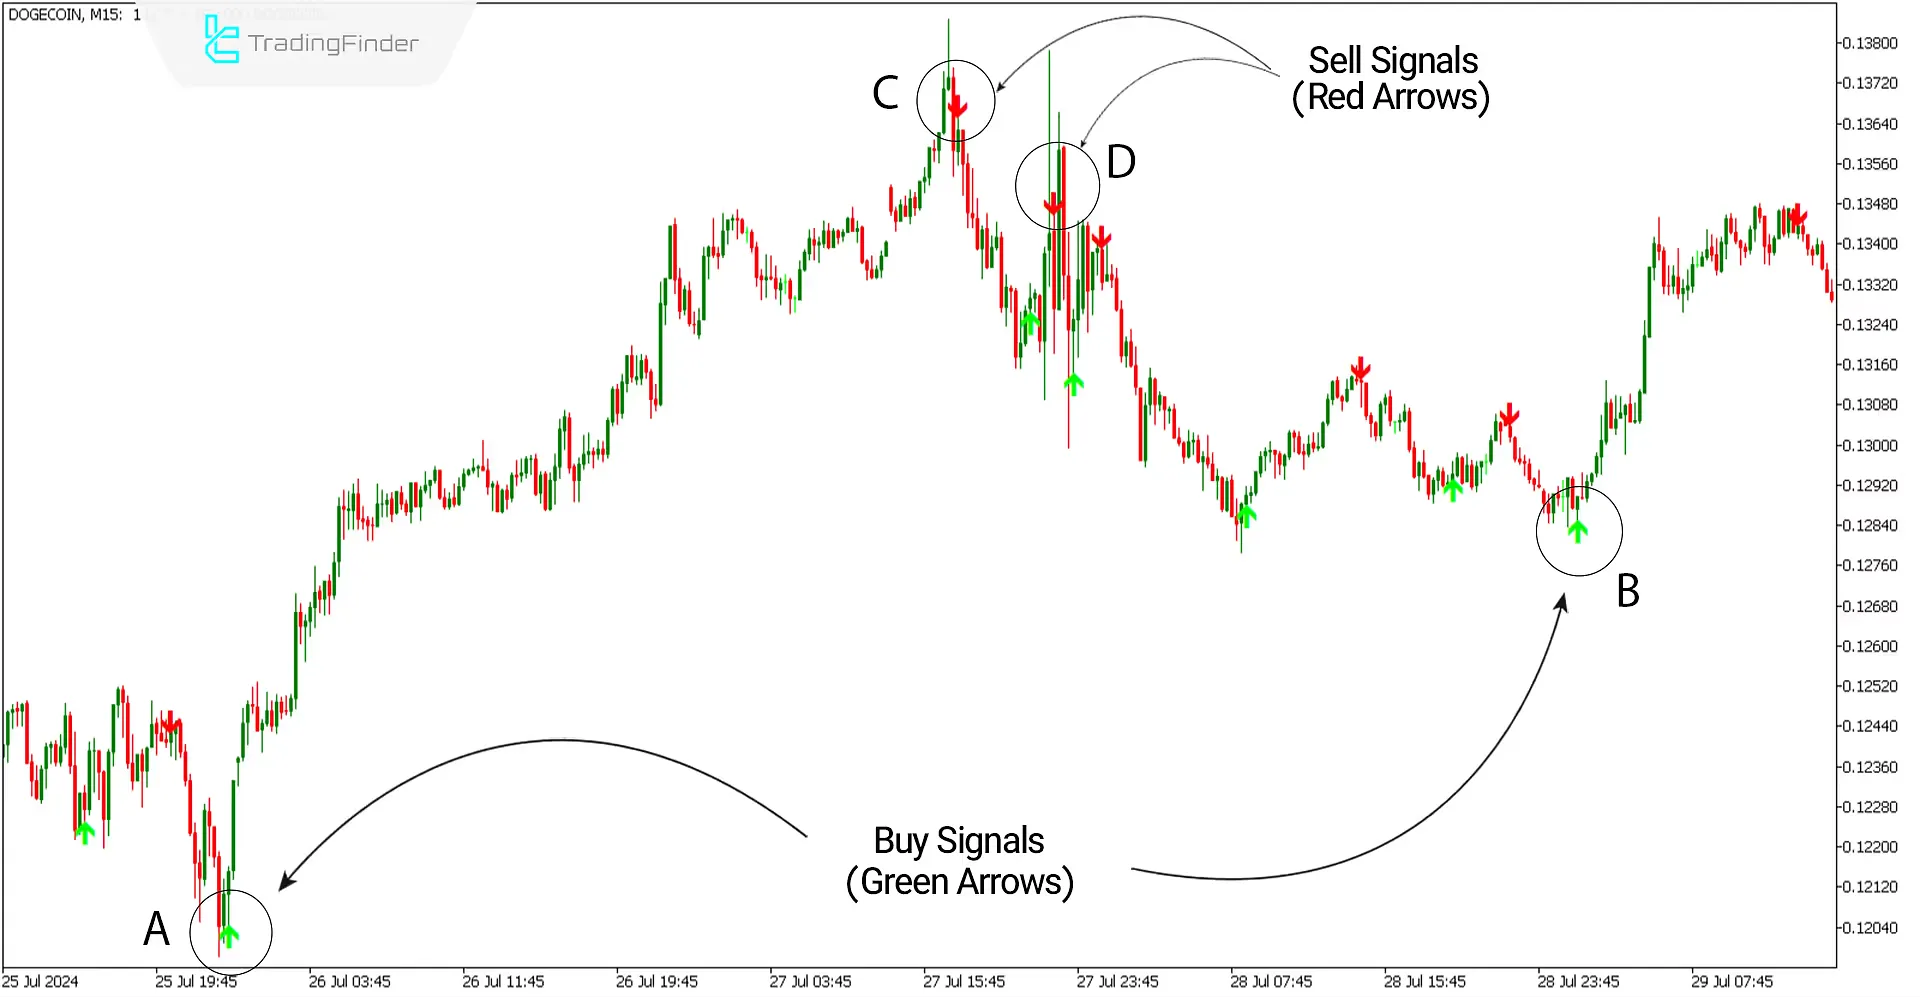
In the displayed image, the 15-minute price chart of Dogecoin with the symbol [DOGECOIN] shows points A and B as swing lows, where the indicator has issued buy signals (Buy) with green arrows.
Additionally, points C and D represent swing highs, where the indicator has issued sell signals (Sell) with red arrows.

Overview
When different indicators issue conflicting signals simultaneously, traders can confuse their decision-making, leading to significant risks in their trades.
To mitigate this, combining multiple indicators can help filter out false signals, resulting in more reliable trades.
The Super Arrow indicator identifies potential lows (valleys) with a green arrow when the upcoming trend is bullish, and multiple indicators show buy signals.
Similarly, it marks potential highs (peaks) with a red arrow when the future market trend is bearish and multiple sell signals are present.
This approach helps traders make more informed decisions by focusing on the most probable points for trend reversals.
Buy Signals (Uptrends)
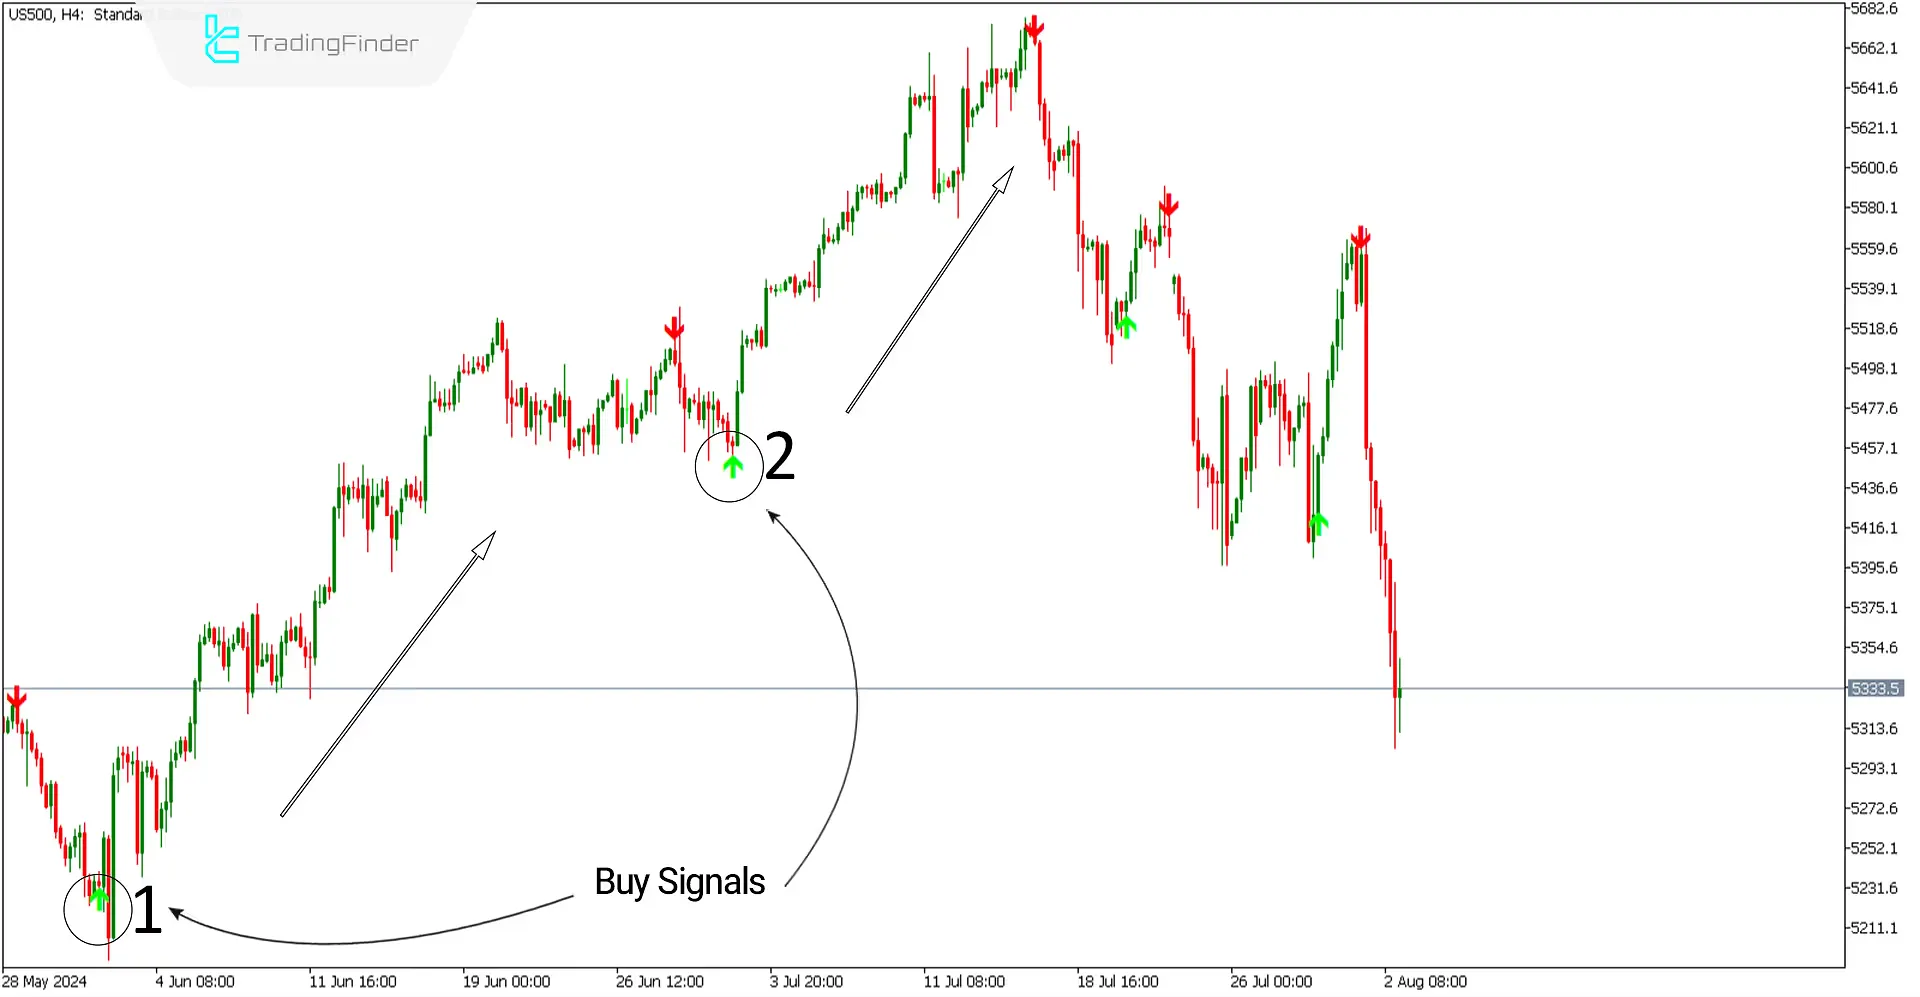
The image below shows the 4-hour chart of the S&P 500 index with the symbol (US500). The indicator has identified the major valleys at points 1 and 2, which are vital starting points for trends, and marked these with green arrows as buy signals (Buy).
With the appearance of these buy signals, traders can prepare to enter a buy position by considering support levels (Support) and confirmations such as candlestick patterns, classic patterns, chart patterns, trend lines, and channels.

Sell Signals (Downtrends)
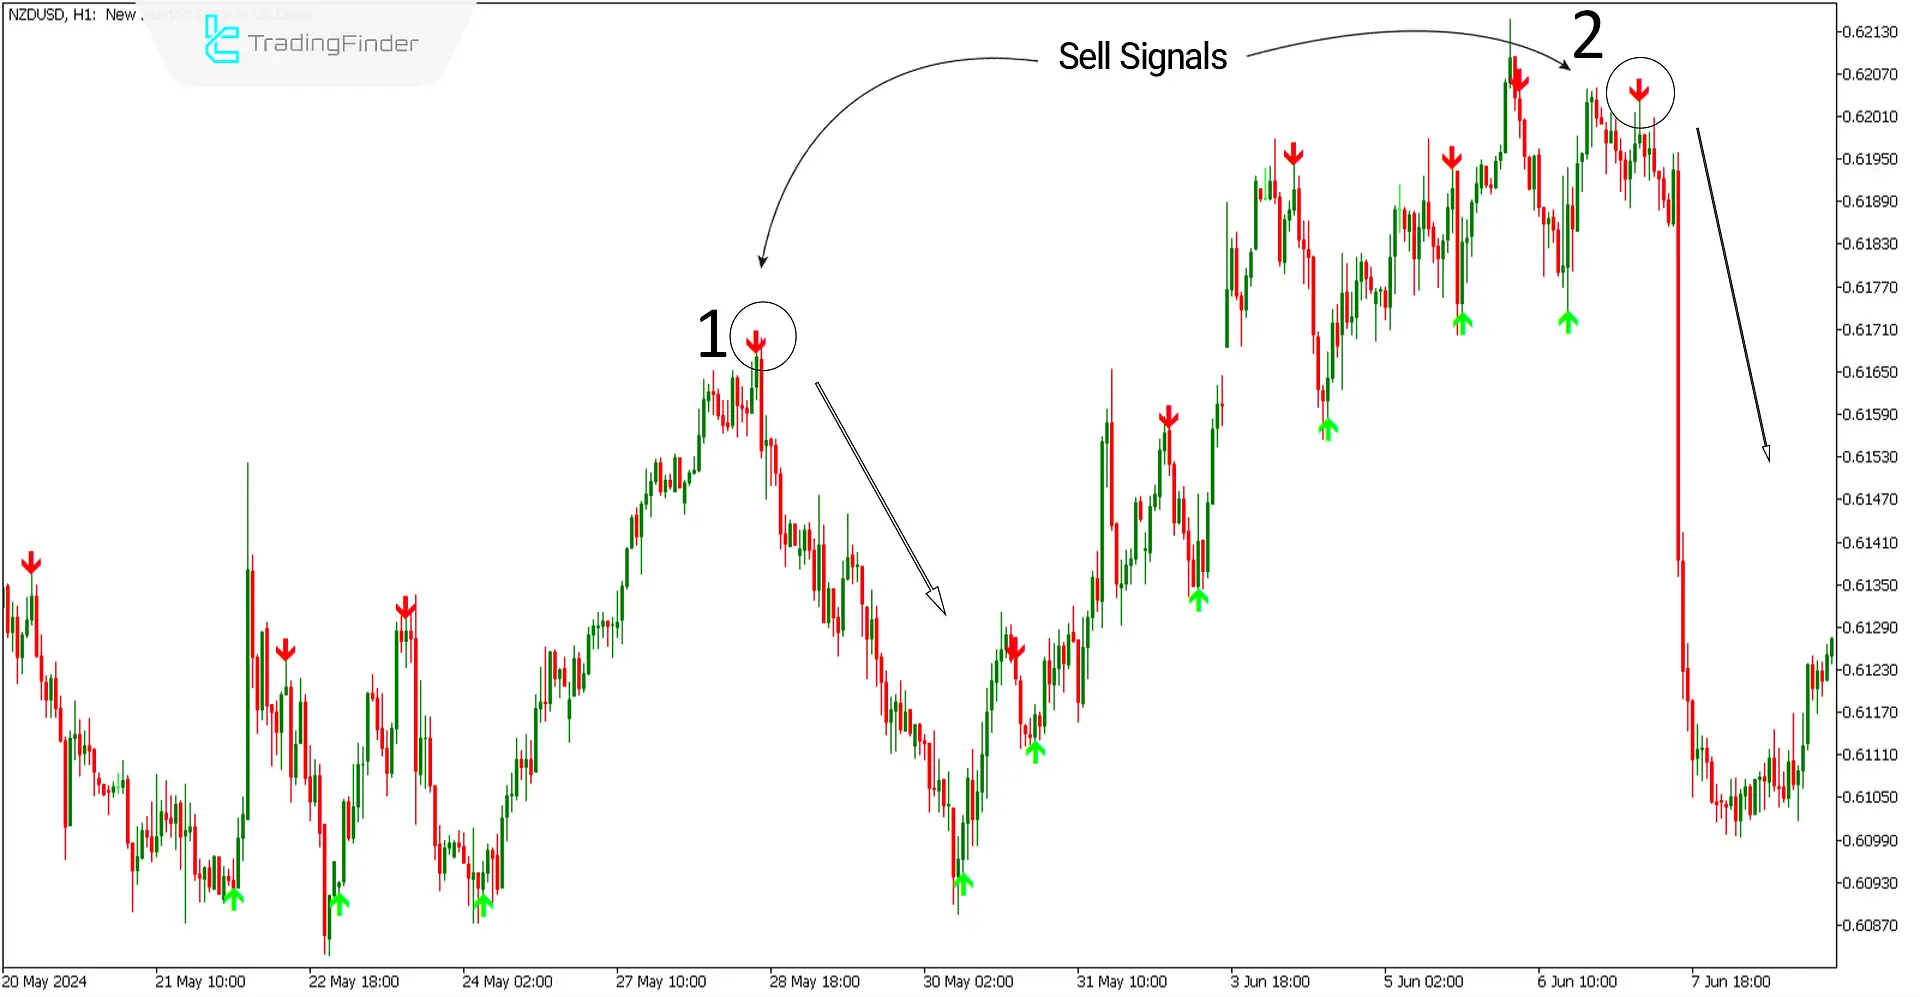
The image below displays the 1-hour chart of the NZD/USD currency pair.
The Binary indicator has identified the major peaks at key trend initiation points at major pivots 1 and 2. At the highs where the MT5 Signal and Forecast indicator has displayed a red arrow, there is potential for a price reversal, and it has issued a sell signal (Sell).
Utilizing trend lines, static resistance levels, and reversal patterns can help confirm these sell signals provided by the indicator.

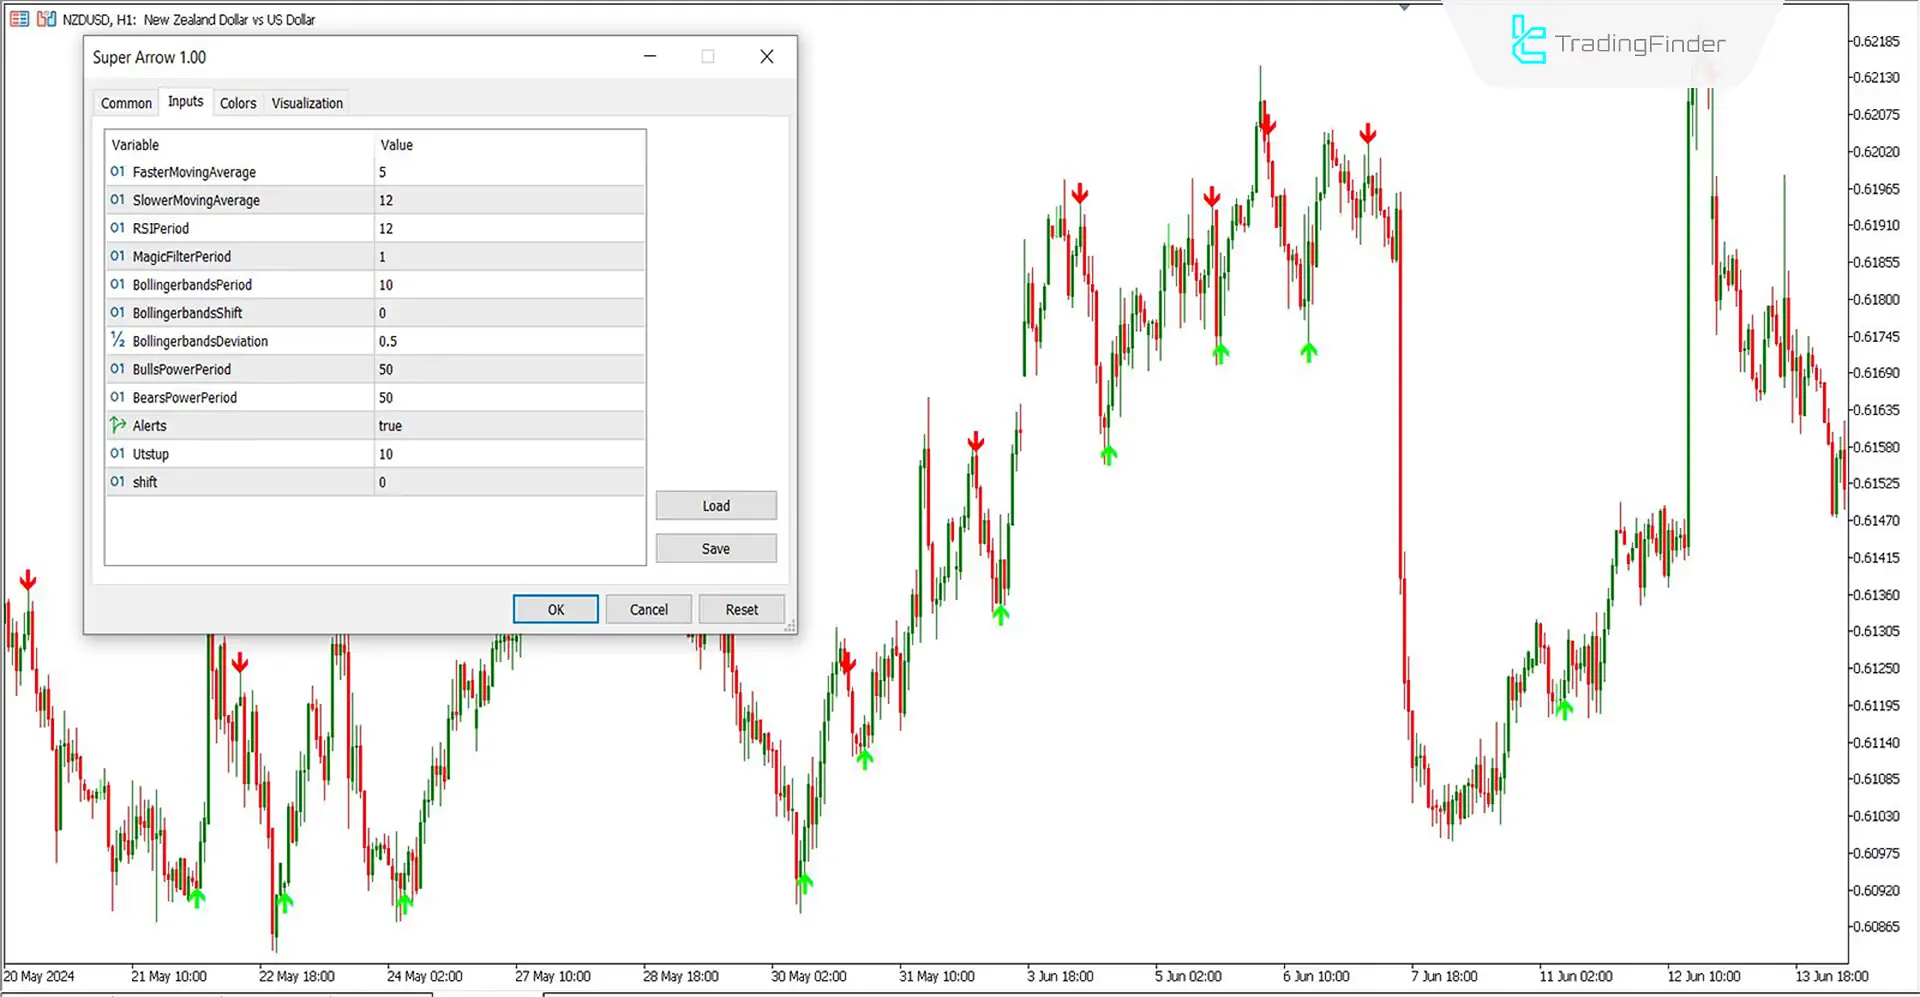
Settings of the Super Arrow Indicator

- FasterMovingAverage: Set the fast moving average to 5;
- SlowerMovingAverage: Set the slow moving average to 12;
- RSIPeriod: The time period for the RSI indicator should be 12;
- MagicFilterPeriod: Set the time period for the Magic Filter indicator to 1;
- BollingerbandsPeriod: The time period for Bollinger Bands is 10;
- BollingerbandsShift: The shift for Bollinger Bands is set to zero;
- BollingerbandsDeviation: Set the deviation for Bollinger Bands to 0.5;
- BullsPowerPeriod: The time period for the Bulls Power indicator is 50;
- BearsPowerPeriod: The time period for the Bears Power indicator is 50;
- Alerts: Set the indicator alerts to True;
- Utstup: Set the number to 10;
- Shift: The shift of the indicator is set to zero.
Conclusion
Identifying lows and highs (valleys and peaks) is the primary goal for traders in financial markets.
By leveraging signals from various indicators, the Super Arrow indicator can identify points with the highest potential to become major and critical market lows and highs.
It can be used across all financial markets and different timeframes. It is also recommended to combine its signals with other analytical tools, such as price channels, regression channels, Fibonacci levels, and divergences, for more robust trading decisions.
Super Arrow MT5 PDF
Super Arrow MT5 PDF
Click to download Super Arrow MT5 PDFWhat distinguishes the Super Arrow indicator from other indicators?
The Super Arrow indicator comprises signals from various indicators and can effectively filter out many invalid signals.
Can the Super Arrow indicator issue signal before the trend changes?
No, the signals from this indicator are lagging, and it should be used in conjunction with other analytical tools.
please share the mql4 file
we have it right now
How to set the MA option in programing EA ?
you can adjust setting based on your asset, timeframe & .... best practice is different for each symbol and you need to take time
Hello, can you help with tradingview script please
Hi, we will create TradingView version as soon as possible.
I have recently downloaded the indicator and changed a few settings: FMA 5 SMA 34 RSI 13 MFP 1 and everything else I have left the same. This seems to be fine when looking at past data on M15. The problem I am experiencing is that the signal is painting late and not alerting on M15. I went lower to M5 and M1, it works fine on both. Can you please check what could be wrong? Thank you very much. #Keep up this great work
its fine in other time frames, especially on M15. we will notification or alerts to our indicators and oscillators in near future.
Hello, do you have this indicator for Tradingview? Thank you very much
Hello, we do not have it yet. but we have similar indicators.
This indicator repaints. I noticed the its repeated shifting on M1 and M5 as it subtily adjust itself to precise entry point after price has left such point. Kindly look into this.


