![TSI MACD indicator for MetaTrader 5 Download - Free - [TradingFinder]](https://cdn.tradingfinder.com/image/139077/13-41-en-tsi-macd-mt5-1.webp)
![TSI MACD indicator for MetaTrader 5 Download - Free - [TradingFinder] 0](https://cdn.tradingfinder.com/image/139077/13-41-en-tsi-macd-mt5-1.webp)
![TSI MACD indicator for MetaTrader 5 Download - Free - [TradingFinder] 1](https://cdn.tradingfinder.com/image/139075/13-41-en-tsi-macd-mt5-2.webp)
![TSI MACD indicator for MetaTrader 5 Download - Free - [TradingFinder] 2](https://cdn.tradingfinder.com/image/139076/13-41-en-tsi-macd-mt5-3.webp)
![TSI MACD indicator for MetaTrader 5 Download - Free - [TradingFinder] 3](https://cdn.tradingfinder.com/image/139064/13-41-en-tsi-macd-mt5-34.webp)
The True Strength Index MACD (TSI MACD) indicator combines MACD and TSI to provide a more precise ability to identify momentum strength and trend direction.
This MT5 volatility indicator, with the help of a moving average line and a signal line, assists traders in identifying market depth and assessing trend strength.
It includes an orange signal line and a blue moving average line.
Indicator Specifications Table
Indicator Categories: | Oscillators MT5 Indicators Volatility MT5 Indicators Currency Strength MT5 Indicators MACD Indicators for MetaTrader 5 |
Platforms: | MetaTrader 5 Indicators |
Trading Skills: | Intermediate |
Indicator Types: | Reversal MT5 Indicators |
Timeframe: | Multi-Timeframe MT5 Indicators |
Trading Style: | Intraday MT5 Indicators |
Trading Instruments: | Forex MT5 Indicators Crypto MT5 Indicators Stock MT5 Indicators Commodity MT5 Indicators Indices MT5 Indicators Share Stock MT5 Indicators |
Overview of the TSI MACD Indicator
The classic MACD Oscillator is a key tool for examining the convergence and divergence of moving averages. At the same time, the TSI indicator has a high capacity for displaying the intensity and strength of price movements. The TSI MACD indicator combines these practical and powerful indicators on the price chart for users.
Indicator Performance in an Uptrend
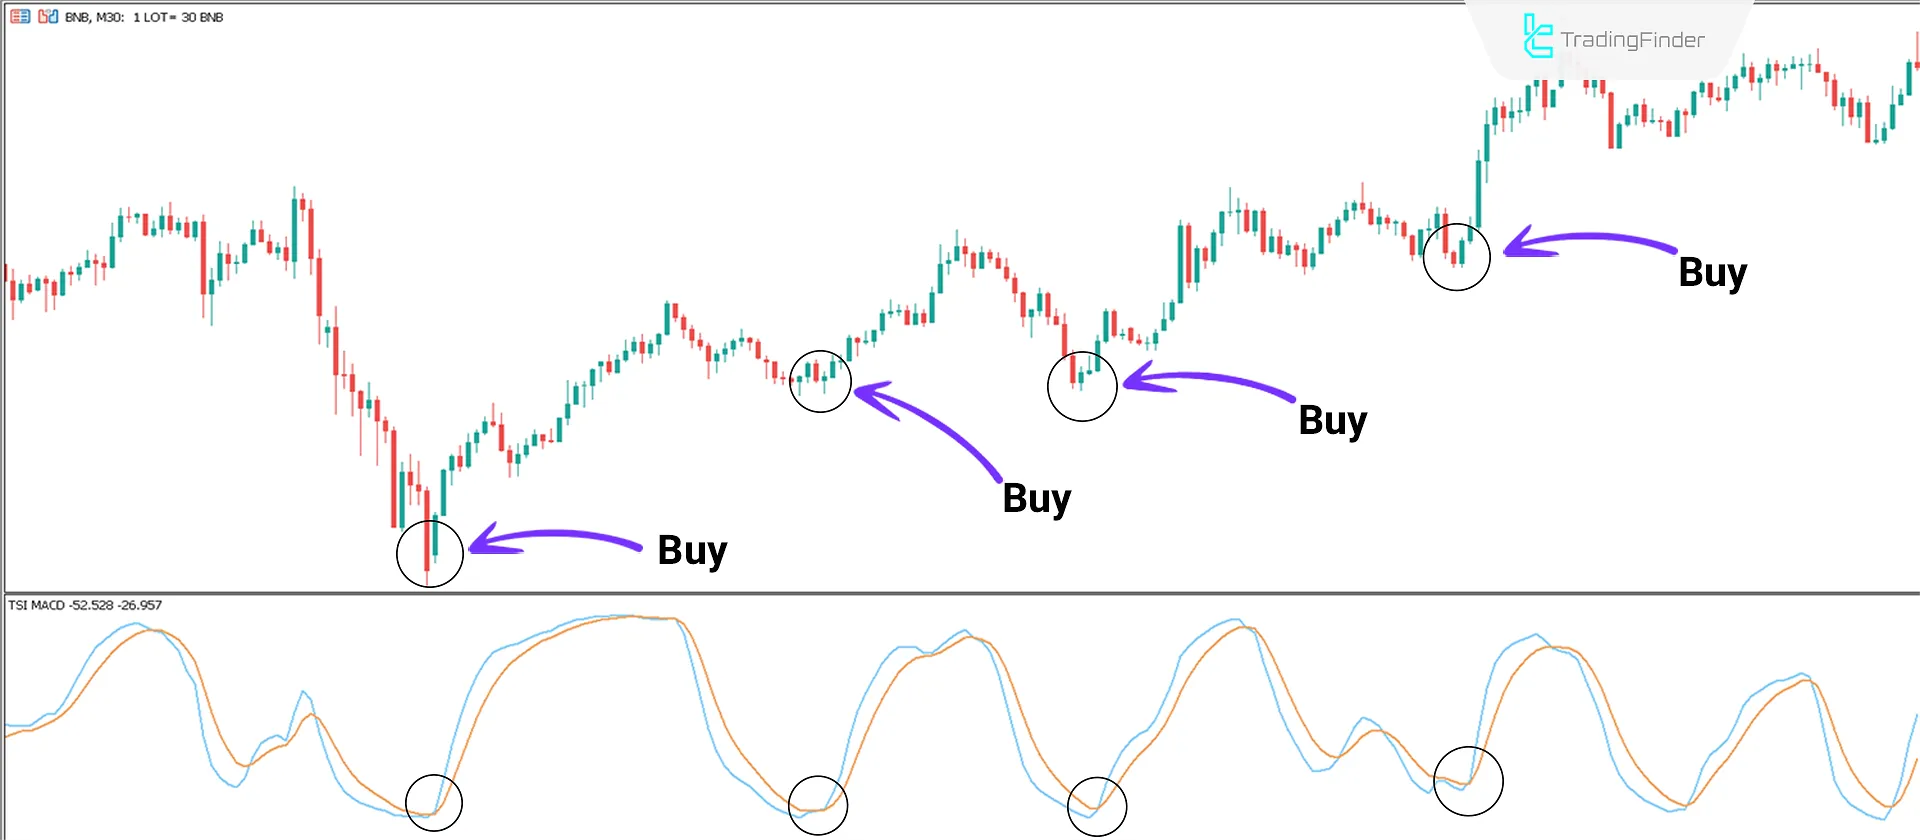
Based on the 30-minute price chart of the cryptocurrency Binance Coin (BNB), the price trend becomes bullish each time the blue line breaks above the signal line (orange line) and oscillates in the positive phase of the oscillator.
Traders can use the intersection point of these two lines as an opportunity to enter a buy position.

Indicator Performance in a Downtrend
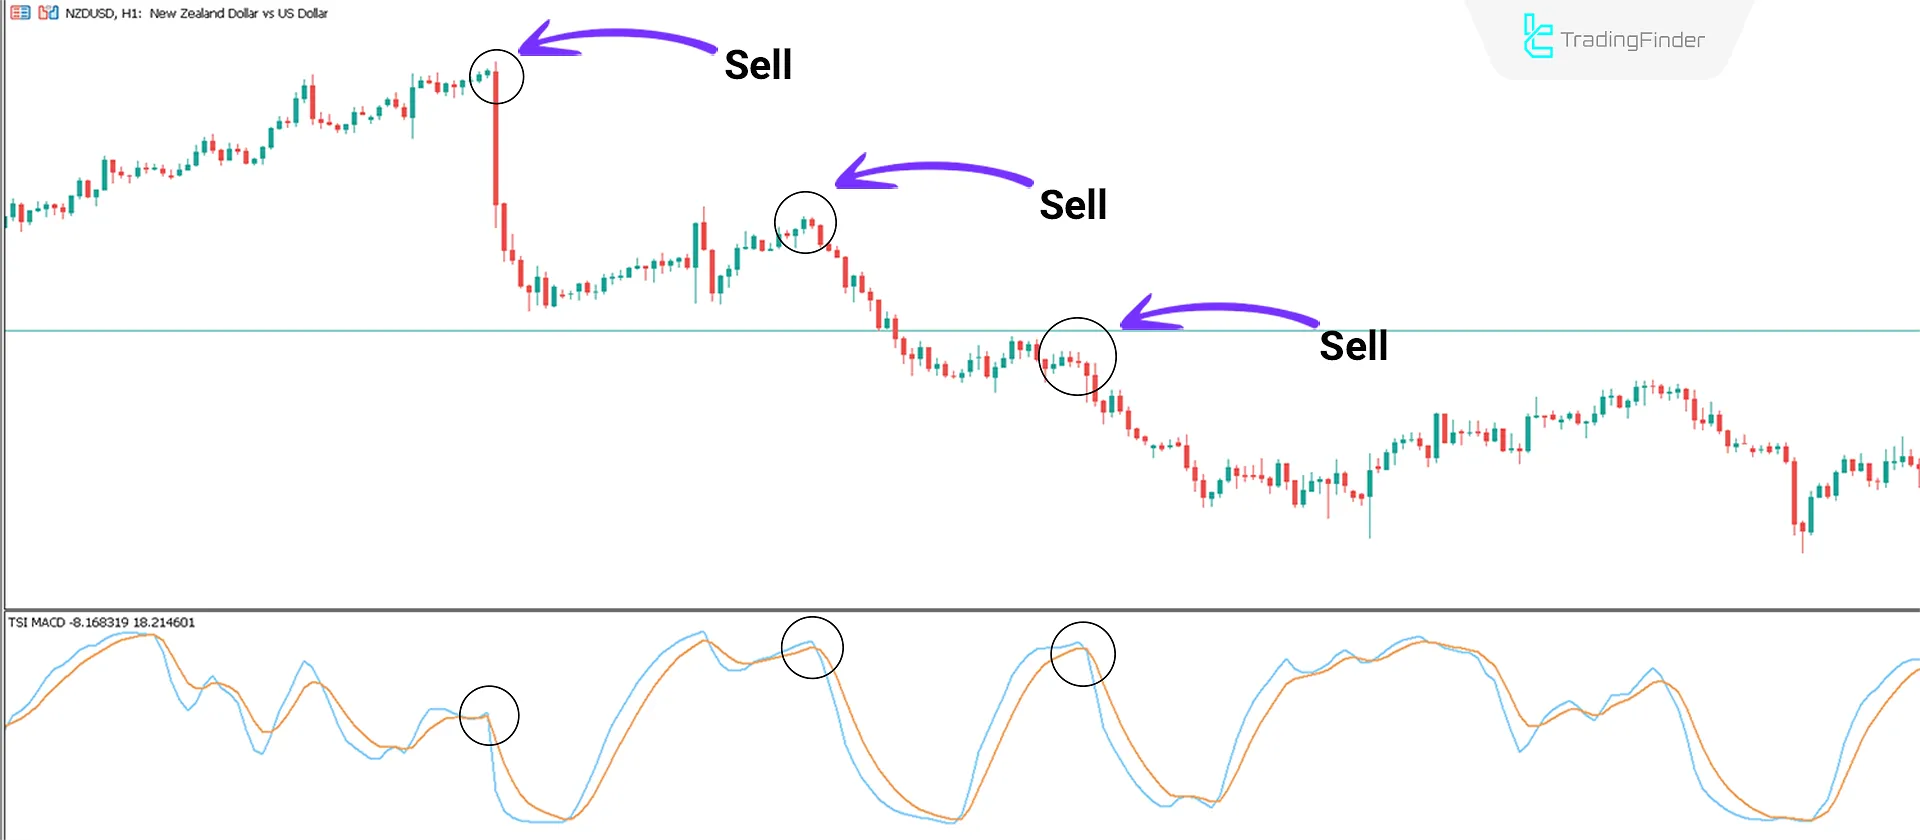
According to the analysis of the NZD/USD currency pair chart in the 1-hour timeframe, the price trend becomes bearish each time the blue line breaks below the signal line (orange line) and oscillates in the negative phase of the oscillator.
In such conditions, traders can use the intersection point of these two lines as an opportunity to enter a sell position.

Indicator Settings

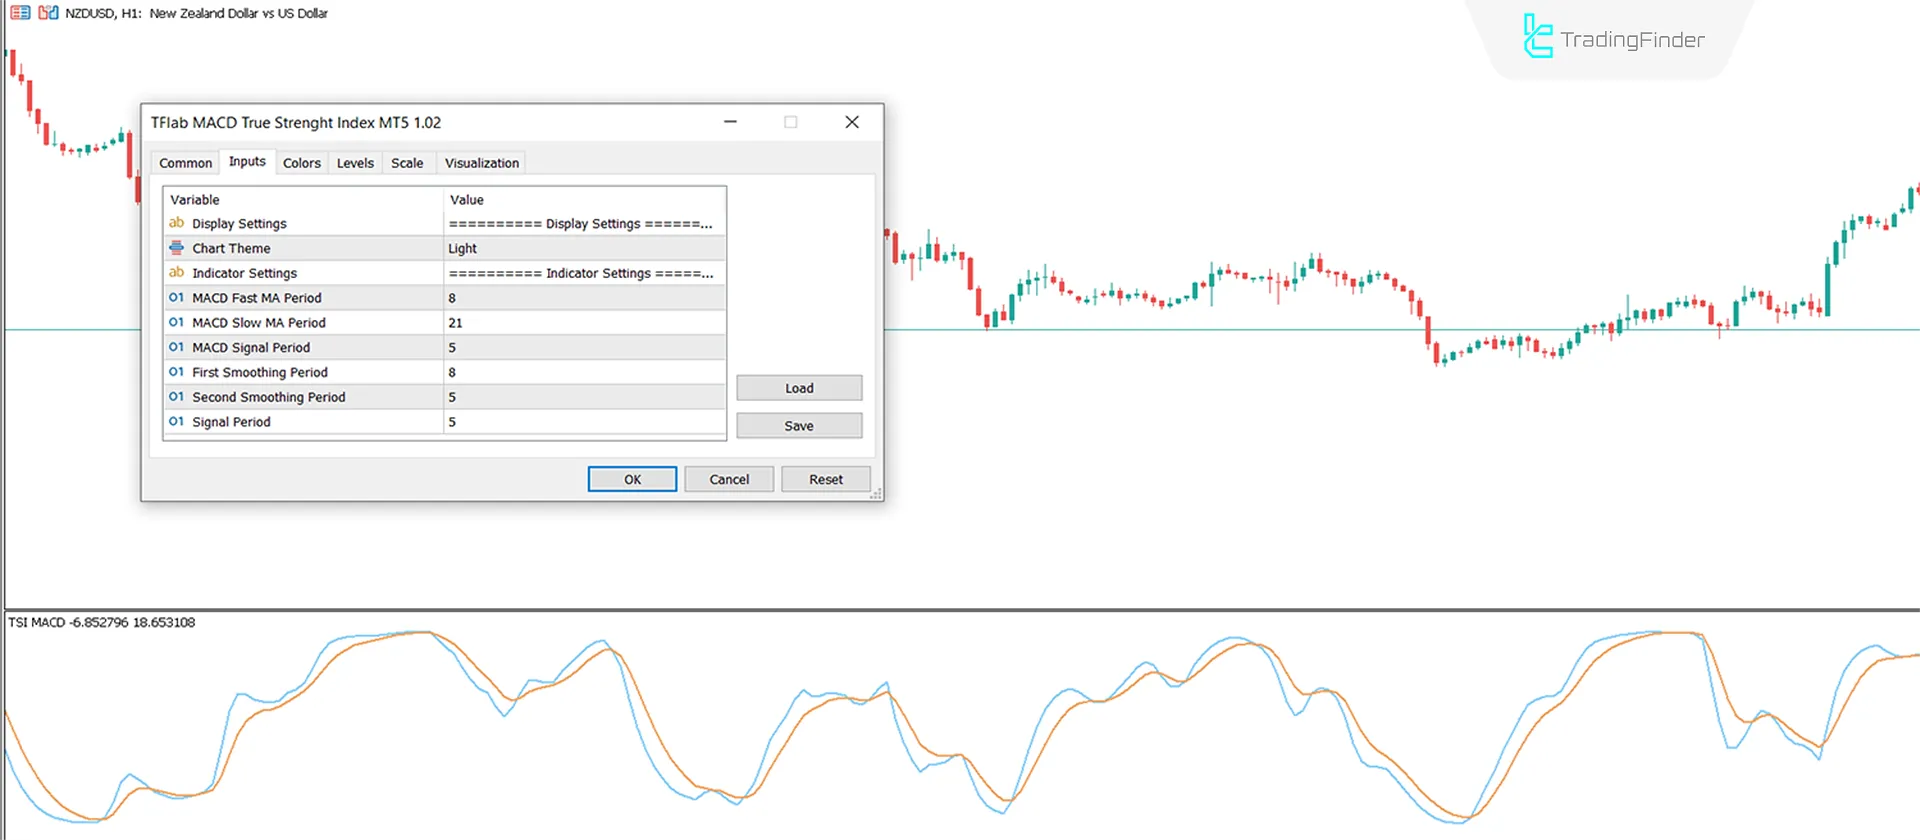
- Chart Theme: Indicator theme;
- Fast MA Period: Fast moving average period calculated as 8;
- Slow MA Period: Slow moving average period calculated as 21;
- Signal Period: Signal period set to 5;
- First Smoothing: Initial smoothing parameter set to 8;
- Second Smoothing: Secondary smoothing parameter set to 5;
- Sig Period: Signal line period set to 5.
Conclusion
The TSI MACD indicator, with the unique properties of both tools, provides more precise signals for identifying potential price changes in the market.
This combination is very effective in analyzing price behavior and evaluating momentum, assisting traders in making more accurate decisions. It is worth noting that this MT5 oscillator operates efficiently in all markets without any restrictions.
TSI MACD indicator MT5 PDF
TSI MACD indicator MT5 PDF
Click to download TSI MACD indicator MT5 PDFWhat time frame is this indicator suitable for?
This indicator is a multi-timeframe and works across all time frames, but it performs best in intraday time frames.
What is the required skill level to use this indicator?
A basic understanding of technical concepts is sufficient to use this indicator.


