


On July 22, 2025, in version 2, alert/notification and signal functionality was added to this indicator
The VWMA Indicator combines price and trading volume to identify market trends and reversals. The VWMA calculation starts by multiplying the closing price of each candlestick by the trading volume for the same period.
Then, the sum of these values is divided by the total trading volume for the specified period.
VWMA Indicator Specifications Table
The table below contains a summary of the information about this indicator:
Indicator Categories: | Support & Resistance MT5 Indicators Volatility MT5 Indicators Trading Assist MT5 Indicators |
Platforms: | MetaTrader 5 Indicators |
Trading Skills: | Intermediate |
Indicator Types: | Lagging MT5 Indicators |
Timeframe: | Multi-Timeframe MT5 Indicators |
Trading Style: | Day Trading MT5 Indicators |
Trading Instruments: | Forex MT5 Indicators Crypto MT5 Indicators Stock MT5 Indicators Share Stock MT5 Indicators |
Indicator Overview
In the VWMA Indicator, blue represents buyers' strength and the formation of an uptrend, while red signifies sellers' dominance and the emergence of a downtrend.
This method gives higher weight to prices with larger volumes, making VWMA more sensitive to changes in trading volume. This feature helps traders accurately examine price changes and correctly identify key market trends.
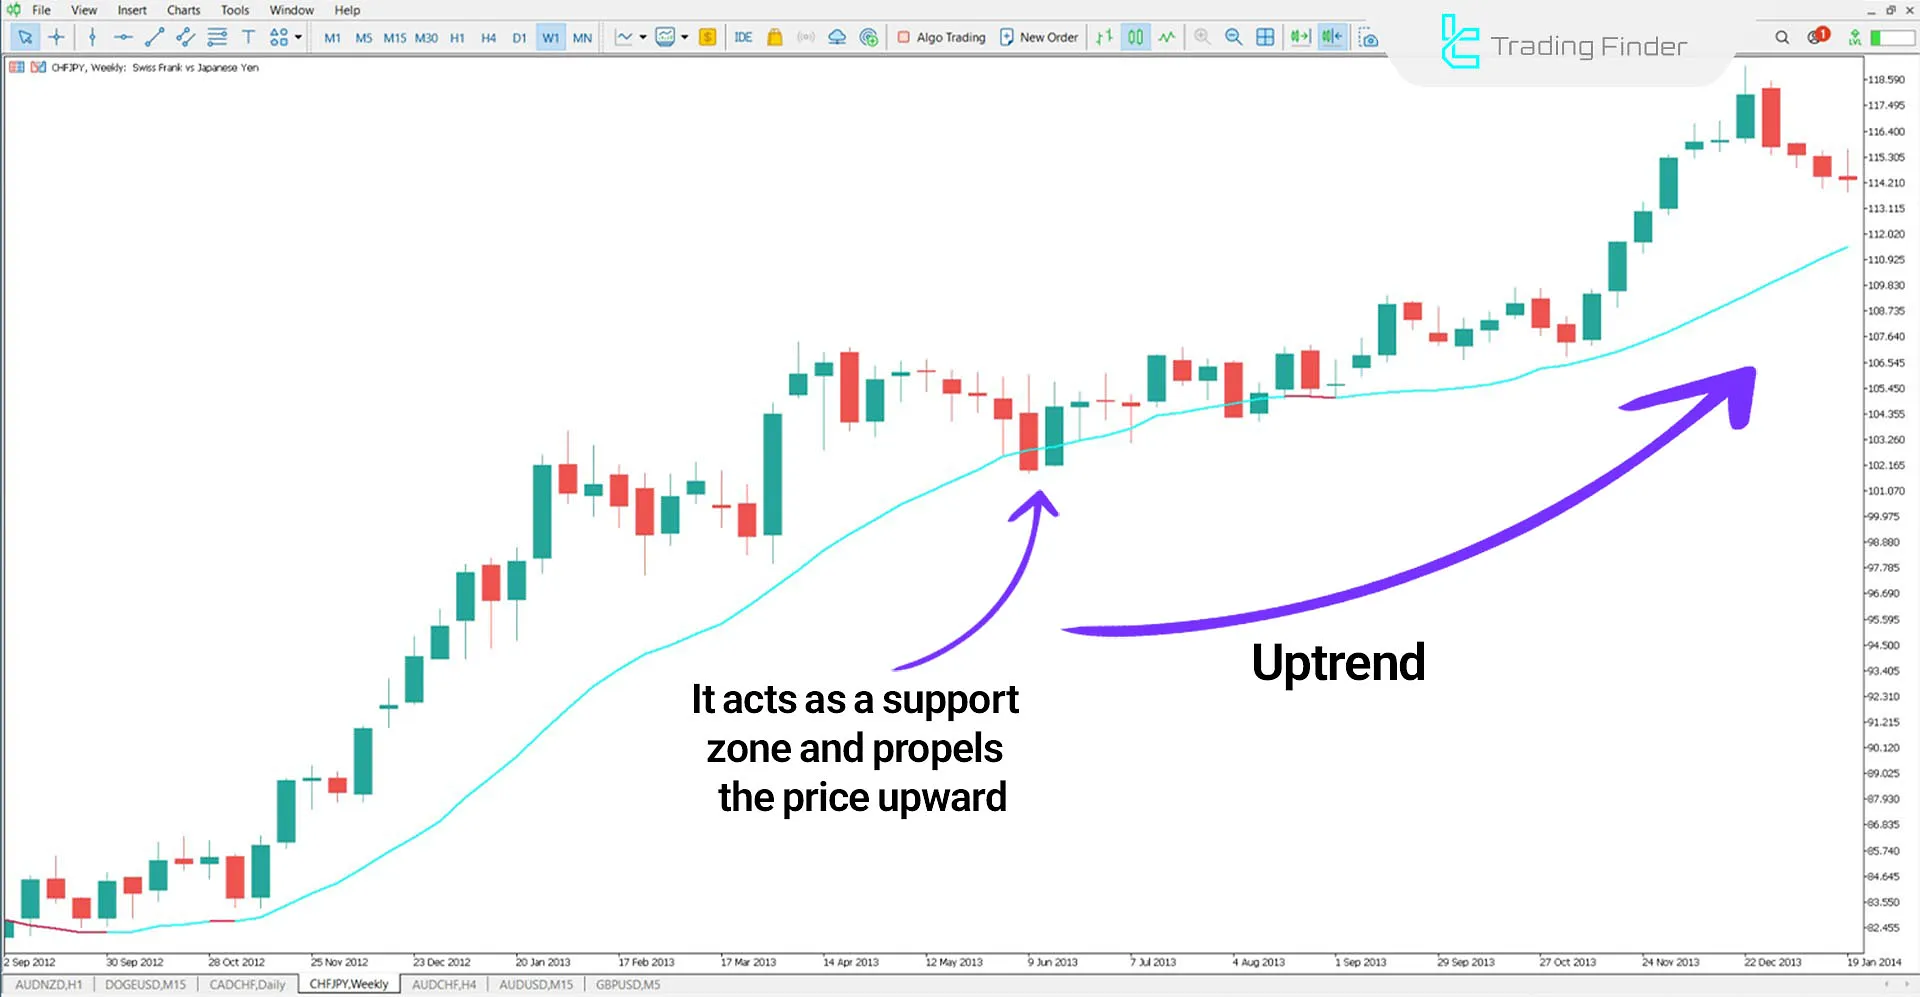
VWMA in an Uptrend
The blue line in this support and resistance indicator represents the uptrend. In the chart below, the indicator clearly identifies the upward trend, and the price uses the line marked by the indicator as a dynamic support.
These zones act as support areas, causing price reversals and upward movements.
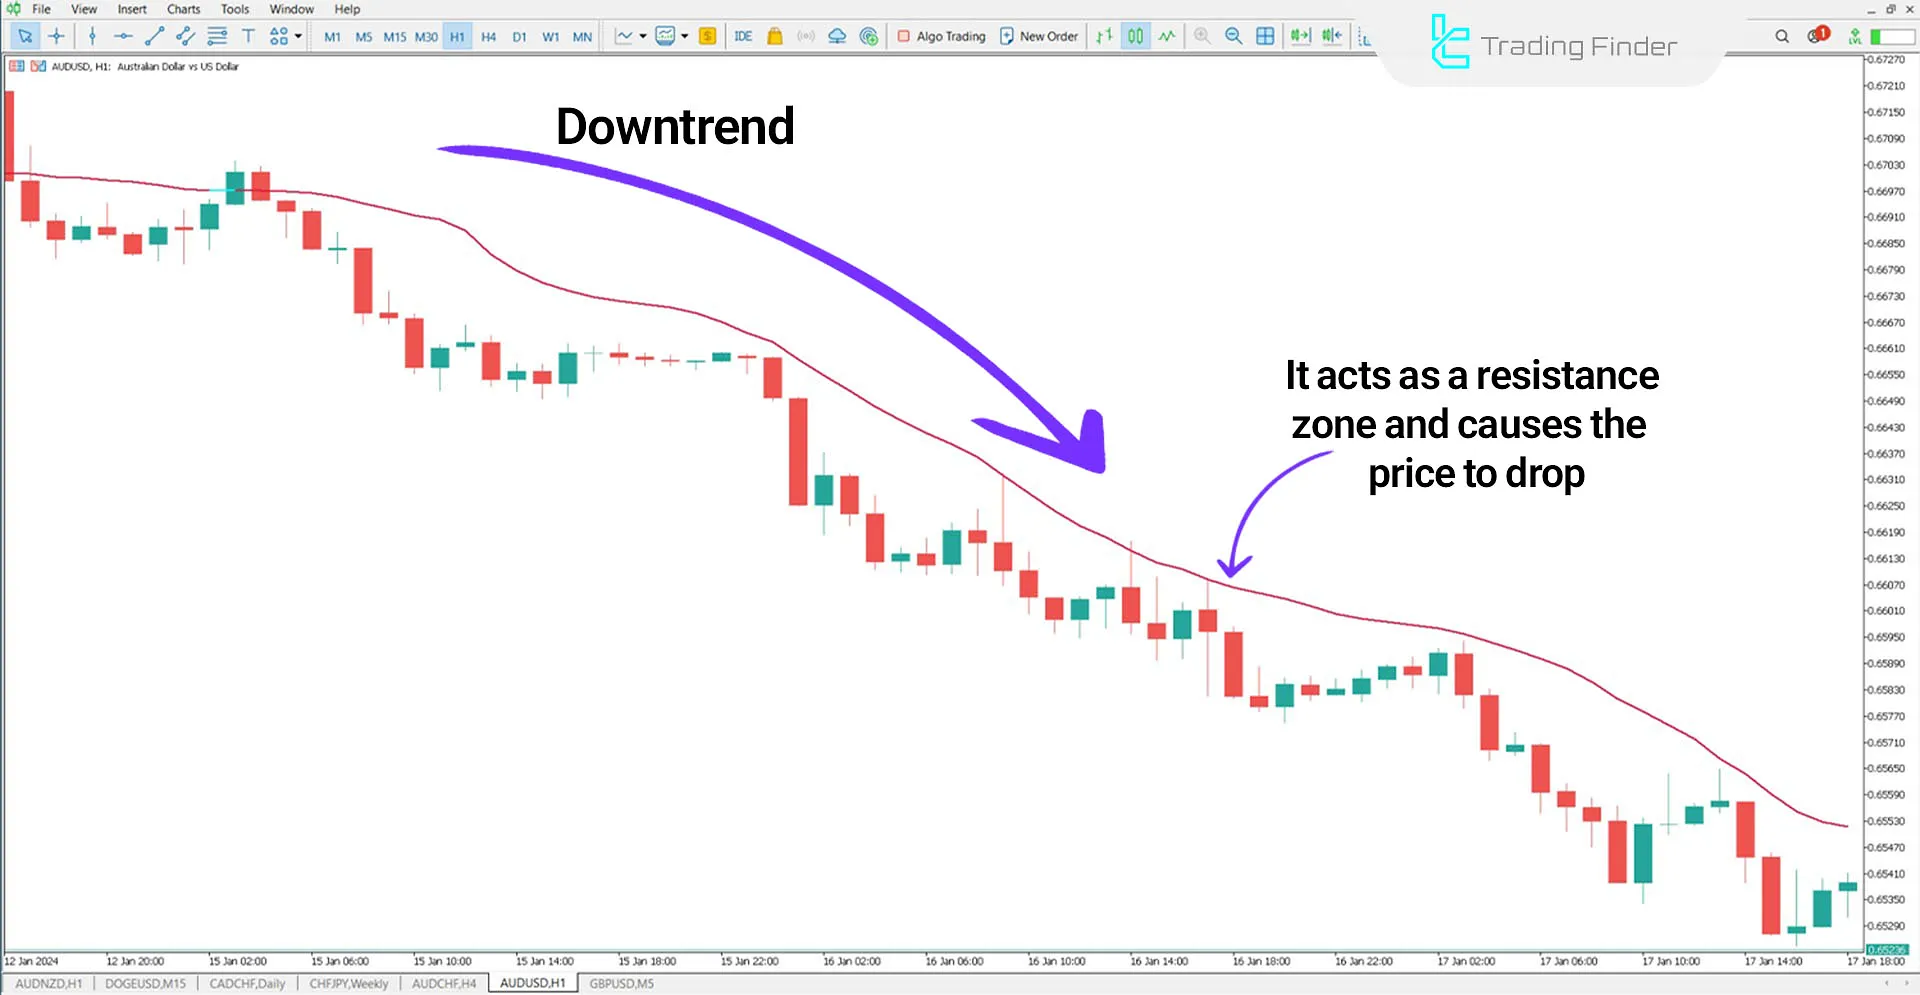
VWMA in a Downtrend
In the price chart for the AUD/USD currency pair on a 1-hour time frame, the red line acts as a dynamic resistance level during a downtrend. When the price touches this line, it reacts and moves downward.
After entering a Sell position, traders can set their stop-loss above this resistance area.
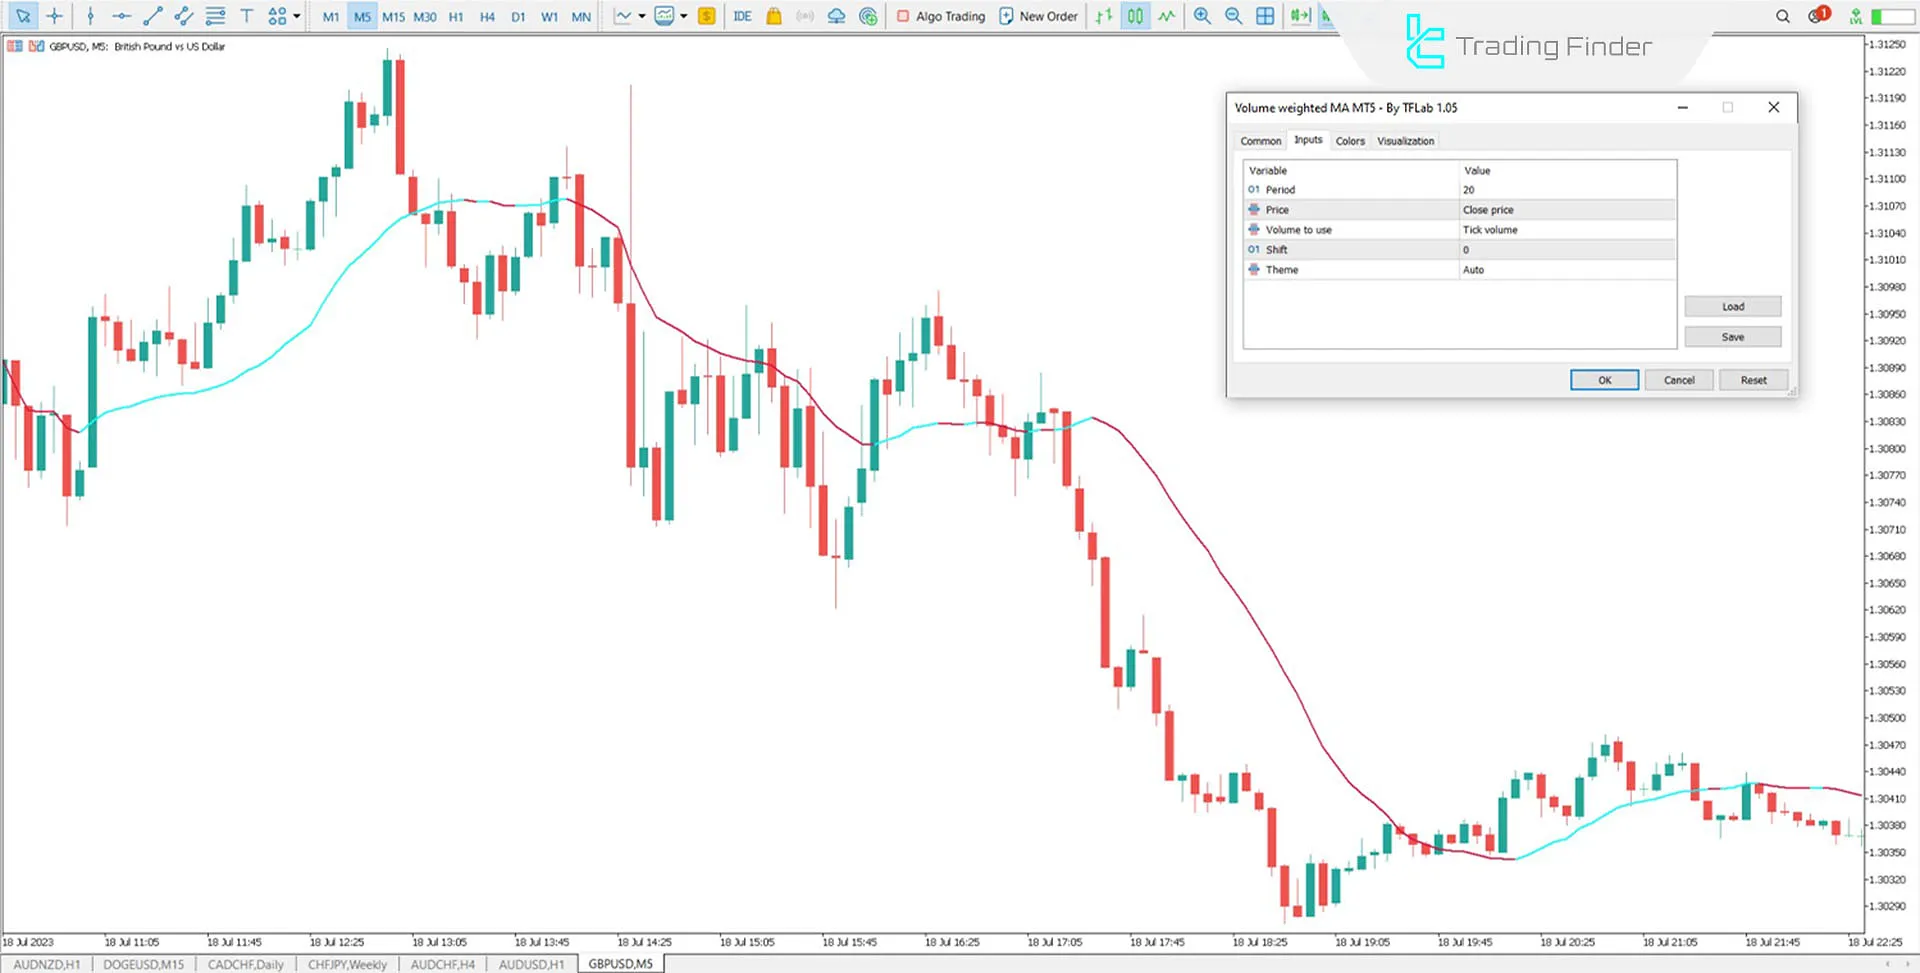
VWMA Indicator Settings
In this image, the indicator settings are displayed in full:
- Period: Set the time frame or period (default is 20);
- Price: Reference price type used for calculation (default is a closing price);
- Volume to Use: Trading volume used (based on tick volume);
- Shift: Adjust the indicator's position;
- Theme: Background chart image.
Conclusion
The VWMA (Volume Weighted Moving Average) indicator is an efficient tool for trend identification among MetaTrader 5 indicators. By combining price and trading volume, it provides a clear market analysis. This indicator, by incorporating volume impact into its calculations, offers higher sensitivity to market fluctuations.
VWMA acts as dynamic support during uptrends and dynamic resistance during downtrends.
Volume Weighted Moving Average MT5 PDF
Volume Weighted Moving Average MT5 PDF
Click to download Volume Weighted Moving Average MT5 PDFHow does the VWMA Indicator identify trends?
In an uptrend, it acts as support; in a downtrend, it acts as dynamic resistance.
What settings can be adjusted?
Time frame, reference price, volume type, shift, and chart theme can be customized.


