TradingView
MetaTrader4
MetaTrader5
![Footprint Orderflow Indicator in NinjaTrader - Free Download [TradingFinder]](https://cdn.tradingfinder.com/image/658872/2-176-en-footprint-orderflow-1.webp)
![Footprint Orderflow Indicator in NinjaTrader - Free Download [TradingFinder] 0](https://cdn.tradingfinder.com/image/658872/2-176-en-footprint-orderflow-1.webp)
![Footprint Orderflow Indicator in NinjaTrader - Free Download [TradingFinder] 1](https://cdn.tradingfinder.com/image/658873/2-176-en-footprint-orderflow-2.webp)
![Footprint Orderflow Indicator in NinjaTrader - Free Download [TradingFinder] 2](https://cdn.tradingfinder.com/image/658866/2-176-en-footprint-orderflow-3.webp)
![Footprint Orderflow Indicator in NinjaTrader - Free Download [TradingFinder] 3](https://cdn.tradingfinder.com/image/658868/2-176-en-footprint-orderflow-4.webp)
To receive a free license for this indicator, click on Online Support and get in touch with us via Telegram or WhatsApp through the “Connect with an Experienced Specialist” section.
The Footprint Orderflow indicator is one of the most advanced visual tools available on the NinjaTrader platform, providing tick-by-tick microstructure analysis of the market.
By combining real-time Bid/Ask data, executed volume, and volume-based Delta after NinjaTrader Registration, this Trading Volume indicator reveals the entry and exit positioning of major market participants within specific price ranges.
The main focus of this trading tool is to display the real supply and demand balance behind each candle; a balance that is not visible on standard charts and can only be identified through order flow analysis.
In ranging conditions, the numerical footprint structure typically forms between 8 to 10 repeated blocks depending on the instrument, allowing precise evaluation of buying and selling pressure.
Footprint Orderflow Indicator Table
General specifications of the Footprint Orderflow indicator are presented in the table below:
Category | Signal and Forecast – Trading Tool – Volume Trading |
Platform | NinjaTrader |
Skill Level | Advanced |
Indicator Type | Continuation – Reversal |
Timeframe | Multi Timeframe |
Trading Style | Intraday Trading |
Trading Market | All Markets |
Footprint Orderflow at a Glance
In the Footprint Orderflow indicator, each colored block represents a “Footprint candle” containing volume information for each price level within the candle.
This data includes:
- Bid Volume: Volume of Sell orders executed at the Bid price;
- Ask Volume: Volume of Buy orders executed at the Ask price;
- Delta: The difference between Aggressive Buy and Aggressive Sell volume at the same price level;
- Cumulative Delta: The accumulation of volume differences across the entire bar to evaluate order flow direction;
- Imbalance: Volume asymmetry between the two sides of the market at a specific price level, highlighted with distinct colors.
Note: At the bottom of the chart, the analytical panel includes Volume, ATS, Cumulative Delta, Delta, Max Delta, and Min Delta. These values allow traders to evaluate the intensity of order flow, average trade size, and momentum rotation points.
The Footprint Orderflow Indicator is provided by TradingFinder, officially recognized vendor of NinjaTrader.
Analytical Applications of the Footprint Orderflow Indicator
The order flow tracker indicator is designed for advanced traders aiming to identify the behavior of Liquidity Providers and major institutional players.
Key uses include:
- Identifying Absorption Zones;
- Detecting Volume Imbalance areas;
- Momentum structure evaluation through Delta Divergence;
- Breakout Validation by comparing volume with order flow direction;
- Determining Liquidity Reaction Levels at local highs and lows;
- Confirming dynamic support and resistance zones based on real executed volume;
- Identifying Whale Entries through sudden spikes in volume at precise levels.
Note: Each of these elements is displayed on the chart numerically, through color coding, and via geometric symbols (arrows, diamonds) to maintain real-time readability.
Indicator in an Uptrend
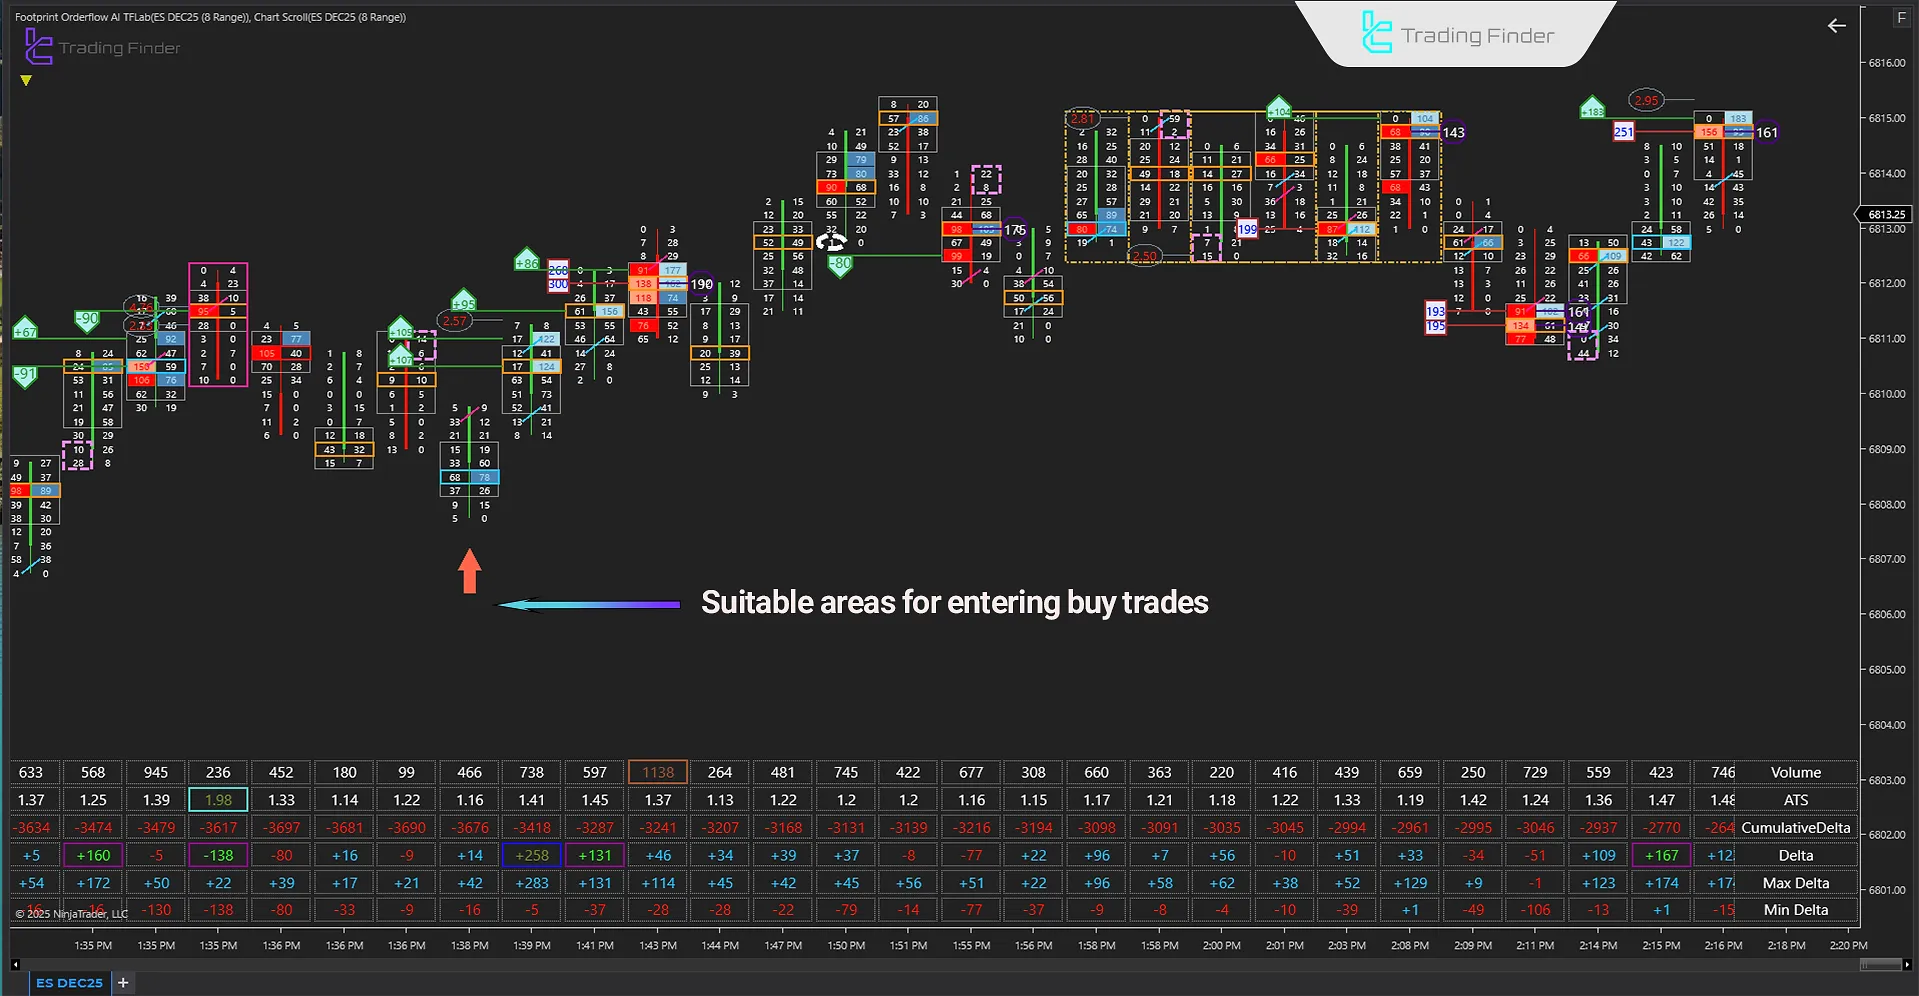
IAccording to the Footprint Orderflow indicator tutorial Buy and Sell Volume Indicator, buy signals are generated based on the convergence of multiple factors:
- Emergence of positive Delta in zones where selling volume peaks but price fails to decline;
- Formation of Bullish Imbalance where Ask volume is at least two to three times Bid volume at the same level;
- Presence of Sell Absorption in the lower part of the bar with price stabilizing above the volume area;
- Confirmation through rising Cumulative Delta and increasing ATS in subsequent candles;
- Formation of a bullish candle with Max Delta higher than the average of the previous five candles.
In the image, upward red arrows and positive Delta blocks illustrate such conditions, indicating seller absorption and buyer control.

Indicator in a Downtrend
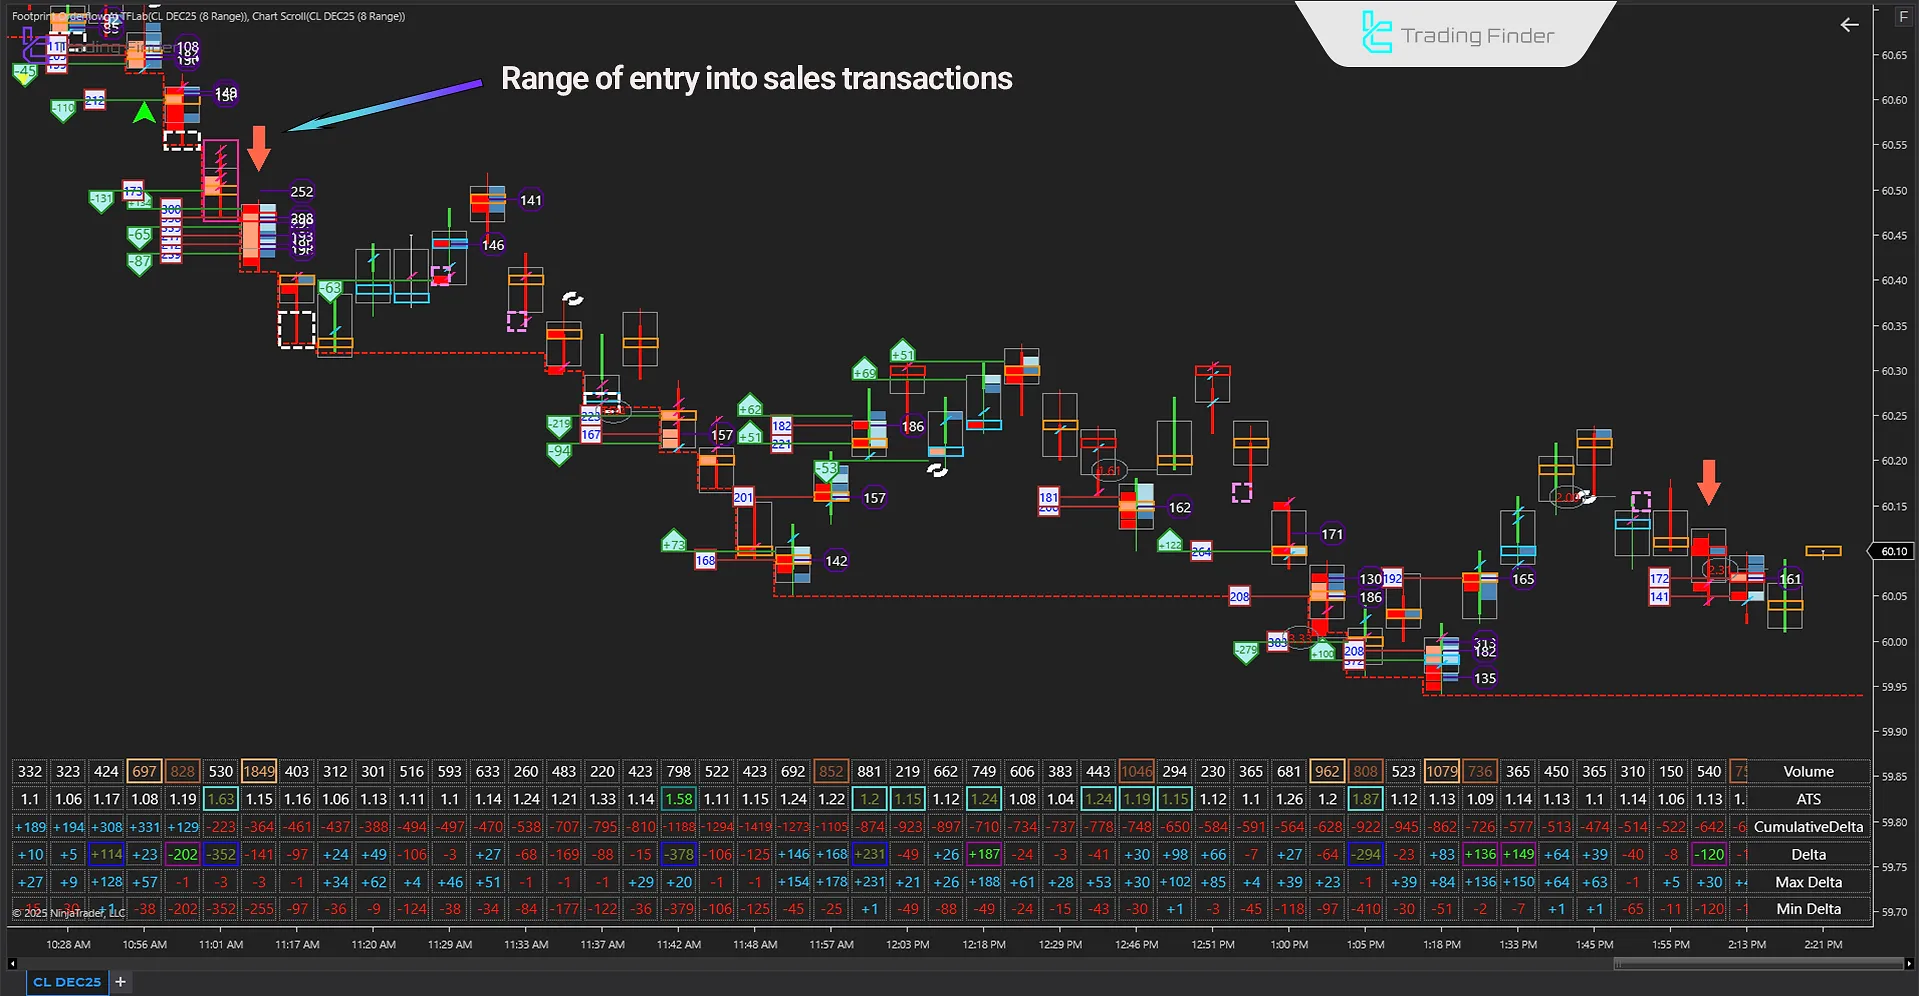
In a downtrend, the Footprint Orderflow AI indicator generates sell signals when order flow reveals weakening buyers and increasing selling pressure:
- Strong negative Delta forming near a resistance level;
- Bearish Imbalance with heavy Bid volume;
- Upward price failure despite high buy volume;
- Negative divergence between price and Cumulative Delta;
- Activation of a bearish bar with Min Delta lower than recent average values.
Downward red arrows in the chart highlight optimal entry opportunities for short positions.

Footprint Orderflow Indicator Settings
The image below shows the settings panel of the Footprint Orderflow Level 2 Data indicator in NinjaTrader:

- General: Basic Settings
- SessionsGrid: Session Grid
- Left Side: Left Display
- Right Side: Right Display
- Volume Profile: Volume Distribution
- Cumulative Delta: Delta Sum
- Imbalance: Volume Skew
- Big Volume: Large Volume
- Big Delta: Strong Delta
- Big Contract: Large Contracts
- Big ATS: Large Average Trade
- Volume Marker: Volume Tag
- Delta Marker: Delta Tag
- Contract Marker: Contract Tag
- ATS Marker: ATS Tag
- Delta Divergence: Delta Divergence
- Fishing: Liquidity Hunt
- Large Print: Block Trade
- Single Print: Thin Print
- Ratio Bar: Ratio Display
- Spread Bar: Spread Display
- Absorption Area: Absorption Zone
- Bar Report: Bar Stats
- Table Report: Table Stats
- Session High/Low: Session Range
- Text: Text Labels
- Menu: Menu Panel
- Data Series: Data Source
- Setup: Initial Setup
- Visual: Visual Styl
Note: In the General section, three filtering modes are available:
- AI
- Automatic
- Manual
The user selects the appropriate mode depending on their workflow.
Conclusion
The Footprint Orderflow Trade Volume Indicator is used as a fast decision-making system in short-term trading, enabling traders to analyze market direction through Delta shifts, ATS measurements, and bar sequencing.
In medium-term trading, Cumulative Delta data helps identify progressive liquidity changes and price-volume divergence.
In day trading, the indicator determines precise entry and exit timing by detecting critical volume shifts during breakouts or reversals.
Footprint Orderflow Indicator in NinjaTrader PDF
Footprint Orderflow Indicator in NinjaTrader PDF
Click to download Footprint Orderflow Indicator in NinjaTrader PDFWhat additional information does the Footprint Orderflow indicator provide compared to standard candles?
In addition to Open, Close, High, and Low, this indicator displays buy and sell volume at each price level inside the candle, revealing real supply-demand structure and institutional activity.
What is the role of Delta in interpreting order flow in the Footprint Orderflow indicator?
Delta represents the difference between aggressive buying and aggressive selling.
What is Imbalance in the Footprint Orderflow indicator?
Imbalance occurs when volume at a specific price level on one side (buy or sell) is several times greater than the opposite side.
The best indicator!!! Very useful and a great and complete assistant for trading.


