


TradingView
MetaTrader4
MetaTrader5
The ICT KillZones + Pivot Points indicator combines volatile time zones (Kill Zones) with Pivot Points, facilitating the identification of trend reversal zones and analyzing volatile areas (Kill Zone Hunt).
Pivot levels are among the key liquidity points in Forex, which are accompanied by a significant increase intrading activity.
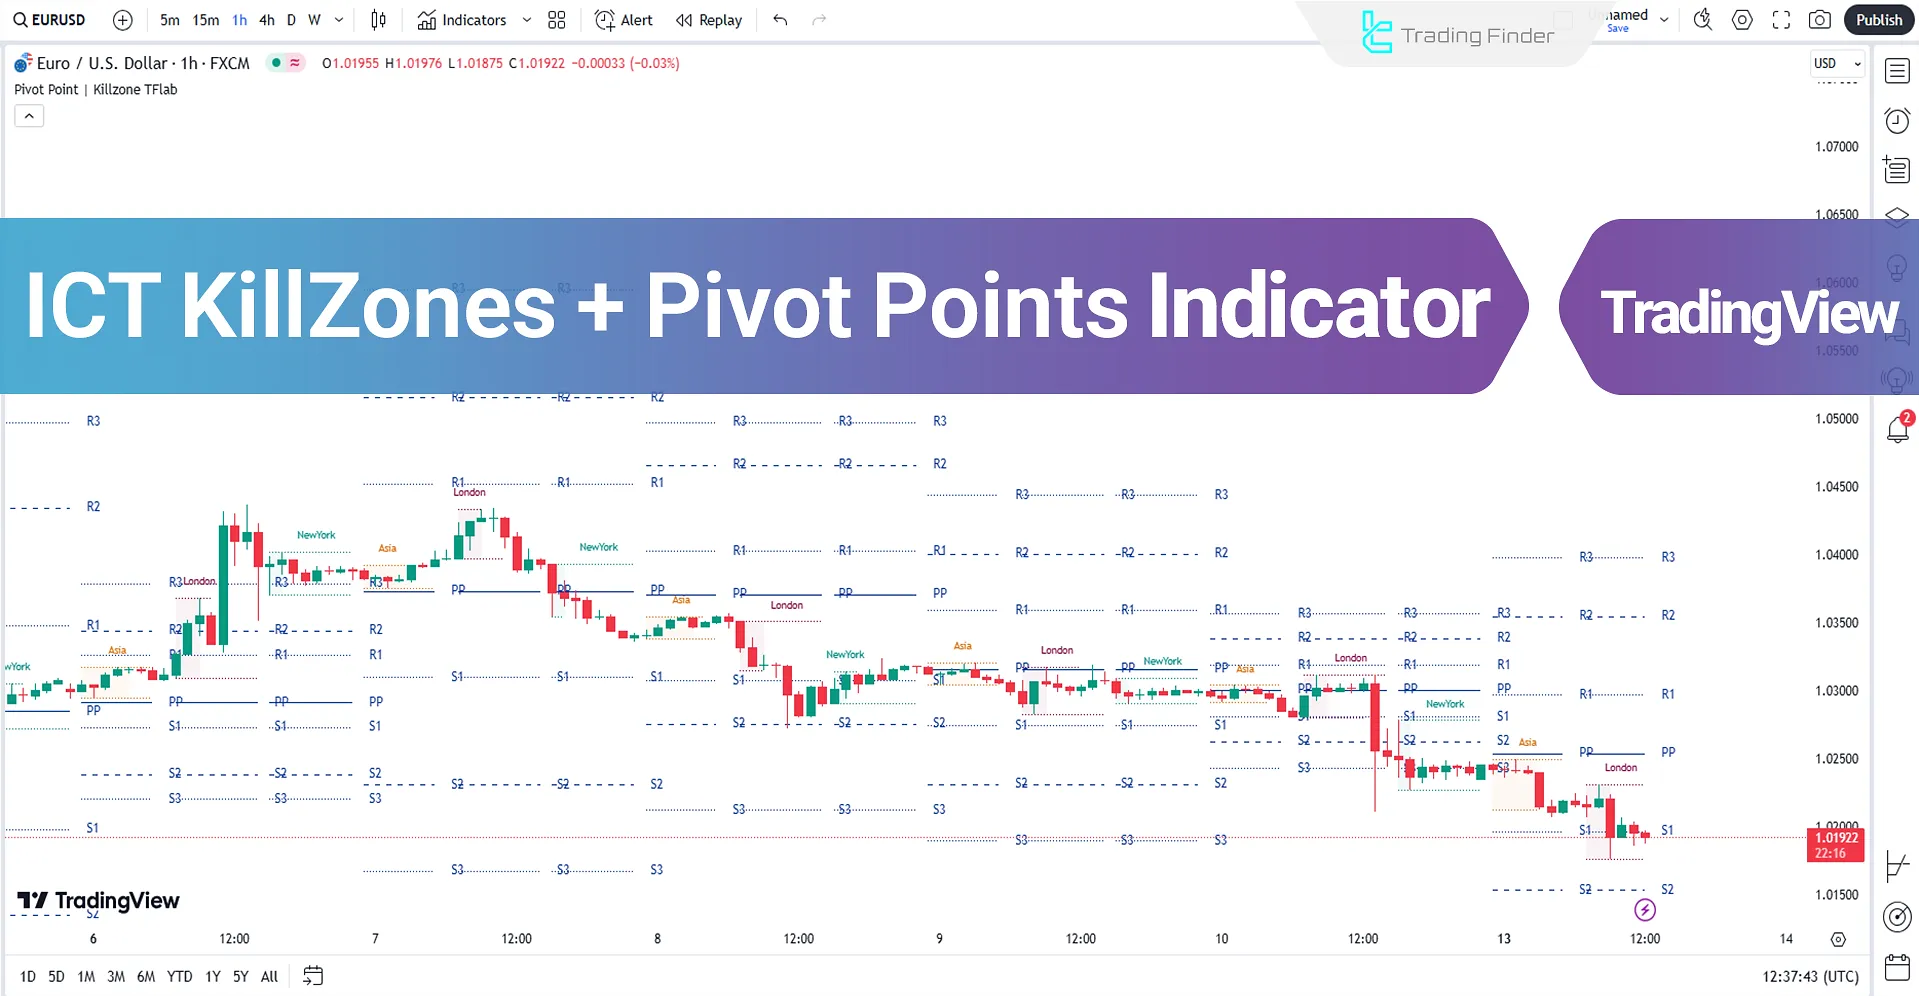
Kill Zones are periods withintrading sessions where trader activity peaks.
ICT KillZones + Pivot Points Indicator Specifications
The specifications of the ICT KillZones + Pivot Points indicator are outlined in the table below:
Indicator Categories: | Pivot Points & Fractals Tradingview Indicators Liquidity Tradingview Indicators Session & KillZone Tradingview Indicators Kill Zones Indicators for TradingView |
Platforms: | Trading View Indicators |
Trading Skills: | Intermediate |
Indicator Types: | Reversal Tradingview Indicators |
Timeframe: | Multi-Timeframe Tradingview Indicators |
Trading Style: | Intraday Tradingview Indicators |
Trading Instruments: | TradingView Indicators in the Forex Market Cryptocurrency Tradingview Indicators Stock Tradingview Indicators Commodity Tradingview Indicators Indices Tradingview Indicators Forward Tradingview Indicators Share Stocks Tradingview Indicators |
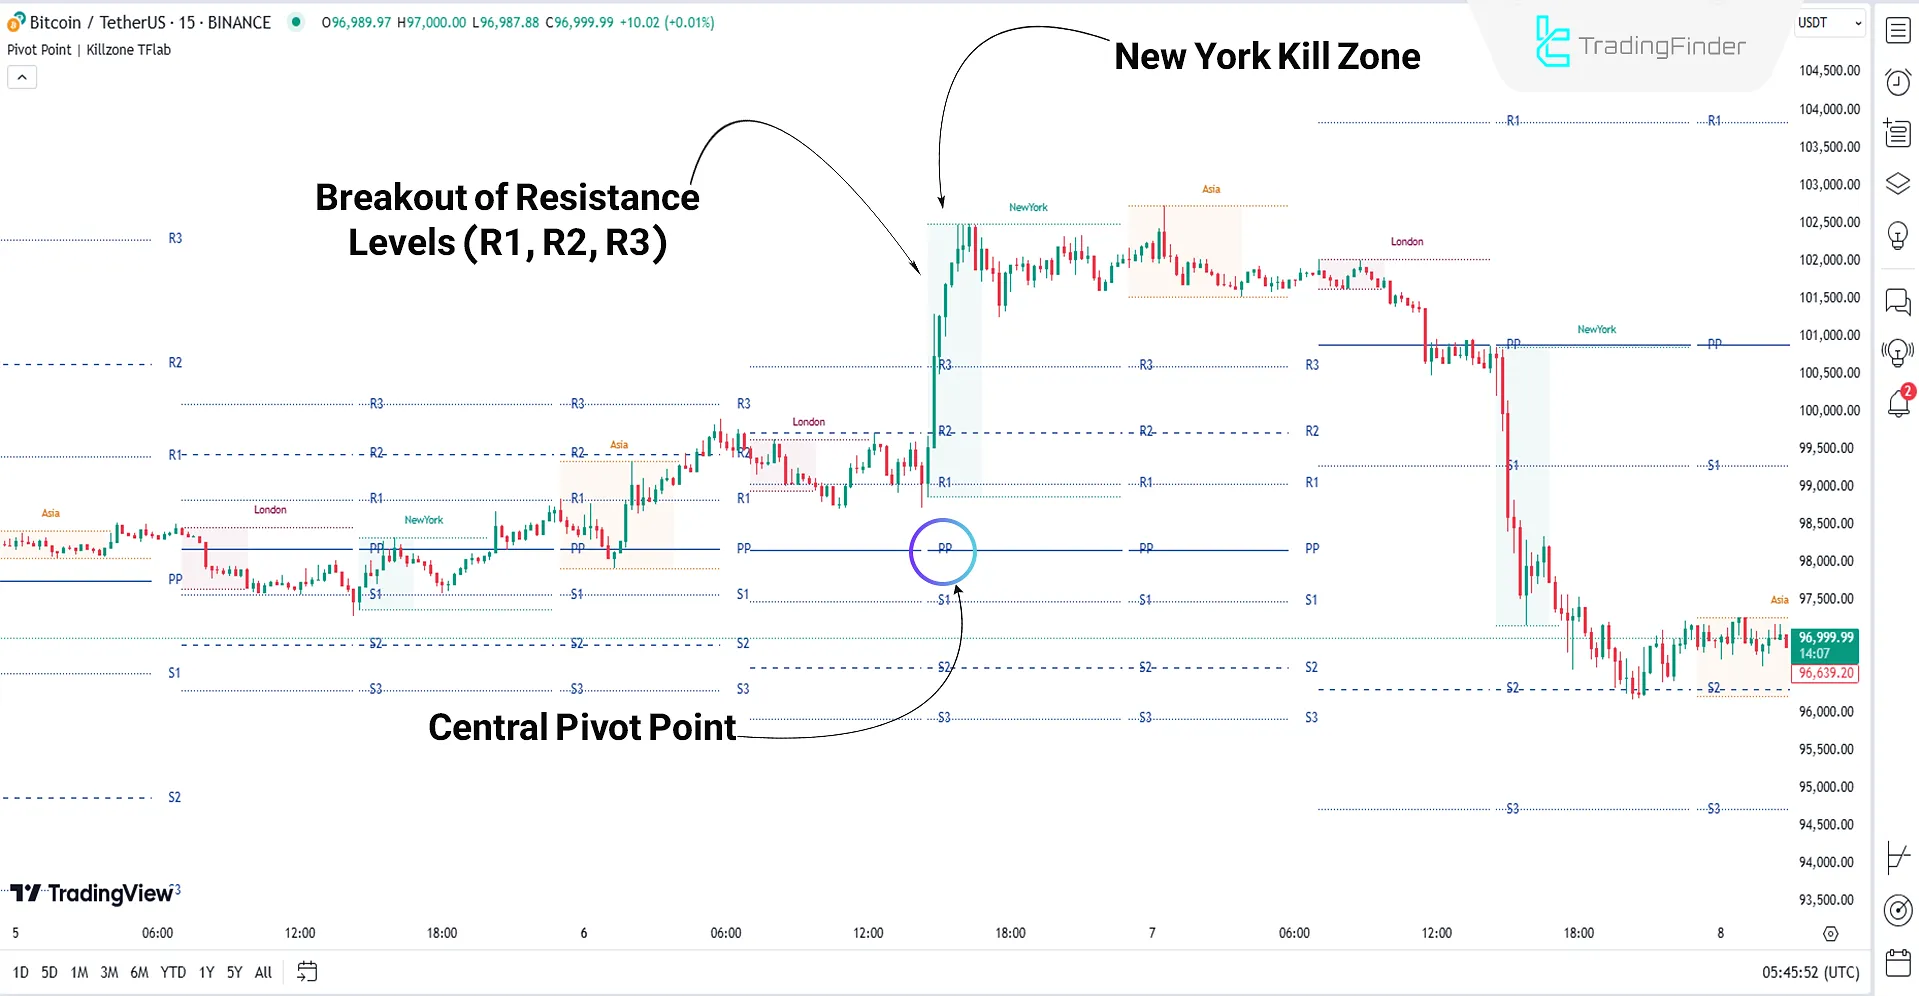
Bullish Trend Conditions
According to the Bitcoin (BTC) chart in the 15-minute timeframe, the price above the central pivot point (PP) indicates an upward trend.
Additionally, upon entering the New York Kill Zone, the price witnessed a wave of buy orders and broke through resistance pivot levels (R1, R2, R3).
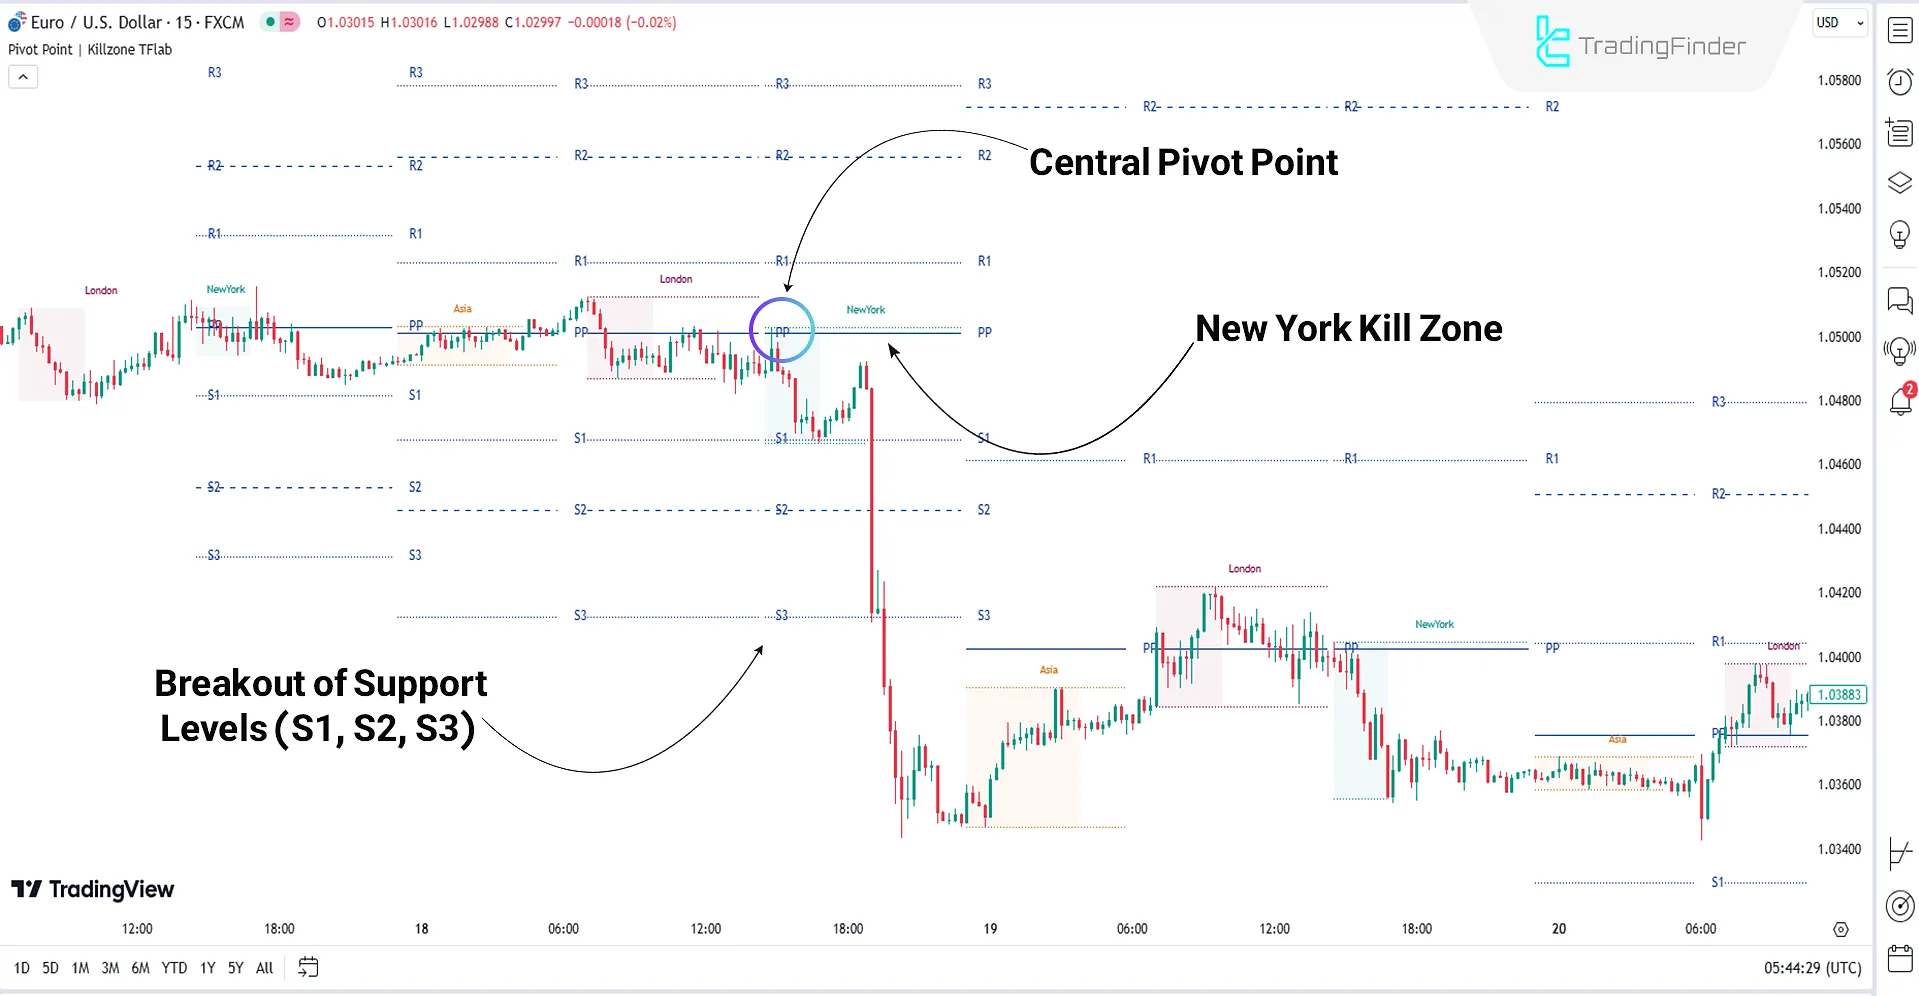
Bearish Trend Conditions
Based on the EUR/USD chart analysis, the price, after crossing the central pivot point (PP), returned to significant zones in the New York Kill Zone and then strongly moved toward lower price targets.
During the bearish move, the price broke through support Pivot levels (S1, S2, S3), indicating the market's bearish tendency.
Note: Floor Pivot Points have been used in both the bullish and bearish trend examples.
ICT KillZones + Pivot Points Indicator Settings
The image below details the settings for the "ICT KillZones + Pivot Points" indicator in the TradingView platform:
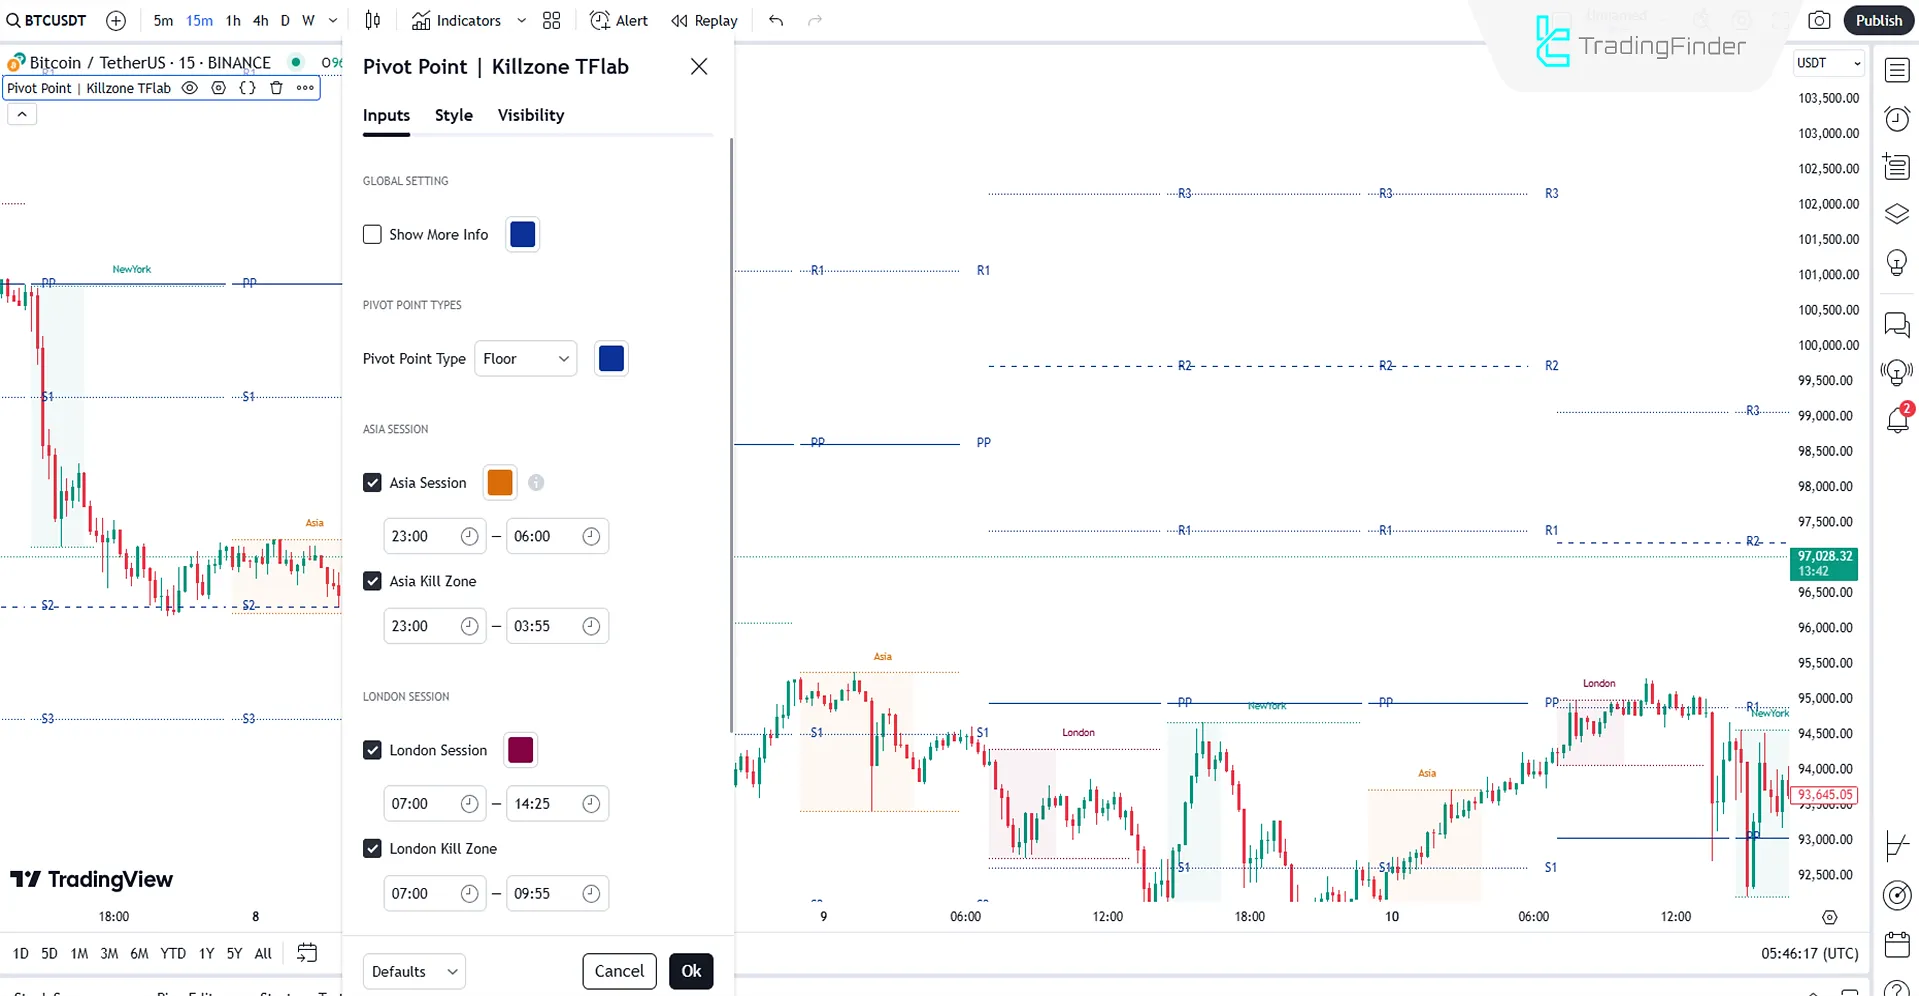
Global Settings
- Show More Info: Displays additional information about Pivot Points
Pivot Point Type
- Pivot Point Type: Determines the type of Pivot Points
Asia Session
- Asia Session: Enables the Asian trading session
- Asia Kill Zone: Enables the Asian Kill Zone
London Session
- London Session: Enables the London trading session
- London Kill Zone: Enables the London Kill Zone
New York Session
- New York: Enables the New York trading session
- New York Kill Zone: Enables the New York Kill Zone
Conclusion
The ICT KillZones + Pivot Points indicator combines Pivot Points and volatile time zones (Kill Zones) to provide precise market analysis.
This tool is a Pivot Point Fractal Indicator and includes four types of pivots Floor, Camarilla, Woodie, and Fibonacci. Each pivot highlights key support and resistance zones, emphasizing trading trends.
ICT KillZones Pivot Points TradingView PDF
ICT KillZones Pivot Points TradingView PDF
Click to download ICT KillZones Pivot Points TradingView PDFWhat are Pivot Points used for?
Pivot Points indicate key support and resistance levels typically accompanied by increased trading activity.
What is a Kill Zone?
A Kill Zone refers to periods of increased activity within trading sessions.


