


Identifying trend reversal points is a key concept in price action and technical analysis, as these areas are often associated with changes in liquidity flow and overall market direction. These points usually emerge around zones indicating a potential shift in price behavior.
Reversal zones, as highlighted by various tools and patterns, often coincide with the confluence of indicators such as divergences, candlestick formations, key supply and demand levels, and Fibonacci retracements.
Top Tools for Identifying Trend Reversals
For a trend reversal tool to be effective, it must deliver timely and actionable insights with minimal lag. Here are some of the best indicators for this purpose:
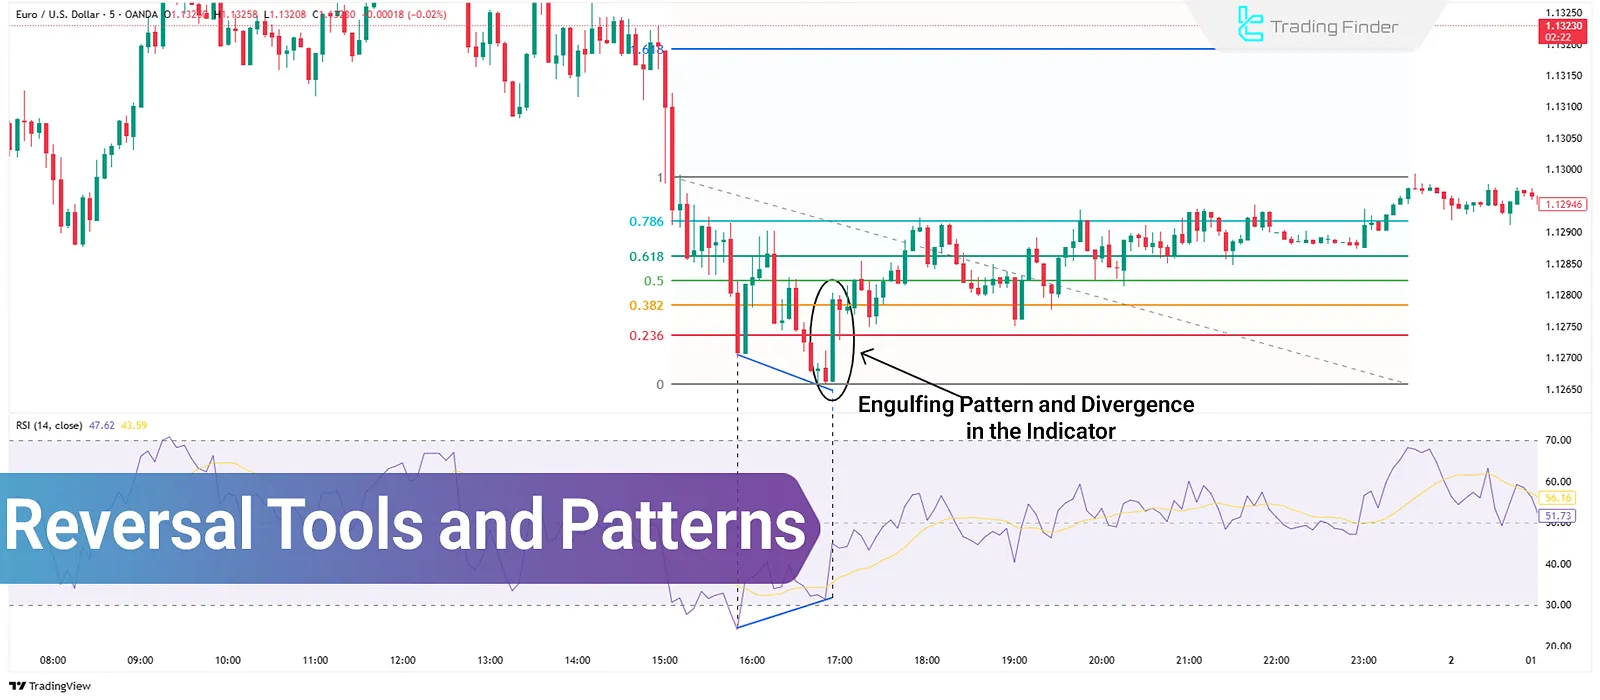
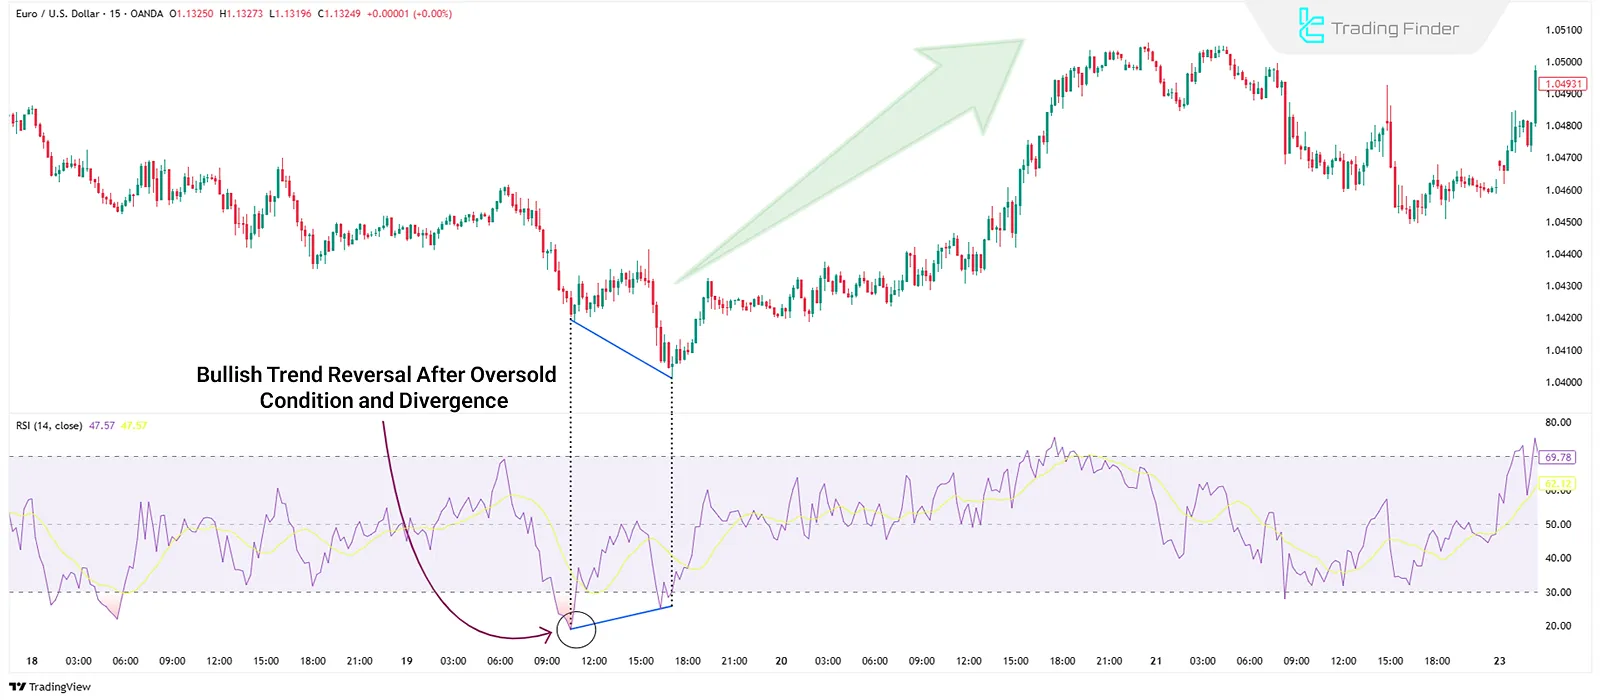
Relative Strength Index (RSI)
RSI is an oscillator that shows overbought and oversold conditions on a scale from 0 to 100.
- Readings above 70 signal an overbought market, hinting at a potential bearish reversal;
- Readings below 30 indicate oversold conditions and a possible bullish reversal.
Additionally, divergence between RSI and price can provide early signals. For example, if the price makes a new low while RSI forms a higher low, a positive divergence suggests a bullish reversal.
RSI Advantages and Disadvantages:
Advantages | Disadvantages |
Easy to understand and apply | Prone to false signals in trending markets |
Leading indicator | Ignores trading volume |
Can detect weakening momentum | – |
Stochastic Oscillator
This indicator measures the closing price's position relative to the high-low range over a given period. Being momentum-sensitive, it's useful for spotting trend strength or weakness and potential reversal points.

Stochastic Oscillator Advantages and Disadvantages:
Advantages | Disadvantages |
Multiple and clear signals | Prone to false signals in highly volatile markets |
Easy to use | Remains in overbought/oversold zones during strong trends |
Fibonacci Retracement Levels
Fibonacci levels act as support and resistance zones, calculated from key ratios like 38.2%, 50%, and 61.8%. They are often used for setting entry points, price targets, and stop-loss levels.

Fibonacci Advantages and Disadvantages:
Advantages | Disadvantages |
Beginner-friendly | Too many levels can be confusing |
Abundant educational resources | Weak performance in non-trending markets |
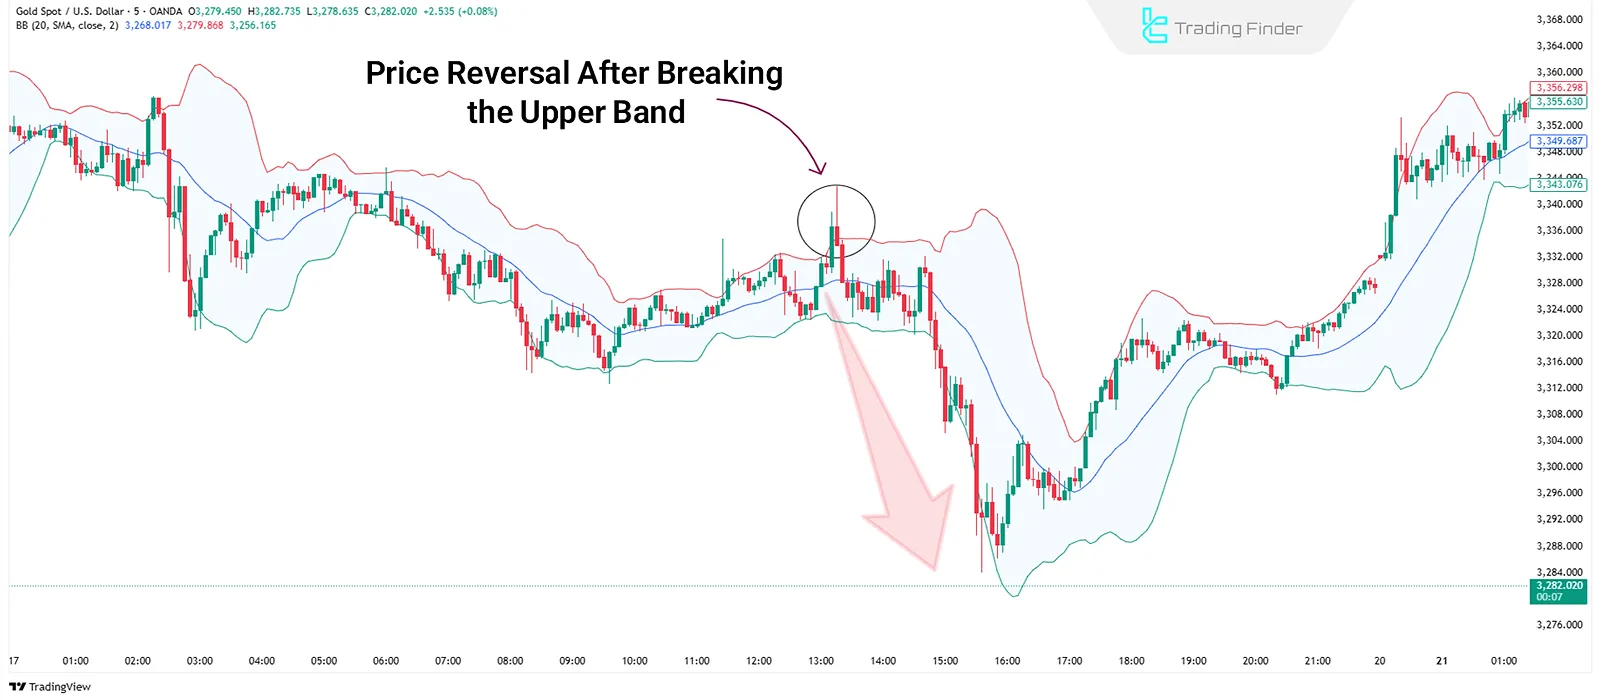
Bollinger Bands
This indicator creates bands using a moving average and standard deviation.
When the price crosses the upper or lower bands, a mean reversion to the moving average is often expected.
Advantages and Disadvantages of Bollinger Bands:
Advantages | Disadvantages |
Identifies market volatility | Delayed signals |
Highlights support and resistance zones | Needs confirmation with other indicators |
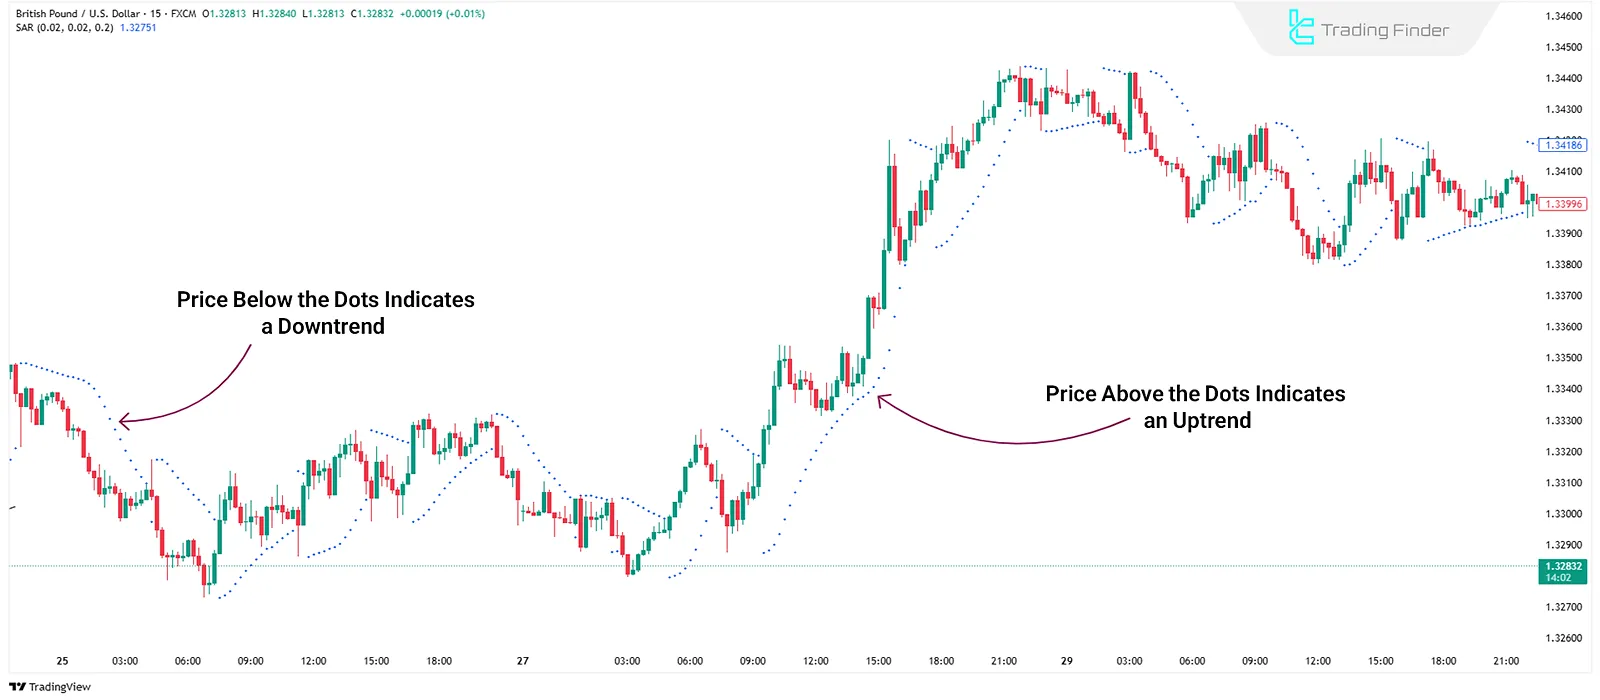
Parabolic SAR
Parabolic Stop and Reverse (SAR) identifies trends and potential reversals using dots placed above or below the price.
- Dots below the price indicate an uptrend;
- Dots above the price suggest a downtrend or potential sell signal.
Advantages and Disadvantages of Parabolic SAR:
Advantages | Disadvantages |
Fast trend detection | Poor performance in range-bound markets |
Clear trend direction | Does not indicate trend strength |
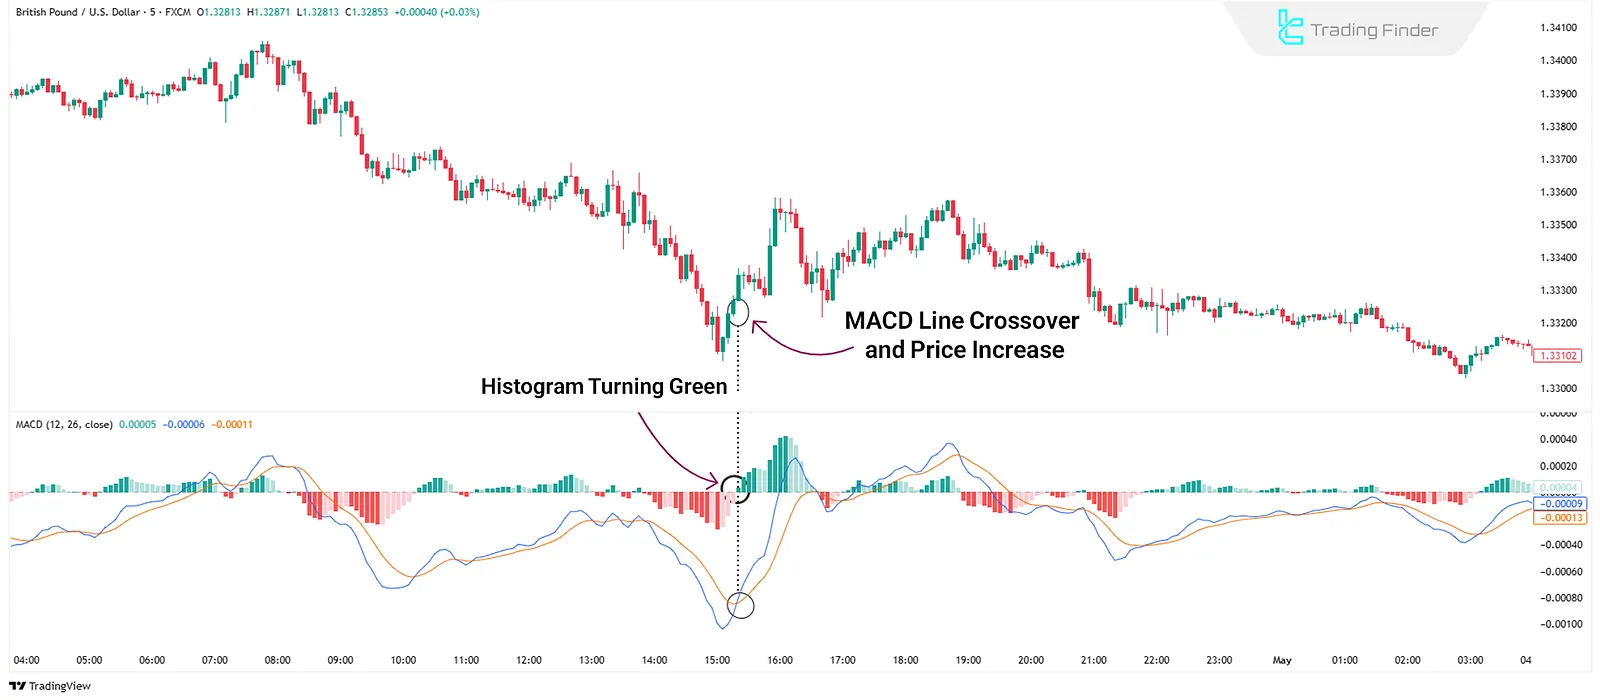
MACD (Moving Average Convergence Divergence)
MACD indicator detects momentum shifts and trend reversals using the difference between two EMAs (usually 12 and 26). It presents a histogram and two lines (MACD & Signal Line).
Traders use line crossovers and histogram color changes for entry/exit signals.
Advantages Disadvantages of MACD:
Advantages | Disadvantages |
Effective for momentum and reversals | Less sensitive to short-term price moves |
Helps spot divergences | Weak in ranging markets |
Alligator Indicator
The Alligator indicator consists of three moving averages with different periods. By observing the divergence (spreading apart) and convergence (coming together) of the lines, traders can identify trend initiation, continuation, or end.

Advantages Disadvantages of Alligator:
Advantages | Disadvantages |
Detects market structure | Needs adjustment per timeframe |
Reveals support/resistance zones | Hard to grasp for beginners |
5 Key Reversal Chart Patterns
Chart patterns are vital to technical analysis and can be used alongside indicators to detect reversals:
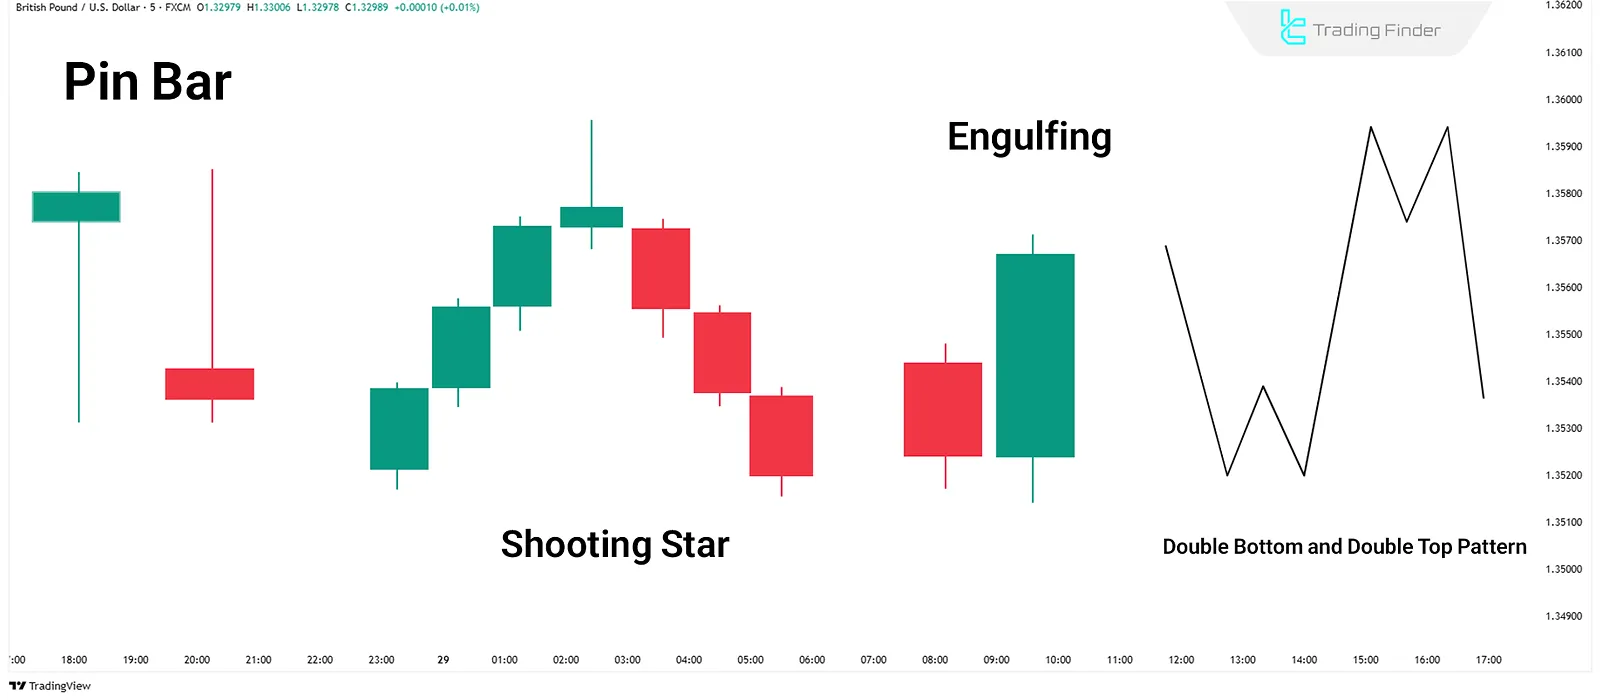
Pin Bar
A candlestick with a small body and a long wick indicates price rejection, effective near support/resistance levels.
Shooting Star
A bearish single-candle pattern with a long upper wick, indicating a potential price drop.
Engulfing Pattern
An engulfing pattern signals a potential trend reversal:
- Bullish: A large green candle completely covers the previous red one;
- Bearish: A large red candle engulfs the previous green one.
- Indicates growing buyer/seller dominance.
Double Top/Bottom
Two price swings at similar levels. Double top indicates bearish reversal; double bottom indicates bullish reversal.
Hammer/Inverted Hammer
The "Hammer" signals a possible bullish reversal at the end of a downtrend, while the "Inverted Hammer" may indicate weakening momentum in an uptrend.
Key Signs of a Trend Reversal
Reversals are often preceded by the following signs:
- Volume changes: Volume spikes during downtrends or fades in uptrends may signal a reversal;
- Price behavior: Break of key levels or classical patterns like double tops/bottoms indicate trend shifts;
- Indicator divergence: Divergences in RSI, MACD, or Stochastic.
How to Trade Using Reversal Tools & Patterns
Reversals can occur in any timeframe, but intraday traders often use 5 to 15-minute charts. Here are three common approaches:
#1 Support & Resistance
Enter a trade when the price hits a key level and a reversal signal forms.
#2 Breakout
A break of trendlines or key levels may trigger a reversal.
#3 Pullback
After a breakout, the price pulls back. Enter on confirmation (e.g., candlestick pattern).
Combined Strategy for Reversal Trading
Steps to execute a reversal trade using multiple tools:
- Observe the price touching the lower Bollinger Band;
- Price forms a bullish pin bar at the 8% Fibonacci level;
- Enter after a confirmation candle (e.g., bullish engulfing);
- Place a stop-loss below the pin bar;
- Target a 1:2 risk-to-reward ratio or the next resistance.

Conclusion
Detecting reversals using tools like RSI, MACD, Fibonacci levels, and price behavior is highly effective.
Combining them enhances accuracy, especially when volume, multi-timeframe analysis, and candlestick patterns like pin bars or double tops are considered.


