


Trading volume in binary options visualizes the intensity of market participation and reports the number of contracts exchanged and their size over a given time window.
This metric reflects the behavioral bias of demand and supply and provides a basis for analyzing price direction, trend persistence, and the likelihood of explosive moves.
Within this framework, volume data, instead of focusing on continuous price changes, concentrates on the flow of transactions and maps the rhythm of traders’ entries and exits.
In options volume analysis, when volume bars expand in key areas, market participation intensifies and the credibility of the price move is reinforced.
When volume bars remain short during seemingly sharp swings, the probability of continuation decreases and the risk of a short-term reversal increases.
Volume in binary options does not directly determine the contract price, but it indirectly affects the quality of price signals.
What Is Trading Volume in Binary Options?
Trading volume in binary options represents the degree of participation and the circulation of liquidity in an asset over a specified period.
This indicator reveals whether a price move is based on real capital inflows or merely a short, unsupported fluctuation. The higher the volume, the greater the strength and durability of the price movement, and the more reliable trend analysis and level breakouts become.
Conversely, lower volume often leads to short-range, mean-reverting moves and makes decision-making more sensitive. As a result, volume analysis in binary options is a key tool for discerning the true market flow and for selecting expiry time and contract direction.
Difference Between Real Volume and Tick Volume in Binary Options
Real volume shows the actual number of contracts exchanged during a time interval and is derived directly from firm orders and executed trades. This figure logs the true turnover of the underlying or contract and is the best gauge for liquidity and trend confirmation.
On many instruments, direct access to real volume is limited; therefore, platforms use tick volume as a proxy.
In binary options volume analysis, tick volume counts the number of price changes within a candle and assumes that more frequent price updates align with higher trading activity.
In binary options, the visible data often appears as tick-volume bars. When the number of ticks increases during a period, order flow is likely more vigorous and liquidity improves.
Likewise, when ticks decrease, the market tends toward scattered, jumpy swings. Although tick volume is not a direct replacement for real volume, a meaningful correlation between tick frequency and trading intensity is observed in many conditions.
The table below illustrates the differences between real volume and tick volume in trading with volume in binary options:
Real Volume | Tick Volume |
Measuring the actual number of executed trades and contracts | Counting the number of price changes over a set time interval |
Indicates the true participation of capital and liquidity | Indirectly reflects the intensity and speed of price movement |
Reliable for gauging liquidity structure and the real buy/sell pressure | Suitable for assessing short-term market rhythm and intraday fluctuations |
Accurately assesses the drivers behind price moves and market depth | Fast to reflect changes; helpful for short-term traders |
Confirms major, strong breakouts and trends | Detects quiet phases, brief bursts, and rhythm changes |
Used alongside price patterns to confirm structure | Comparing tick-volume bars with candles—especially near news—to reduce error |
Pros and Cons of High Volume in Binary Options
In high-volume conditions, the market operates with broader participation from traders, and liquidity continuously circulates between buyers and sellers.
Such an environment makes prices behave more structurally, and market reactions to key levels generate more valid patterns. Breakouts in these conditions are typically stronger, and the resulting trends tend to persist.
The table below shows the pros and cons of high volume in options trading:
Pros of High Volume | Cons of High Volume |
Greater liquidity | Risk of sudden sell-offs during macro events |
Narrower bid-ask spreads | Harder to predict ultra-short trends due to oscillation between successive highs/lows |
Order execution with limited slippage | Herd-like behavior can emerge in very active markets |
Higher confidence in established trends | Price imbalances upon news releases |
Stronger credibility of key-level breakouts with a volume surge | - |
Pricing more aligned with real supply and demand | - |
Lower risk of price manipulation due to broad participation | - |
Pros and Cons of Low Volume in Binary Options
In low-volume conditions, trader participation declines and market liquidity weakens.
Price swings are usually short-ranged, irregular, and prone to quick reversals. Moreover, lower volume reduces the credibility of breakouts and adds ambiguity to trend continuation.
The table below compares the pros and cons of low trading with volume in binary options:
Pros of Low Volume | Cons of Low Volume |
Creation of wide-range volatility | Lower liquidity and difficulty executing at desired prices |
Opportunities for specialized strategies | Reduced reliability of technical signals due to limited volume data |
Greater reliance on fundamental analysis | Harder trend confirmation |
Potential arbitrage scenarios from small price discrepancies across brokers | Constraints on scaling position size |
- | Increased whipsaw risk and tougher risk management |
- | Need to align contract type and timeframe precisely with volume conditions to avoid error |
The Relationship Between Volume and Trend Structure in Binary Options
Volume plays a formative role in assessing trend robustness and provides a complementary picture of momentum. Rising prices accompanied by steadily increasing volume signal powerful buying flow and bolster the durability of the bullish wave.
Falling prices with surging volume indicate that structural selling pressure is active, raising the probability of short-term downside continuation. Rising prices with declining volume point to weakening momentum and a higher chance of a pullback or a consolidation phase.
Conversely, declining prices with falling volume can indicate apathetic sellers and set the stage for basing or corrective bounces.
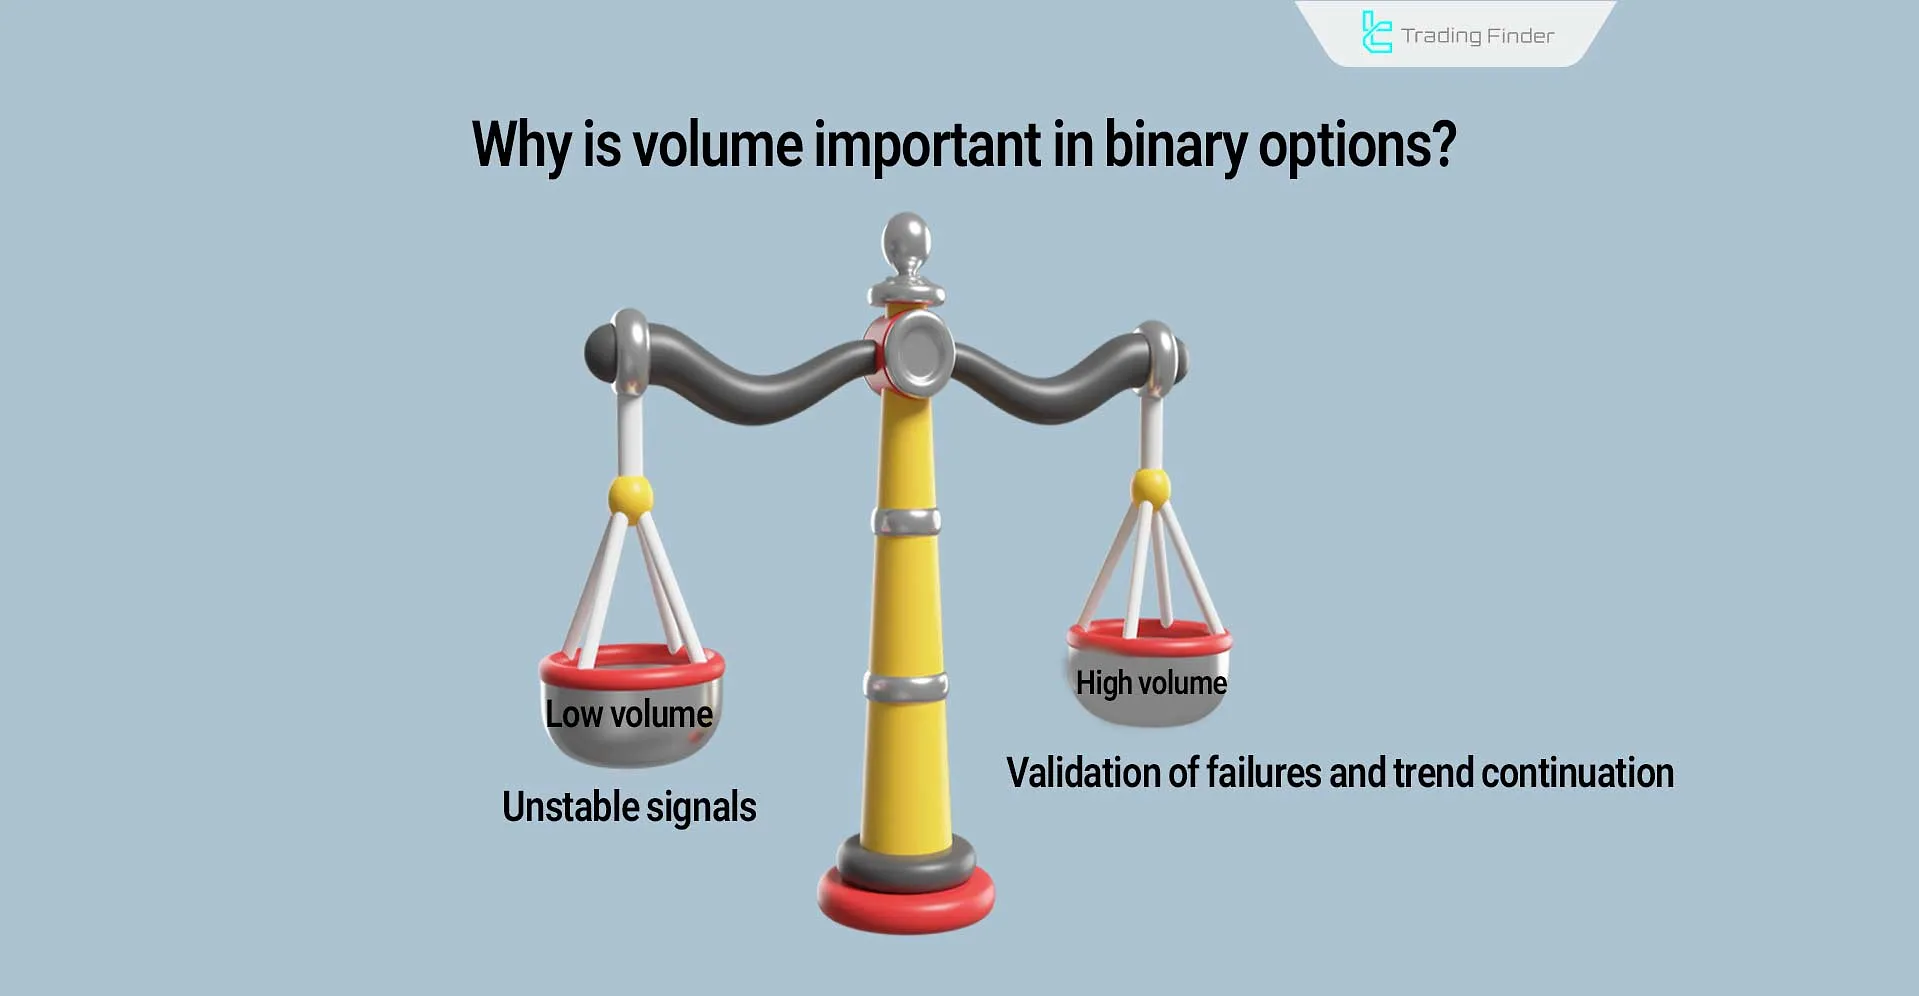
Why Does Volume Matter in Binary Options?
Volume reveals how much real participation stands behind each move; high volume increases the credibility of breakouts and trend continuation; low volume heightens the odds of whipsaws and unstable signals.
Filtering False Signals in Binary Options
A level breakout concurrent with a volume spike reduces the likelihood of a false signal; a price jump without volume support warns of a reversal or range-bound behavior; alignment of volume with the direction of moving averages effectively filters unsupported breakouts.
Identifying True Trends in Binary Options
A valid trend typically features price highs and lows synchronized with relative peaks in volume bars; a gradual volume decline during a trend leg signals energy fatigue; volume surges near key levels reinforce the trend structure and separate genuine breakouts from fake-outs. The same logic applies when setting expiry horizons.
The Role of Volume in Breakouts and Reversals in Binary Options
Successful breakouts are usually accompanied by a meaningful rise in volume, as crossing a key level triggers a wave of incoming orders. A tall volume bar at the moment of pushing through resistance or support indicates broad market acceptance of the new move and the liquidity backing the emerging trend.
In such conditions, using contracts aligned with the breakout direction and an expiry that matches the wave length becomes justified. If price crosses a level but volume bars remain short, the odds of a fake-out increase and a quick return inside the range is not unlikely.
For reversals, a weakening-momentum pattern shows up as a behavioral divergence between price and volume.
Rising prices alongside steadily shrinking volume bars suggest buyer exhaustion and a greater chance of rotation or consolidation. In extended declines, progressively shorter volume bars can indicate fading selling pressure and set up a corrective bounce. Near key supply and demand zones, a sudden volume spike as price rejects a level is a hallmark of a valid reversal.
Important news amplifies both breakouts and reversals. Before a release, volume typically contracts and ranges narrow.
After the release, a surge in volume aligned with a level break validates the breakout. If the news hits and price tags a level without a strong response in volume bars, the probability of a fast reversal increases.
The direct link between volume intensity and breakout quality provides an objective framework for distinguishing manufactured moves from structural ones and helps target contract type and expiry more precisely.
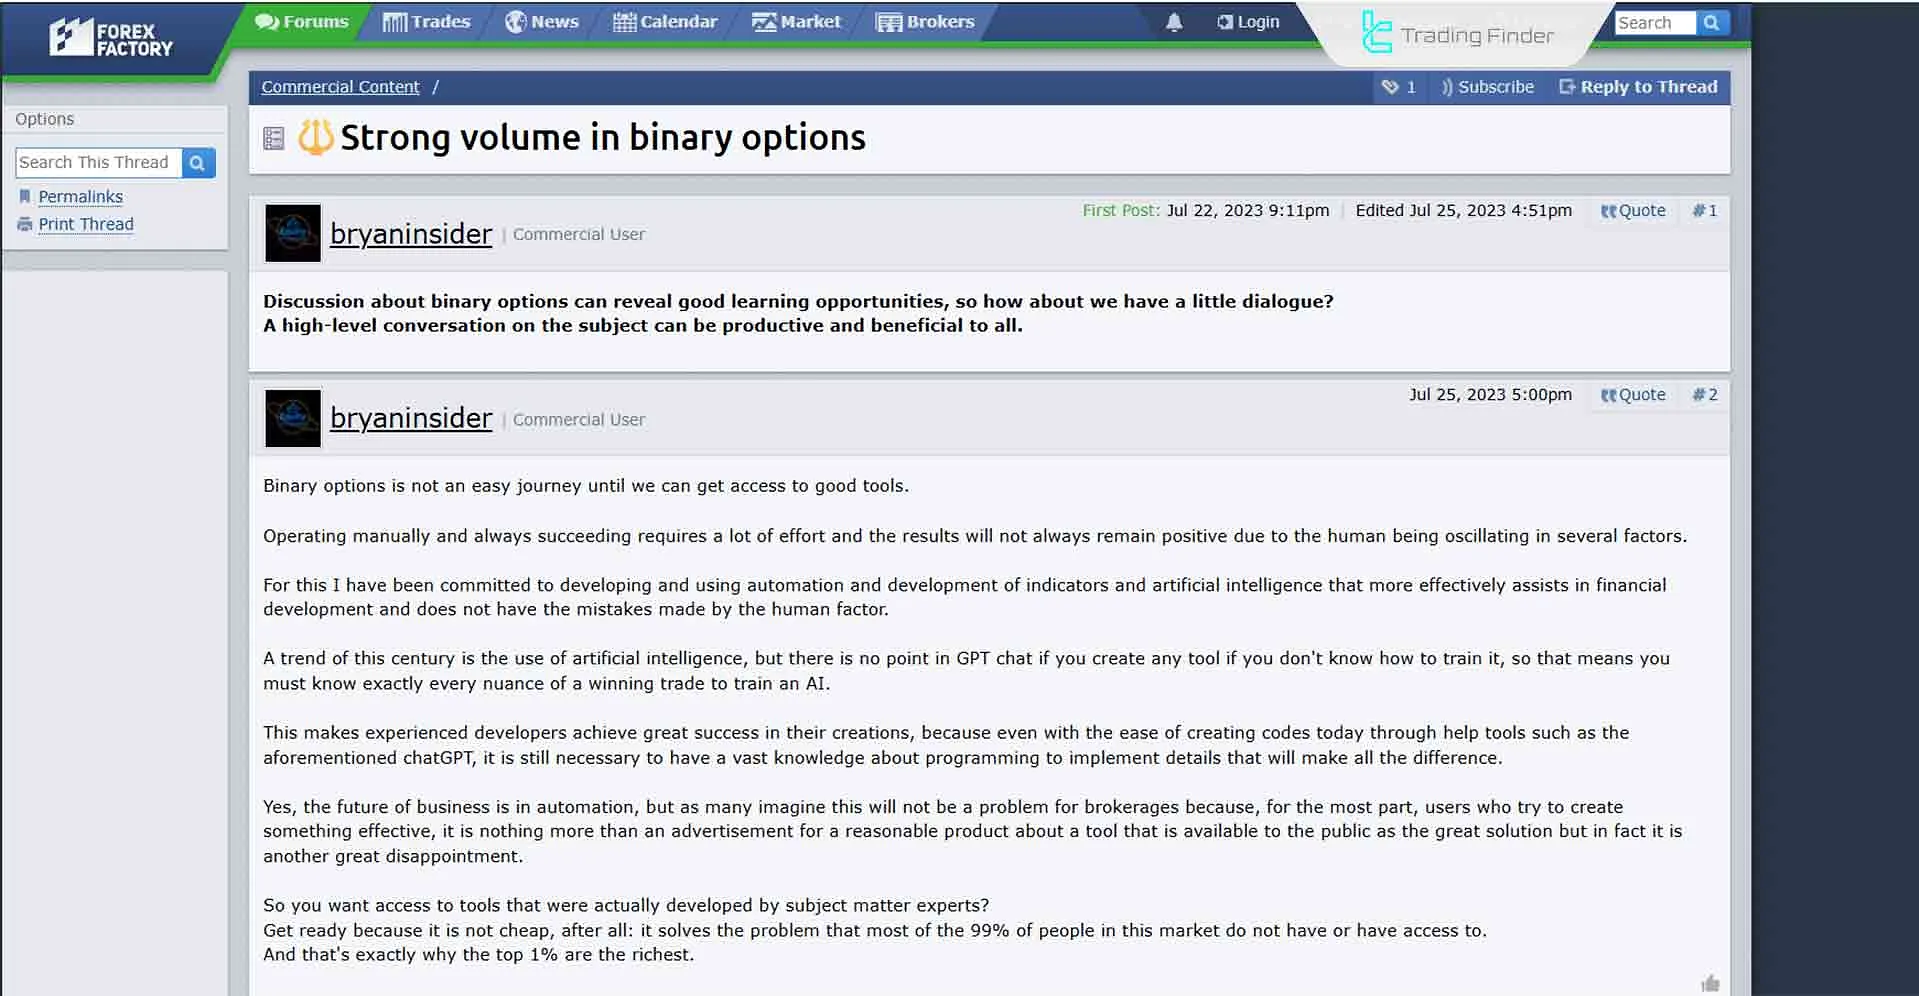
For more information on trading with volume in binary options, you can refer to the tutorial article on volume in binary options on Forexfactory.com.
How to View and Measure Volume in Binary Options
Measuring volume in trading with Binary Trading Volume follows two paths; the direct path relies on real volume data and reports the number of contracts traded over the specified interval.
The indirect path uses tick volume and evaluates the number of price changes per candle as a proxy for activity intensity.
Most charting platforms enable the volume display by default and show vertical bars below the chart for each candle. If this layer is disabled, it can be turned on manually in the chart settings.
Once enabled, practical interpretation begins. Tall bars imply broad participation; short bars suggest thin trading.
Juxtaposing volume bars with candle structure, key levels, and trend patterns creates an analytical framework.
Rising volume during a level break boosts the validity of the move. Declining volume along a wave warns of momentum erosion. Point-in-time volume spikes near supply/demand zones reinforce reversal signals.
Accurate measurement depends on selecting an appropriate timeframe. On short horizons, tick volume illuminates micro behavior and reveals the rhythm of minor waves.
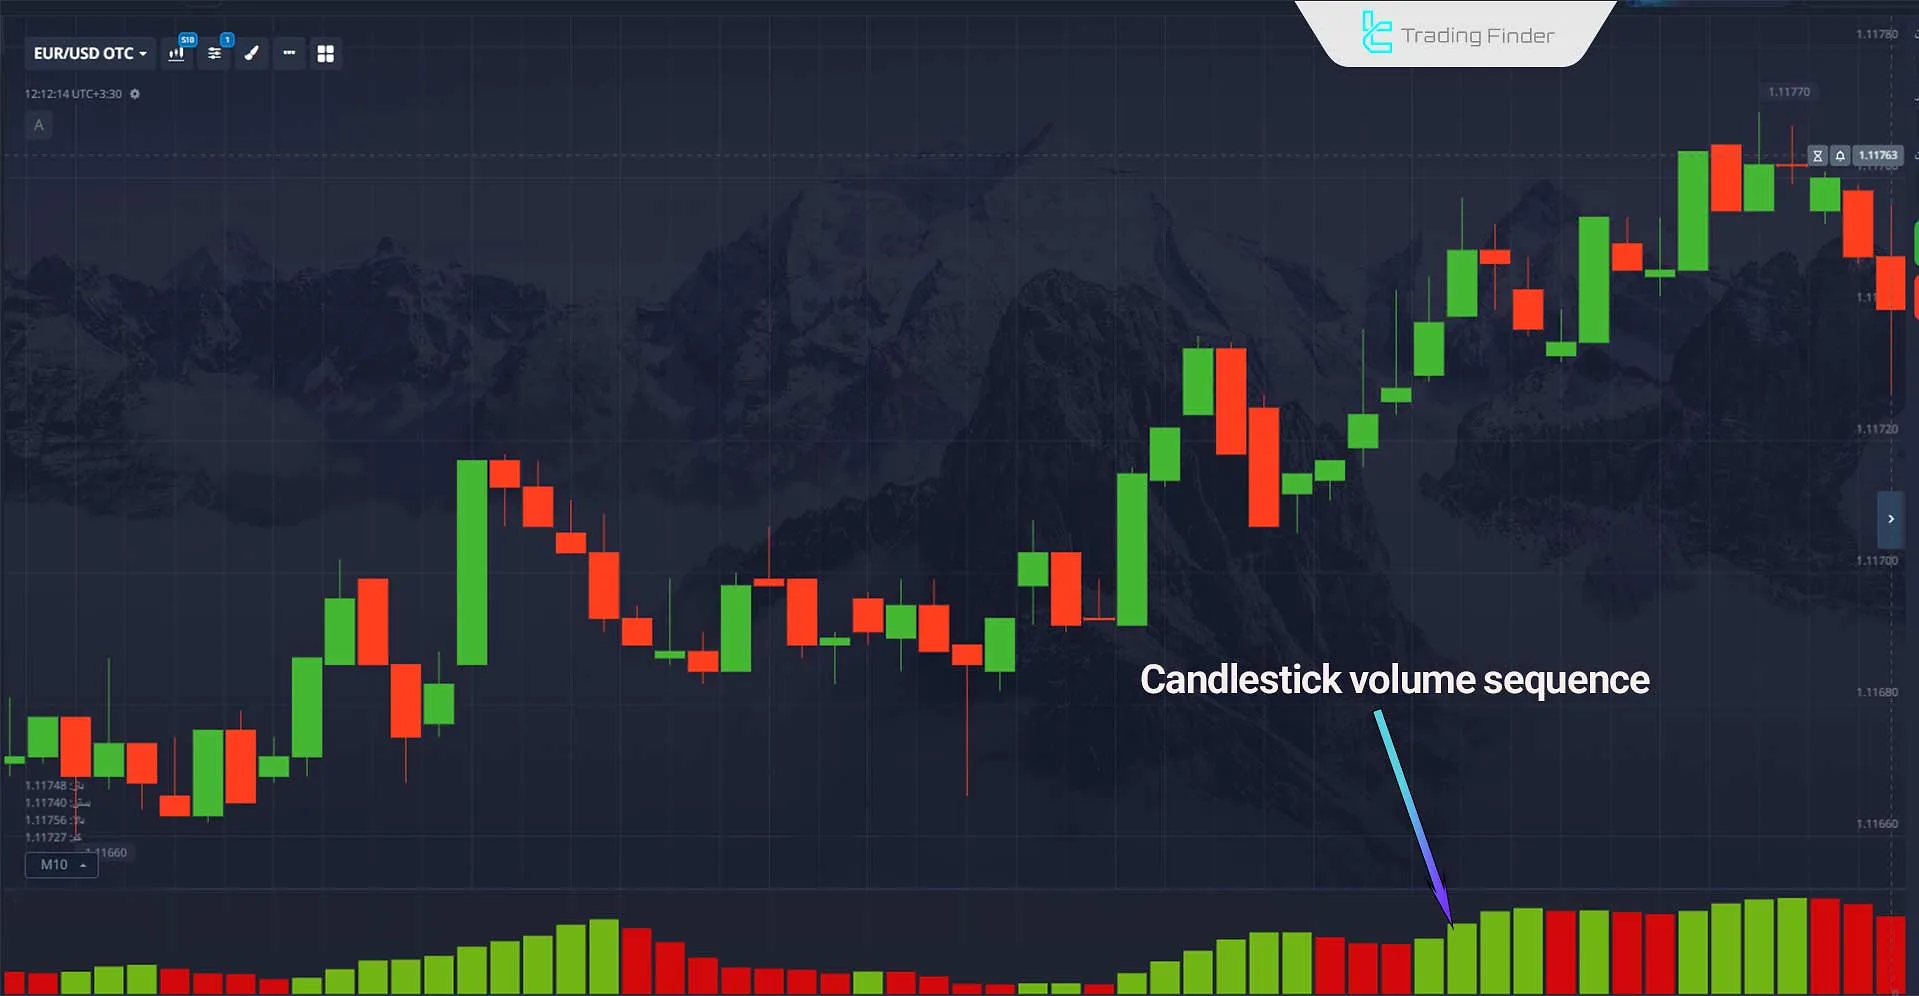
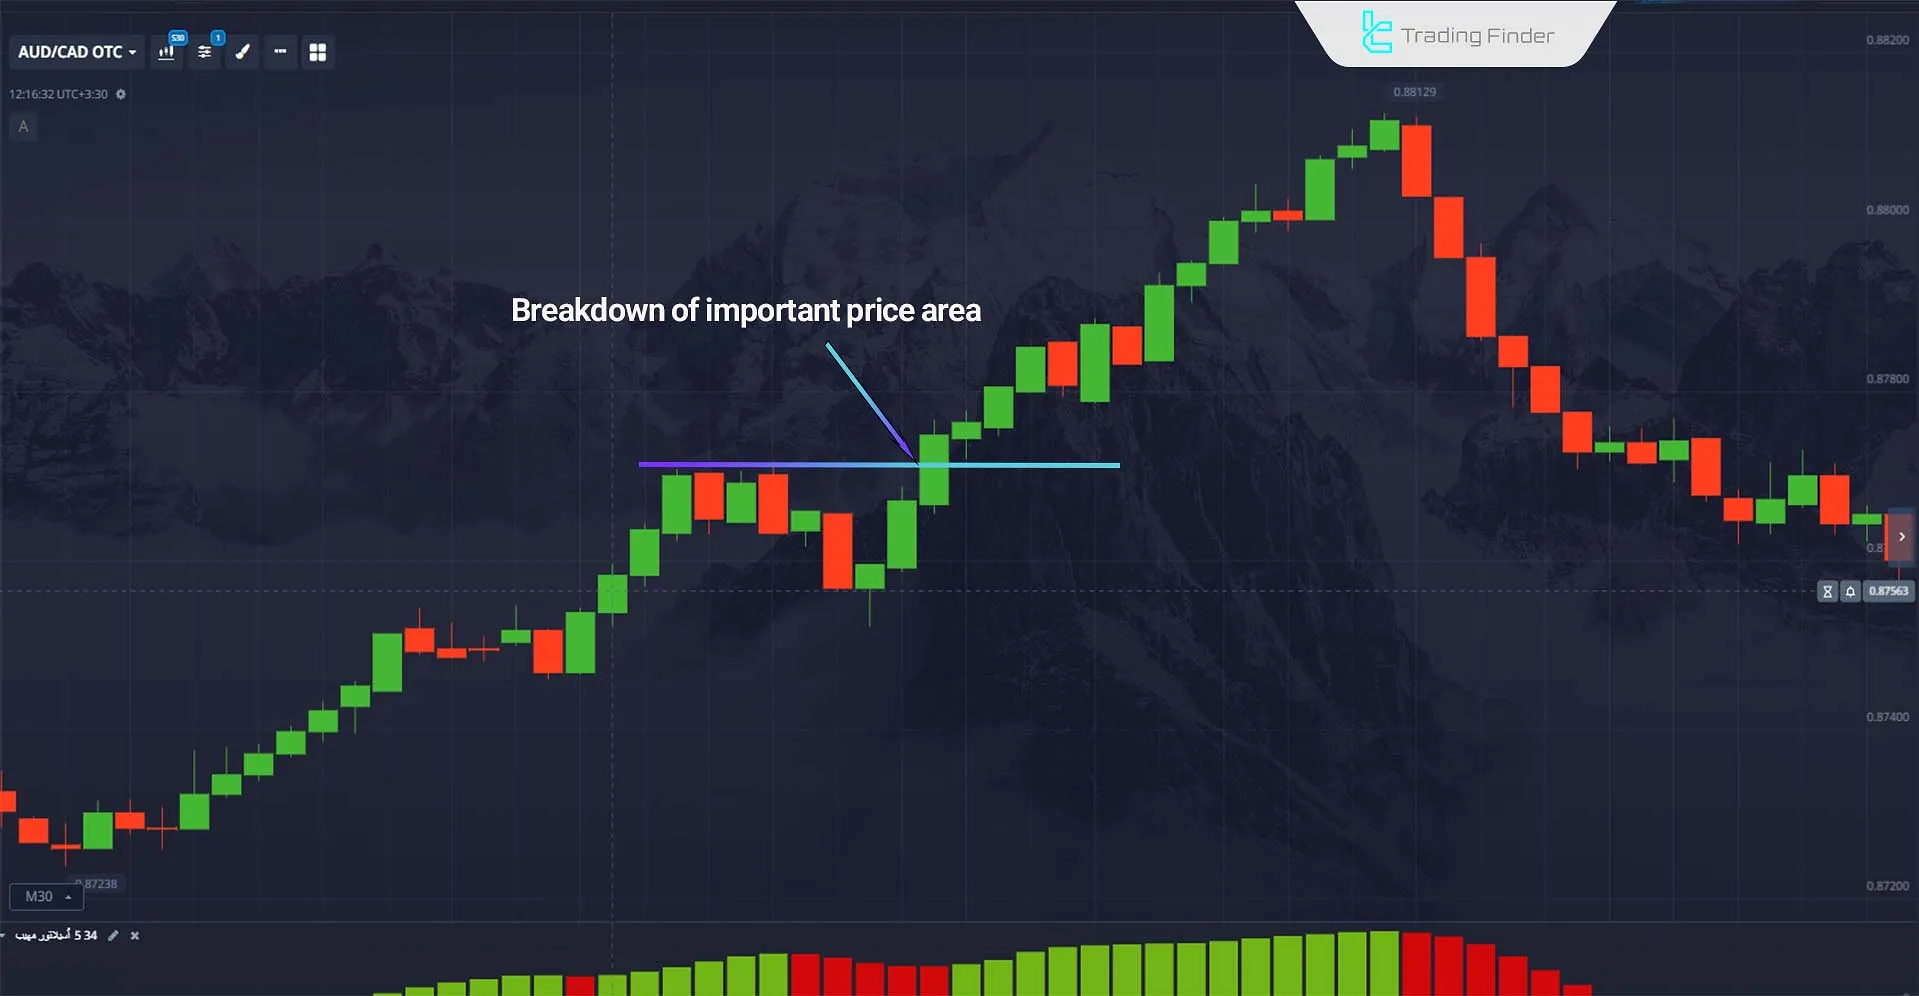
Example of Displaying Volume Bars on a Binary Options Chart
In the image below, volume bars at the bottom of the chart form an independent layer synchronized with price candles. Each bar corresponds to one candle, and its height reflects the trading intensity in that interval.
Bar colors can be aligned with candle close direction to strengthen the visual link between price movement and participation intensity. In this view, the sequence of bars matters for identifying active vs. inactive phases in options volume analysis.
A run of tall bars as price exits a compression zone flags the start of a new wave. A stretch of short bars within a tight range signals relative stasis and favors range strategies.
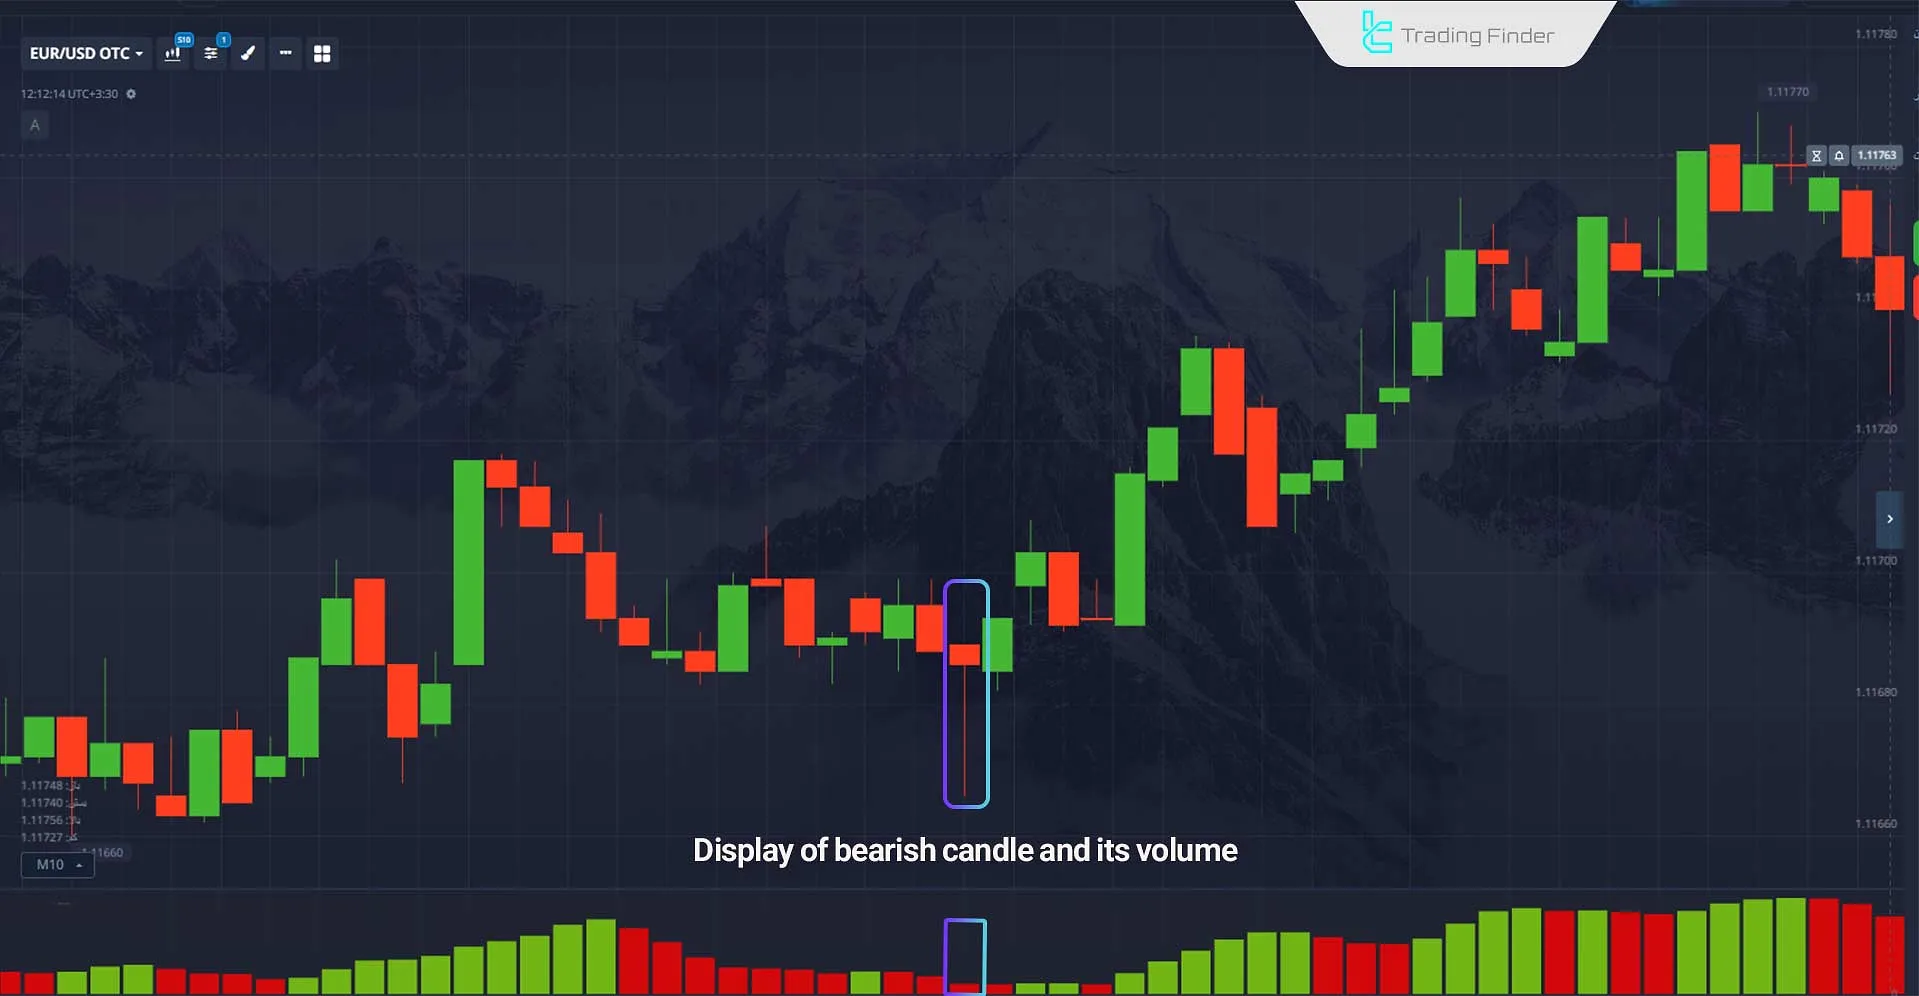
Interpreting Bar Lengths in Binary Options
An exceptionally tall bar at the moment of breaking a key level indicates an order rush and raises the odds of continuation; a series of shrinking bars during an up-move reveals waning buy-side energy and suggests a pause or reversal scenario.
A tall bar on a price rejection from a supply or demand level points to strong defense at that level and increases the credibility of the reversal; a cluster of short bars before major news depicts a waiting phase, and once the news drops, a sudden bar surge clarifies the dominant path.
Overlaying Volume Bars with Drawing Tools in Binary Options
Overlaying volume bars with drawing tools such as trendlines and key zones plays a confirming role. If price breaks a trendline and a sequence of tall bars appears, the breakout structure is assessed as firmer.
If price crosses a level without a notable rise in bars, the odds of a pullback increase.
For boundary contracts and short expiries, observing bar behavior over the past few candles relative to the period average provides a practical basis for choosing the expiry window and reduces decision slippage.
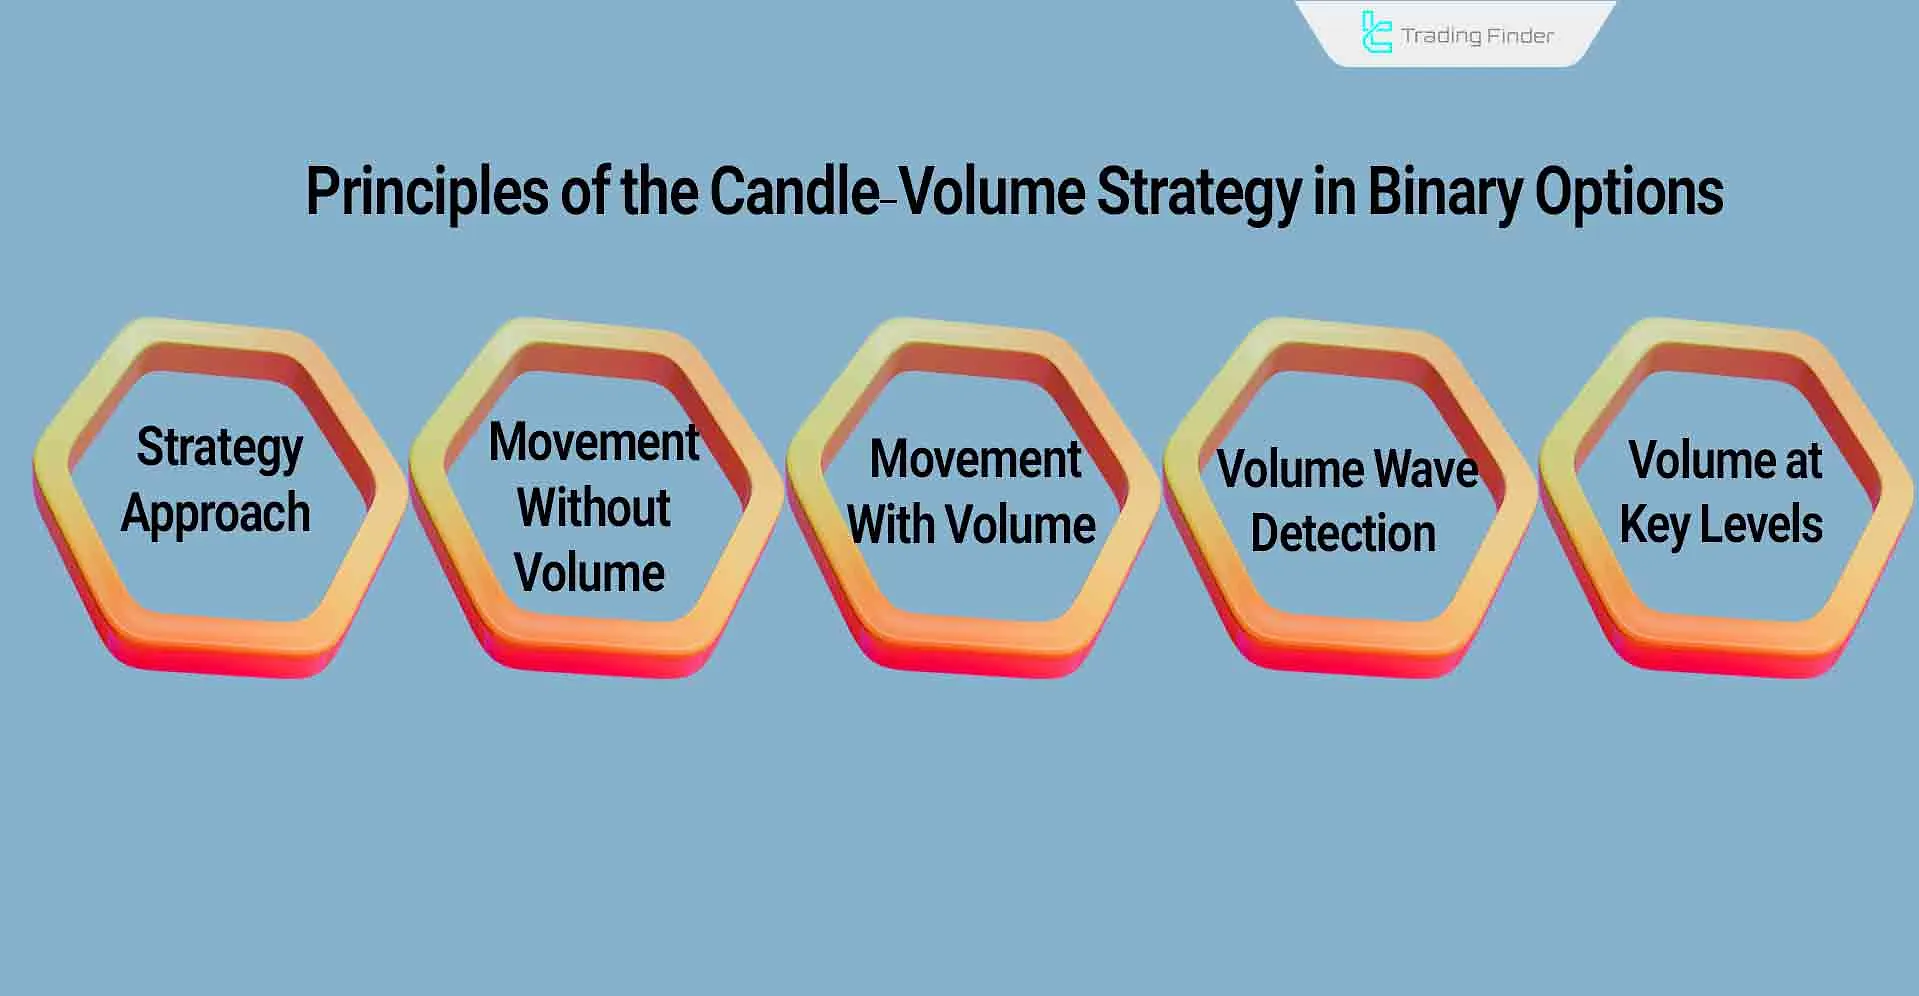
Principles of the Candle–Volume Strategy in Binary Options
The candle–volume strategy in trading with Volume Analysis in binary options is built on synchronizing candle analysis with the structure of trading volume. In this approach, price action alone is not a sufficient decision criterion, because any swing is valid only if its volume backing is identified.
When price moves in one direction without volume support, the likelihood of a pullback or stall rises. Conversely, price movement accompanied by increasing volume signals the presence of powerful capital flow and a persistent market bias in the same direction.
Therefore, in options volume analysis, distinguishing high-volume vs. low-volume waves directly affects the choice of expiry and contract type.
Moreover, the behavior of candles near key levels, when compared with Volume trading binary options, clarifies the quality of breakouts and reversals, transforming entry from a superficial level to a structural point as follows:
- Combined assessment of candle size and trading volume
- Validating price movement based on volume support
- A large candle with high volume indicates continuation in the dominant flow
- A large candle with low volume suggests a superficial move prone to reversal
- A small candle with high volume signals intense buyer–seller engagement
- Paying attention to volume structure as price nears key levels
- A level breakout is valid only if accompanied by rising volume
- Price rejection from a level with rising volume strengthens the reversal
- Selecting contract expiry based on the strength of volume waves
- Using volume to distinguish persistent waves from transient move
- Focusing on price–volume alignment or mismatch to identify decision points
- Watching volume behavior at the start and end of trend wave
- Avoid relying on candle shape without examining underlying volume
- Prioritize trending conditions over thin, directionless markets
- Use volume to filter false signals on short timeframes
- Build decisions on the interaction of price and volume, not merely candle appearance
- Evaluate volume at touches of supports and resistances
- Use volume to identify continuation vs. reversal waves
- Detect shifts in momentum via increases or decreases in volume
- Implementing expiry-time management based on the strength and durability of volume waves
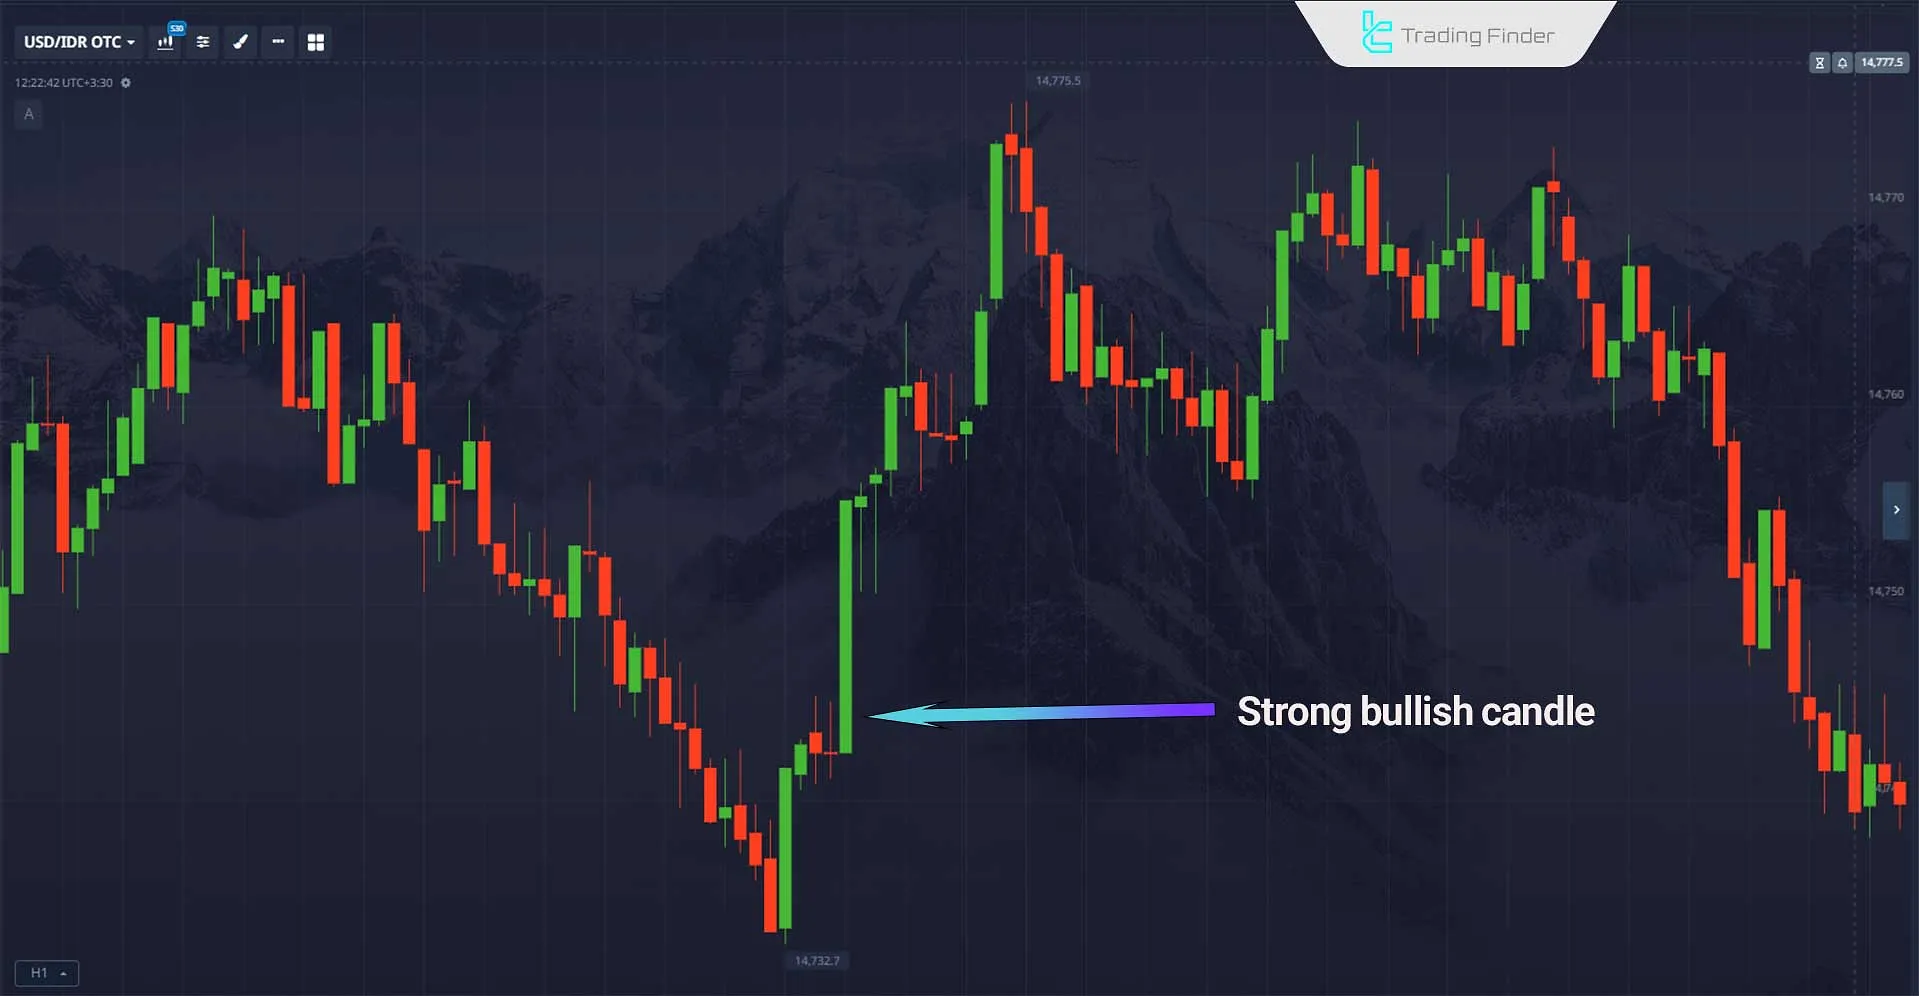
The Concept of Candle Strength vs. Volume Strength in Binary Options
Candle strength describes the difference between open and close alongside wick lengths and shows which side controlled the session.
Volume strength indicates how much trader participation supported that control. When candle strength and volume strength align, the price move is analytically more credible.
A strong bullish candle with high volume signals real, persistent buy pressure. A strong bearish candle with high volume reflects the structural power of sellers.
Candle strength is meaningless in a vacuum. Its reading depends on the candle’s location relative to key levels. If a strong candle forms near resistance without a volume increase, the market has not yet achieved the price acceptance needed for continuation. If a strong, high-volume candle clears resistance, the breakout is treated as valid.
The same logic applies at support. A strong bearish candle with low volume at support indicates weak sell pressure and raises the chance of basing or reversal.
A strong bearish candle with high volume at the same area suggests a broken support and the start of a new down-leg.
Candle strength vs. volume strength directly influences expiry selection. When both candle and volume expand together, wave length becomes more predictable and expiries aligned with the move are practical.
When the candle is strong but volume gradually declines, the move’s horizon shortens and shorter expiries are preferable. In real-time analysis, volume strength gauges the seriousness of the move, while candle strength shows its direction.
Combining these two factors elevates binary-options analysis from mere price observation to evaluating the market’s driving force.
Introducing a Volume Indicator for Binary Options
The Automatic On-Balance Volume Divergence (OBV Divergence) indicator on MetaTrader acts as a momentum tool that reconciles price action with volume flow.
By analyzing the OBV line and comparing its direction with the price trend, the indicator automatically detects bullish and bearish divergences; thus, the trader no longer needs to identify these conflicts manually. This improves decision speed and accuracy in spotting reversal zones.
Signals are displayed via color coding: Buy signals appear in blue, and Sell signals appear in pink.
This indicator belongs to oscillators and signal generators and suits beginners, scalpers, and intraday traders.
It works across a wide range of timeframes—M1, M5, M15, M30, H1, and H4—and is compatible with forex, crypto, stocks, and indices.
YouTube video:
The indicator’s logic is based on conflicts between price direction and OBV direction.
For example, if price makes a new low in a down structure while OBV is rising, that implies weakening sell pressure and a potential turn to an uptrend; therefore, a buy signal is generated.
Conversely, if price prints a new high but OBV declines, that area indicates weakening demand and a possible reversal toward the downside, in which case a sell signal appears.
In the settings, parameters such as the OBV calculation period (default 14), the number of candles used to identify pivots, allowable distance between pivots, the number of breaks, as well as line colors and thicknesses are configurable.
- Download Automatic On-Balance Volume Divergence indicator for MetaTrader 4
- Download Automatic On-Balance Volume Divergence indicator for MetaTrader 5
Analyzing the Balance Between Buyer and Seller Pressure in Binary Options
At any moment, the balance between buyers and sellers results from the net weight of buy-side vs. sell-side force. Candles display the direction, volume, and intensity of that force.
If consecutive bullish candles form with rising volume, the structural flow tilts toward buying. If consecutive bearish candles form with rising volume, sellers dominate the flow.
The Concept of Balance Between Buyers and Sellers
Market structure at any moment is the outcome of buy and sell forces combined. Candles serve to visualize their direction, intensity, and magnitude.
Small candles with high volume signal fierce engagement between buyers and sellers; this typically appears around trend-turning zones.
Identifying the Dominant Flow by Combining Candles and Volume
Back-to-back bullish candles with rising volume indicate a structural bias toward buying. Conversely, successive bearish candles with growing volume confirm sell-side dominance.
If candles reverse direction while volume is flat or declining, the market is in a waiting/energy-transfer phase and has not chosen a definitive path.
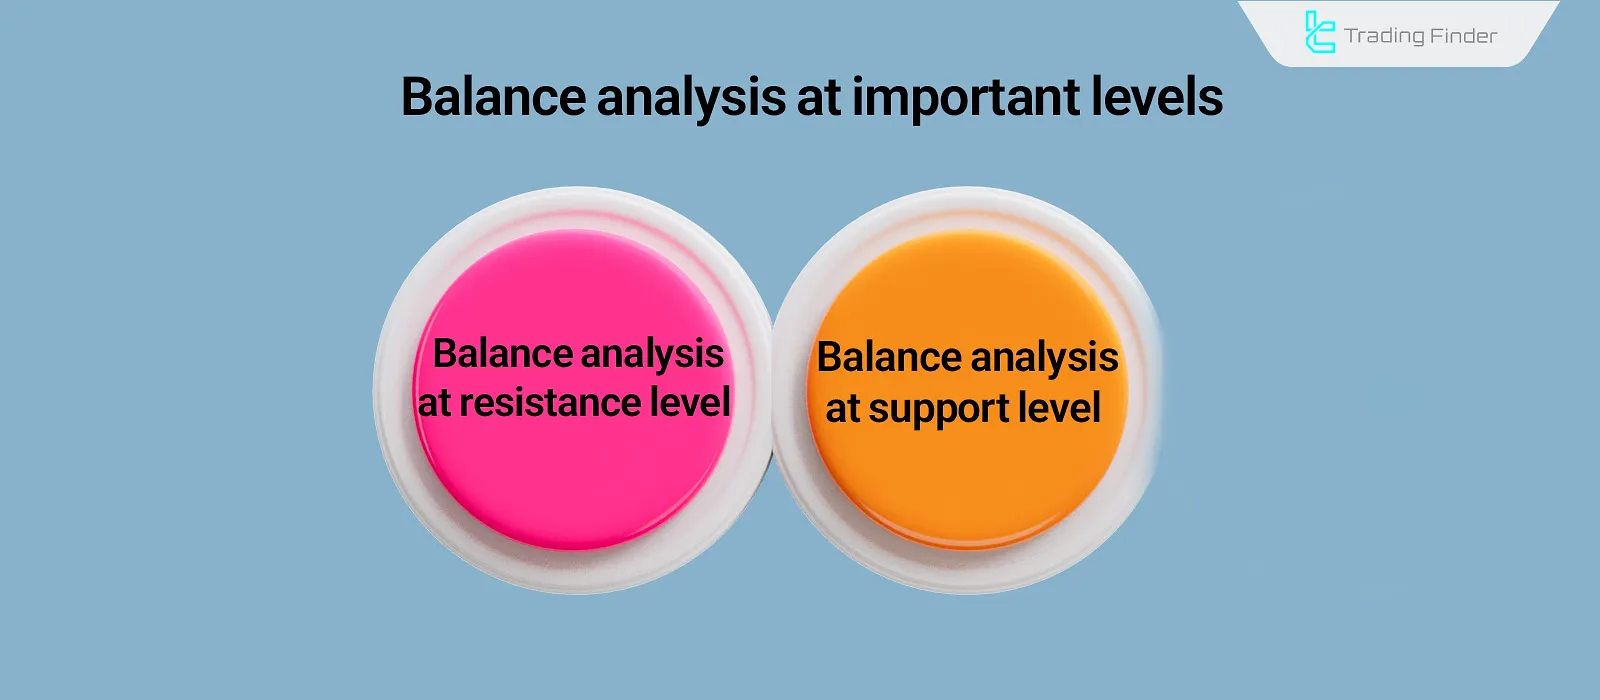
Balance Analysis at Key Levels (Support and Resistance)
In support and resistance zones, the buy–sell balance is crucial. The combination of candle behavior and volume shows which side holds the dominant force and whether the level is likely to hold or break structurally.
- Balance analysis at resistance: a bullish candle with declining volume signals buyer weakness. A high-volume bearish candle at the same area strengthens the odds of a reversal;
- Balance analysis at support: a low-volume bearish candle indicates seller weakness. A high-volume bullish candle at this level can start a new wave.
Signs of Abnormal Candles in Binary Options
Abnormal candles are identifiable when candle size behavior does not align with accompanying volume. A long candle with very low volume is a common sign of a manufactured move.
Here, price traveled far, but real market participation was limited; this structure often forms near levels where higher-liquidity players want to stir smaller traders.
Such a candle is unreliable for trend analysis and carries a high probability of stalling or reversal.
A small candle with high volume is also significant. In this case, the market is locked in an intense battle between buyers and sellers. When equally matched forces engage at high intensity, the area is known as an energy-absorption zone.
This candle type at support or resistance boosts the level’s significance and sets the stage for a valid rotation or breakout.
Long-wick candles with high volume are another analyzable abnormal pattern.
A long wick reflects one side’s attempt to seize control of price, while high volume shows a powerful response from the other side; this commonly appears near structural decision levels and can kick off a new wave.
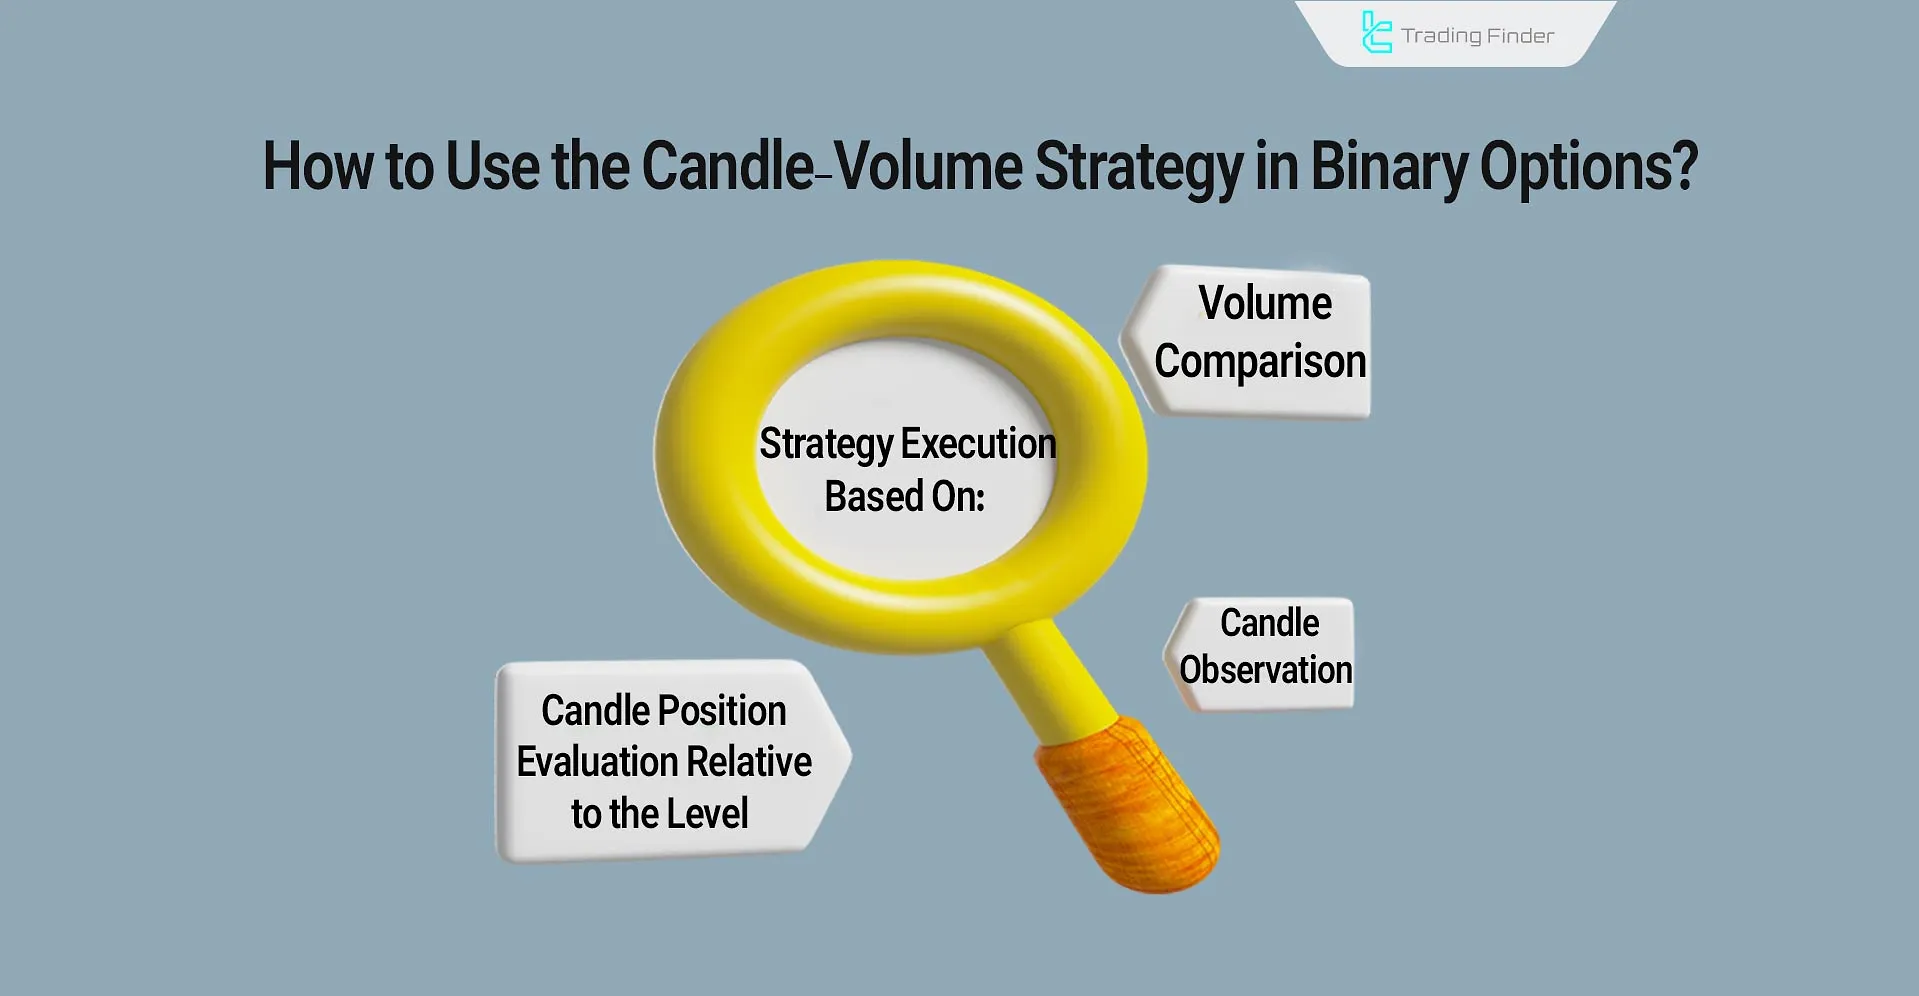
How to Use the Candle–Volume Strategy in Binary Options
Executing this strategy rests on a sequence of three core steps:
- Observing the candle
- Comparing volume
- Evaluating the candle’s location relative to the level
These three layers provide a clear picture of the active force in the market and enable logical selection of contract type and expiry as follows:
#1 Candle Structure Analysis
First, examine the candle’s shape. Body size and wick length reveal which side had greater power during the session. Strong candles indicate one side’s dominance and form the initial directional bias.
#2 Comparing Volume with Candle Strength
Next, assess trading volume. If candle thrust aligns with volume, the move is structural and reliable. If the candle is strong while volume wanes, the move is superficial and prone to reversal. Candle interpretation is incomplete without volume.
#3 Candle Location Relative to Key Levels
In the third step, evaluate the candle as it interacts with support and resistance:
- When a strong candle with high volume clears resistance, a valid breakout forms and buying flow dominates; in such conditions, bullish contracts with expiries aligned to the wave are suitable;
- If a strong candle with low volume closes at support, sell pressure lacks the strength to punch through and the odds of a bounce rise; short-term reversal contracts fit better.
#4 Managing Expiry Based on Market Volume Conditions
In active trends, track the sequence of candles and volumes:
- In an uptrend with rising volume, longer expiries carry greater reliability;
- If volume declines, the wave may stall and the market may enter a narrow range—consider shorter expiries or range contracts;
- In thin markets, short, non-structural moves dominate and reversal strategies around support/resistance work better;
In heavy, high-pressure markets, trends are clearer and directional contracts align better with structure.
#5 The Importance of Repetition and Logging Market Behavior
Proper application requires observing and comparing candle–volume behavior across similar contexts. Markets create repeating behavior patterns; recognizing them systematizes and strengthens decision-making.
By calibrating the relationship between price movement and participation intensity, the candle–volume strategy becomes a stable framework for selecting entry points and contract types.
Trading Strategies for Low-Volume Conditions in Binary Options
In low-volume conditions, participation is reduced and moves lack structural power. Price tends to make short, compact swings; short-term flows start and stop. Strategies here focus on range control and identifying reaction points as follows.
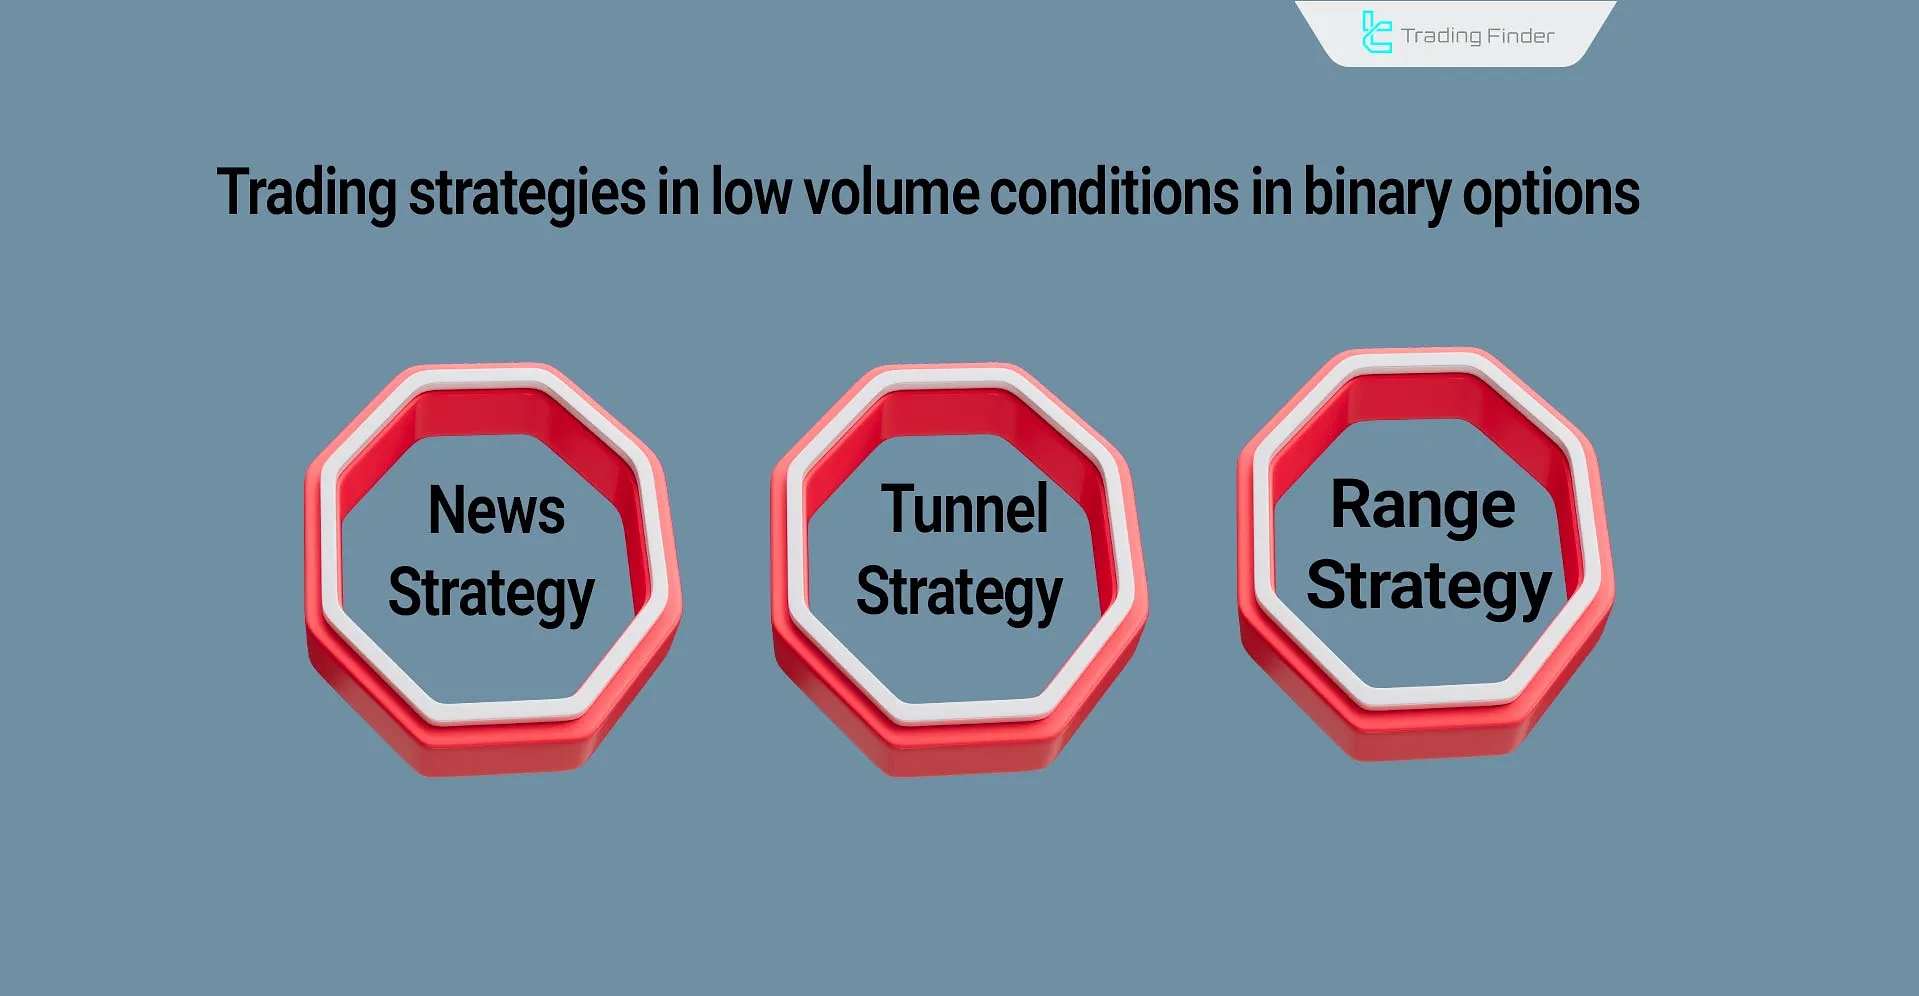
News Strategy
Before economic releases, markets enter wait-and-see mode and volume contracts; this brief silence creates opportunity.
When the news drops, volume jumps and the dominant direction emerges. Trades should be positioned before the release to capture the initial volume wave in the expected direction.
If expectations are positive, choose a bullish trade with a short expiry; if negative, a bearish trade with a short horizon is appropriate.
If the market’s read is unclear, a straddle—simultaneous entries in both directions with range management—may be used (not recommended for beginners).
Tunnel Strategy
Under low volume, price often oscillates between two parallel trendlines, forming a tunnel-like range on the chart.
The aim is to trade within the tunnel; since swings are stable and short in amplitude, contract expiries should also be kept short.
Range Strategy
With low volume, support and resistance take center stage. Zones that have previously triggered reversals are prime for analysis.
“In/Range” trades are placed when price nears the range top and signs of waning thrust appear. As price approaches the bottom and sell pressure eases, the reversal scenario activates.
These three strategies create a predictable decision framework and reduce risk in markets that are naturally thin or before news.
Those interested in using volume strategies in binary-options trading can also watch the “GuruTrader” tutorial on YouTube:
YouTube link:
Trading Strategies for High-Volume Conditions in Binary Options
In high-volume environments, liquidity is active and moves are more clearly structured. As a result, stronger trends form and breakouts become more dependable.
Moving-Average Crossover
In powerful waves, a crossover of the short-term moving average above the long-term average signals the start of a new trend.
If the crossover coincides with increasing volume, the emerging trend gains sturdiness, and directional contracts with expiries matched to wave length are justified.
If volume fades after the crossover, it indicates trend fatigue; shorter expiries are preferable.
Breakout Strategy
At key chart zones, a volume increase at the instant of crossing the level is the primary criterion for a valid breakout.
If resistance breaks on high volume, continuation odds are high. Conversely, if support breaks on strong volume, a persistent down-wave is likely.
When a breakout occurs on weak volume, a quick reversal is possible. In such cases, choose expiries aligned with the dominant, higher-time bias for greater precision.
Momentum Strategy
In high-volume markets, momentum is the guide. If fast, long candles develop alongside rising volume, the dominant flow is visible.
Directional trades are appropriate while volume continues in the move’s direction. Falling volume signals a pause or the onset of consolidation.
The Impact of Volume on Spread and Liquidity in Binary Options
With high volume, bid-ask spreads tighten and execution becomes smoother. With low volume, spreads widen and entering/exiting at desired prices becomes harder.
This factor directly affects the hidden cost of each trade and determines execution quality.
Slippage occurs when execution price deviates from the expected price. In high-volume conditions, slippage is limited because sufficient orders exist to fill the market flow.
In low-volume conditions, slippage increases and securing good entry prices becomes structurally difficult. This makes precise selection of expiry and contract type essential.
Conclusion
Trading with volume in binary options plays a structural role in evaluating the credibility of price moves and reveals the true extent of trader participation.
Reading candle behavior and volume intensity together identifies the dominant market path and prevents shallow interpretations of short, unsupported moves. When strong candles coincide with rising volume, trends are clearer and continuation odds increase.
When candles grow while volume falls, the move lacks energy and the chances of a pullback or consolidation rise.
In low-volume conditions, markets are more sensitive to narrow ranges and short reactions, and range, tunnel, and news strategies perform more precisely. In high-volume conditions, trends are more apparent, and breakout, momentum, and MA-crossover strategies are more suitable.


