


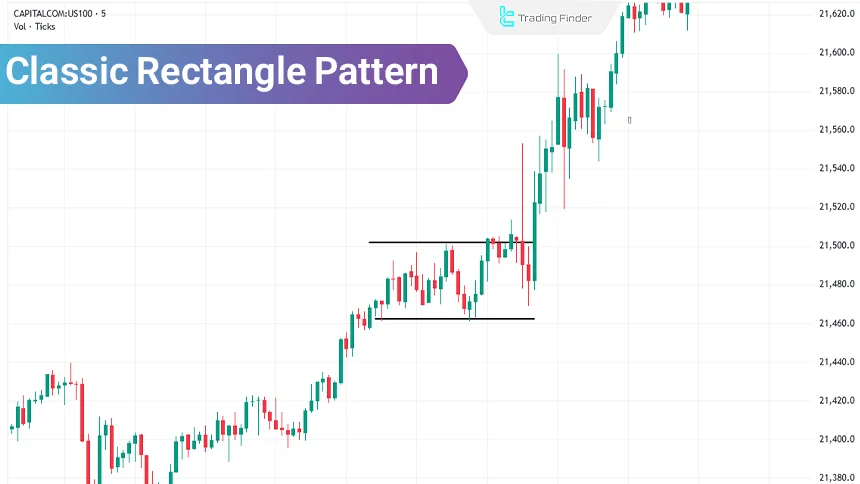
The classic rectangle pattern represents market indecision and an equal balance between buyers and sellers. As a result, this pattern forms two parallel support and resistance lines, creating a rectangle on the chart where price fluctuates within a defined range.
Trading opportunities exist both during the formation of the pattern and at the breakout phase. By using Limit Orders and Market Orders, traders can execute trades based on this classic continuation pattern.
Combining other technical analysis concepts such as candlestick patterns, momentum, and similar tools increases the win rate of trades based on the classic rectangle pattern.
What Is the Rectangle Pattern?
The rectangle pattern is one of the classic chart patterns that forms during a balance between supply and demand. When price moves between two parallel support and resistance lines and the market enters a ranging phase, a rectangle pattern is formed.
This structure is classified as a classic continuation pattern. This means that if the rectangle pattern forms during a trending market phase, the probability of a breakout in the direction of the prior trend is higher than a breakout against it.
This explanation directly answers the question: What is rectangle pattern in technical analysis?
On the Trade Legend YouTube channel, the classic rectangle pattern is explained in video format:
What Are the Advantages and Disadvantages of the Rectangle Pattern?
The classic rectangle pattern is effective for identifying trend continuation without the need for complex analytical tools. However, in some cases, false breakouts may lead to losing trades.
Advantages | Disadvantages |
Applicable across all timeframes | Possibility of false breakouts |
Usable in all financial markets | Requires combination with other technical analysis concepts |
No need for complex tools or analysis | Requires high experience and skill in using classic patterns |
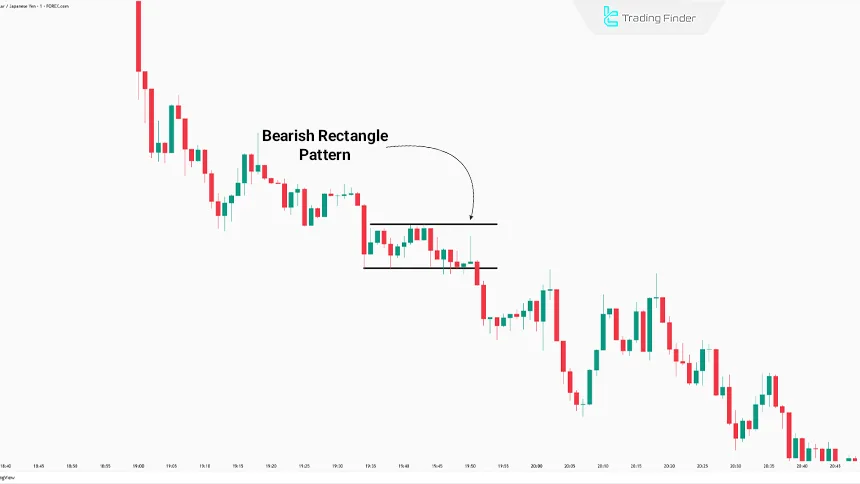
Bearish Rectangle Pattern
When the prior trend before the formation of the rectangle pattern is bearish, the probability of a downside breakout increases. Therefore, a rectangle pattern formed at the end of a bearish trend is called a bearish rectangle pattern.
Bullish Rectangle Pattern
If price action is bullish before the formation of the pattern, the probability of a breakout above the rectangle resistance at the end of the trend is high. Accordingly, a rectangle pattern formed at the end of an uptrend is referred to as a bullish rectangle pattern.

The Logic Behind the Formation of the Rectangle Pattern in the Market
The rectangle pattern forms when the market enters a phase of temporary equilibrium between supply and demand.
In this situation, buyers and sellers reach a relative consensus, and price oscillates within a horizontal range. This behavior typically appears after a sharp move or before a major market decision.
From a price action perspective, the rectangle may indicate order accumulation in the middle of a trend or order distribution near price highs. For this reason, the pattern is not merely a geometric structure but a reflection of a temporary pause in market liquidity flow.
When Should You Not Trade the Rectangle Pattern?
The rectangle pattern does not always provide a favorable trading opportunity. When the pattern range is excessively narrow, the risk-to-reward ratio decreases significantly. Additionally, in low-volatility markets or during low-volume sessions, breakouts are often unreliable.
Major economic news releases, very low timeframes, and rectangle patterns forming against the higher-timeframe trend are other conditions that increase the likelihood of trading errors.
In the rectangle pattern tutorial article, Investopedia explains the formation and trading methods of this pattern.
How to Enter Trades Using the Rectangle Pattern
Trade entries using the classic rectangle pattern can be executed in two ways:
- Trading inside the pattern
- Trading after the breakout
Trading Inside the Rectangle Pattern
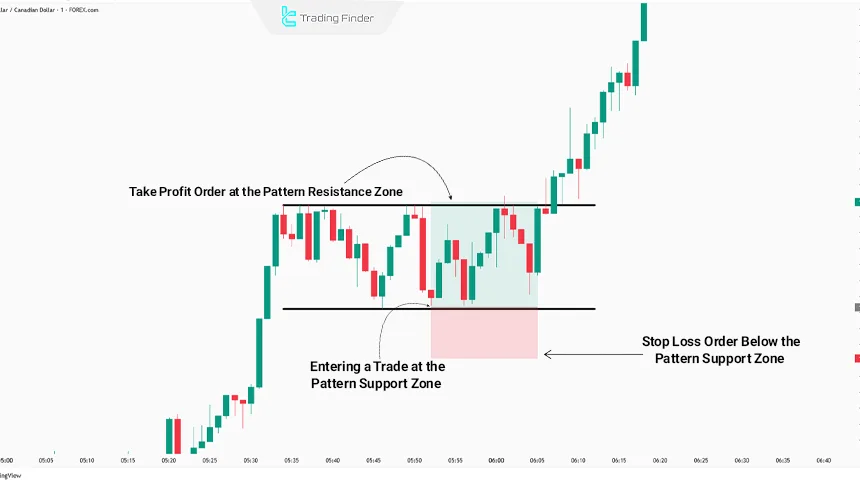
In this approach, depending on the trading strategy, traders use Limit Orders and Market Orders. When price reaches the support line of the pattern, a buy trade is executed, and when price reaches the resistance zone, a sell trade is opened.
Take Profit and Stop Loss orders for trading inside the rectangle pattern:
- Take Profit Order: This order is placed at the opposite boundary of the rectangle, depending on whether the trade is executed at support or resistance;
- Stop Loss Order: This order is placed at a distance equal to half of the pattern range, above or below the resistance or support zone.
Example of Trading Inside the Rectangle Pattern
In this example, price enters a horizontal range after an upward move and forms a rectangle pattern.
Price behavior within this range indicates that the market has not yet made a final decision regarding trend continuation or reversal, and fluctuations between the upper and lower boundaries continue.
In the inside-rectangle trading strategy, entries are executed near the support boundary, with the stop loss placed slightly below the lower boundary to control risk in case of an unsuccessful breakout.
Simultaneously, the upper boundary of the rectangle serves as a temporary target or exit zone.
This type of trading is more suitable for low-volatility markets or traders seeking short-term range trading, as the market structure remains ranging until a valid breakout occurs.
Note: If a trade is executed in the direction of the trend before the formation of the rectangle, it may be held until a breakout occurs. However, holding trades under these conditions carries risks such as failure to break the range and potential price reversal.
Trading After the Breakout of the Rectangle Pattern
In this method, the trader waits for the pattern to break. After the breakout, trade entry can occur in two ways:
- Entry after a pullback: After the breakout, price often revisits the broken level, absorbs liquidity, and then continues its move;
- Entry at the moment of breakout: In this approach, a Limit Order is placed above or below the resistance or support zone so that the trade is activated upon breakout.
Typically, after breaking a rectangle pattern, price continues its movement by a distance approximately equal to the height of the pattern.
By measuring the pattern height, the take profit zone can be determined. For stop loss placement, the area behind the breakout candle is considered appropriate.
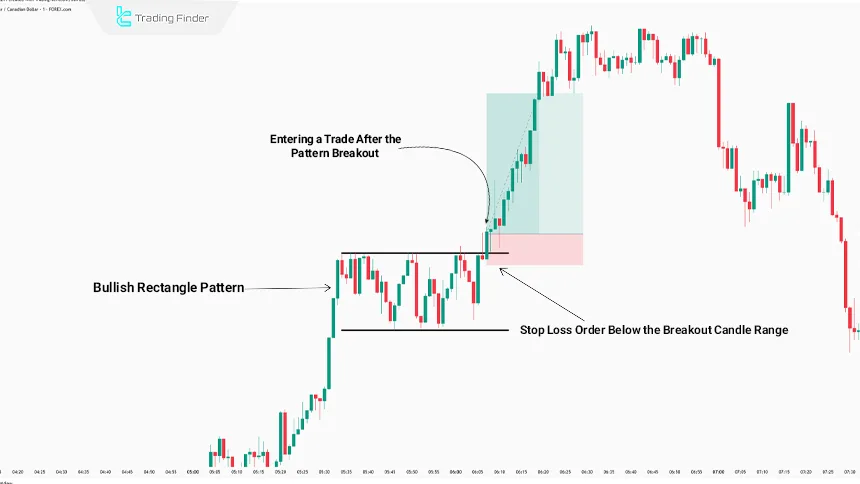
Example of Trading After the Rectangle Pattern Breakout
In this example, price enters a ranging phase after an upward move and forms a bullish rectangle pattern. The horizontal oscillation between the upper and lower boundaries indicates a temporary pause and order accumulation before a decisive market move.
After breaking above the rectangle resistance, the trade is entered following breakout confirmation. In this scenario, the stop loss is placed below the breakout candle to manage risk if price re-enters the range.
The sharp price movement following the breakout indicates a valid breakout, showing that the market has entered a continuation phase after absorbing liquidity within the range. This type of entry carries less risk than trading inside the pattern and aligns with the overall market structure.
Difference Between a Real Breakout and a False Breakout in the Rectangle Pattern
Not all rectangle pattern breakouts indicate the start of a new move. In many cases, price temporarily moves beyond the upper or lower boundary to collect liquidity and then quickly returns inside the range.
Comparison Table of Real Breakout vs False Breakout in the Rectangle Pattern:
Comparison Criteria | Real Breakout | False Breakout |
Price Behavior | Clear exit from the range with directional movement | Temporary breach followed by rapid return |
Candle Close | Valid close outside the rectangle | Close inside or near the range |
Trading Volume | Significant volume increase during breakout | Weak or irregular volume |
Reaction to Broken Level | Pullback and holding as new support or resistance | Failure to hold and re-entry into range |
Market Structure | Structure change or trend continuation | No structure change, range persists |
Price Target | Expansion and formation of a new wave | Stop hunting and liquidity grab |
Entry Validity | Suitable for post-confirmation entries | High risk and misleading |
Large Trader Behavior | Gradual and controlled participation | Creation of traps for retail traders |
Multi-Timeframe Analysis of the Rectangle Pattern
Analyzing the rectangle pattern on a single timeframe can be misleading. A rectangle observed on a lower timeframe may be part of a larger structure on a higher timeframe.
Combining higher timeframes to determine overall market direction and lower timeframes for precise entries increases the accuracy of rectangle pattern trading.
The Role of Volume in Validating the Rectangle Pattern
In the rectangle pattern, trading volume plays a critical role in evaluating pattern quality. Typically, volume decreases in the middle of the rectangle range, indicating a lack of interest in an early breakout.
In contrast, as price approaches the upper or lower boundaries, a relative increase in volume may signal the activation of large market participants.
A valid rectangle breakout is often accompanied by a sudden increase in volume, whereas low-volume breakouts usually result in price returning to the range and forming a fake breakout.
Simultaneous analysis of price structure and volume significantly reduces the probability of incorrect entries.
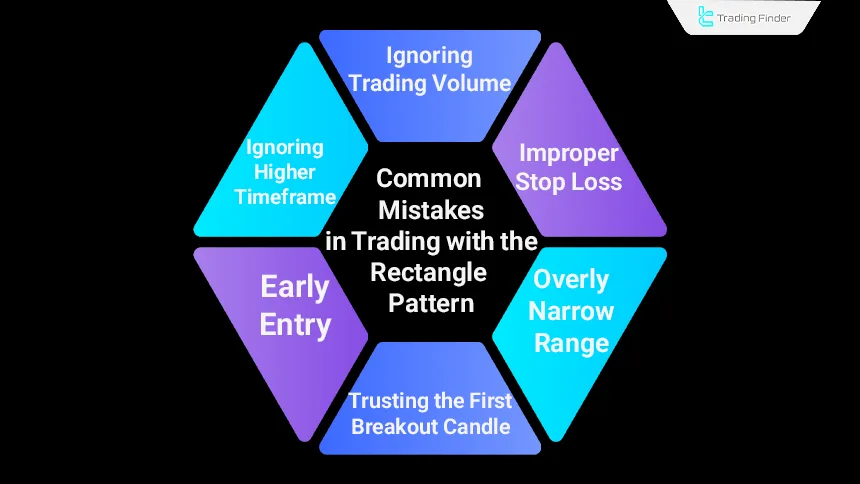
Common Trader Mistakes When Using the Rectangle Pattern
One of the most common mistakes is entering trades prematurely within the rectangle range without breakout confirmation. Trusting the first breakout candle, ignoring higher timeframes, and improper stop loss placement are other frequent errors.
Common mistakes in rectangle pattern trading:
- Early entry: Entering trades before price exits the rectangle range leads to exposure to neutral fluctuations and increased stop loss activation risk;
- Trusting the first breakout candle: The initial breakout candle is often deceptive and lacks validity without price consolidation;
- Ignoring higher timeframes: Rectangles forming against the higher-timeframe trend increase the risk of false breakouts;
- Overly narrow ranges: Highly compressed rectangles often lack sufficient space for price expansion and realistic targets;
- Improper stop loss placement: Placing stop loss inside the range exposes traders to normal market noise;
- Neglecting volume: Breakouts without volume expansion often lack real order backing.
How Can Rectangle Pattern Performance Be Improved?
Following principles such as risk and capital management, using candlestick patterns for trade confirmation, and analyzing market momentum improves the success rate of rectangle pattern trading strategies.
Key considerations for improving rectangle pattern trading performance:
- Combining with candlestick patterns: Using candlestick patterns as additional confirmation filters false breakouts;
- Analyzing market momentum: Increased momentum during breakout strengthens analysis validity;
- Capital and risk management: Proper risk management enables recovery from prior losses in future trades;
- Trading in the direction of the prior trend: Rectangle breakouts often align with the previous trend, making trend-following trades less risky.
Relationship Between the Rectangle Pattern and Market Structure
The rectangle pattern is most reliable when it aligns with the overall market structure. In an uptrend, a rectangle may act as a temporary pause before continuation, while near key highs, the probability of trend reversal increases.
Analyzing Higher High and Higher Low or Lower Low structures helps traders determine whether the rectangle functions as a continuation pattern or a warning of a market phase shift.
Application of the Rectangle Pattern in Smart Money Trading Styles
In Smart Money concepts, the rectangle pattern is often viewed as a liquidity accumulation zone. The upper and lower boundaries of the rectangle frequently contain pending orders and stop losses of retail traders.
In this approach, initial breakouts are not necessarily entry signals but tools for liquidity absorption before the main market move.
Sideways Market Detection Indicator
The Sideways Detector indicator is a specialized technical analysis tool designed to identify neutral and non-trending market conditions.
By analyzing price behavior and processing historical data, the indicator highlights zones where relative balance between buying and selling pressure exists and the market enters an indecisive phase. These zones are typically displayed as price boxes, providing a clear view of actual market conditions.
The primary function of Sideways Detector is to differentiate ranging phases from trending phases. Many trading errors occur when traders apply trend-following strategies in neutral markets without recognizing this distinction.
By defining limited fluctuation ranges, the indicator helps traders avoid low-probability entries and focus on more logical scenarios. In such conditions, the ranging zone may serve as an exit area for active trades or a suitable environment for short-term range trading.
The price boxes drawn by Sideways Detector often act as dynamic support and resistance levels. Price reactions at these boundaries provide valuable insight into buyer and seller strength.
When price successfully exits the range with a confirmed candle close, the probability of the neutral phase ending and a new directional move beginning increases. This feature allows the indicator to assist not only in range identification but also in potential breakout detection.
The Sideways Detector indicator can be used across various markets such as Forex, cryptocurrencies, and stocks, and is compatible with intraday trading styles and multi-timeframe analysis. Customizable settings allow sensitivity adjustments based on market volatility.
Parameters such as minimum range width, volatility tolerance, and the number of analyzed candles provide precise control over indicator behavior.
Overall, Sideways Detector is suitable for traders seeking a deeper understanding of market structure and who want to confirm actual price conditions before entering trades. By highlighting neutral phases, the indicator plays an effective role in risk management and trading decision optimization.
Conclusion
The classic rectangle pattern is a continuation pattern that forms at the end of trends and increases the probability of trend continuation. However, this pattern does not always indicate continuation, and in some cases, it may break against the prior trend and change price direction.
The pattern forms in two variations, bullish and bearish, each indicating potential continuation of upward or downward trends.
Rectangle pattern trading can be executed through two main approaches that include trading while the pattern is forming and trading after the breakout, and combining this method with additional technical analysis tools such as candlestick patterns and momentum analysis can significantly increase the trade win rate.


