


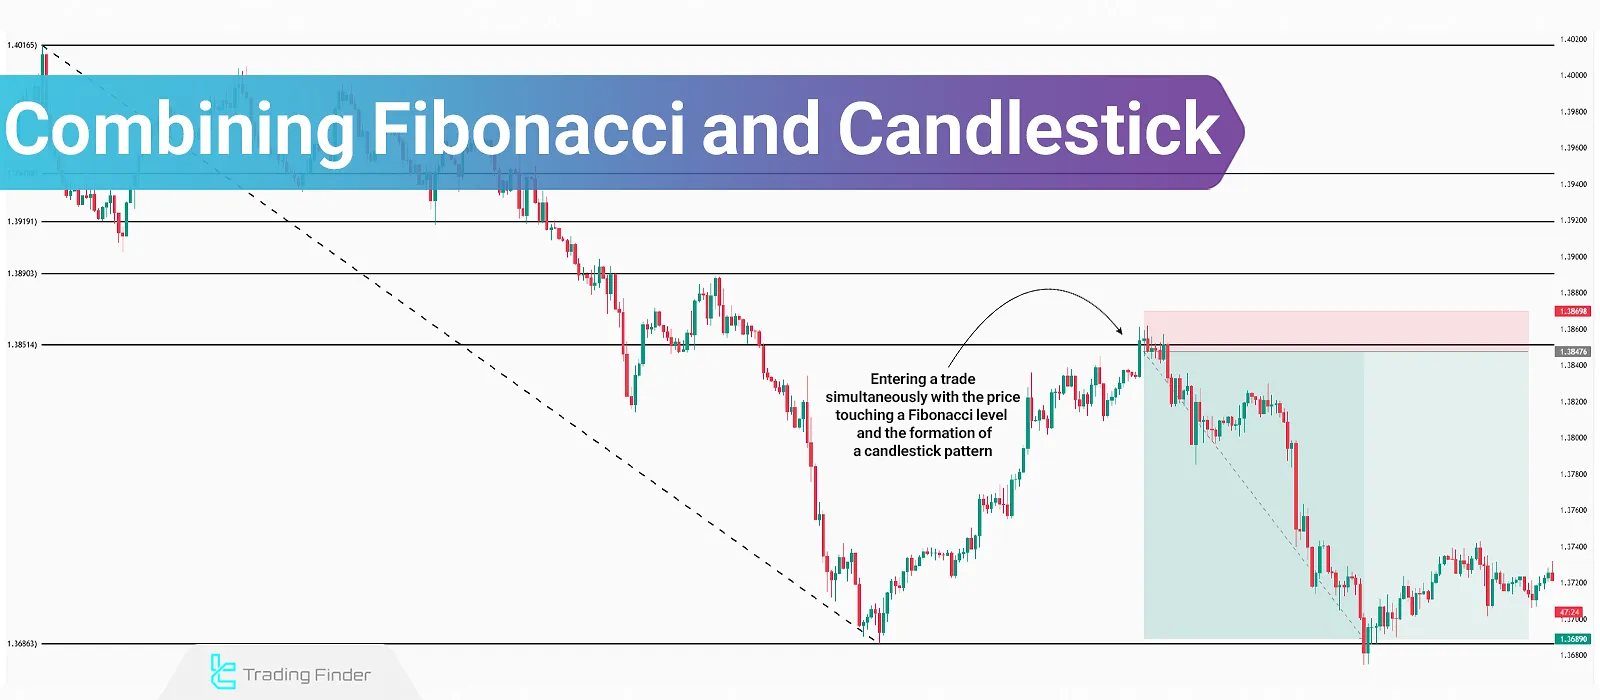
The Fibonacci tool offers high compatibility with other technical analysis concepts such as support and resistance, classic patterns, trendlines, and more. Therefore, combining this tool with various elements like support and resistance or classic patterns creates different trading strategies.
Additionally, Candlestick patterns are suitable for identifying trade entry points and setting stop-loss orders. These patterns help in determining the exact entry point and configuring stop-loss and take-profit orders in areas defined by the Fibonacci tool.
Why Should Fibonacci and Candlestick Patterns Be Combined?
Although Fibonacci levels identify potential zones of support and resistance and signal price reversal areas, they appear as zones on the chart and do not provide a precise entry point. Moreover, there’s always a chance that price may sweep liquidity behind Fibonacci zones.
By combining fibonacci retracement with Candlestick, the intended entry point is determined, and the appropriate zone for placing stop-loss orders can be identified.
Which Candlestick Patterns Are Suitable for Combination with Fibonacci?
In the combination of Fibonacci and candlestick, reversal candlestick patterns are used. This combination is applicable for both trend-following and counter-trend trades.
Candlestick patterns suitable for combination with Fibonacci:
- Hammer Pattern: This candlestick has a long lower shadow and a short body at the top (preferably one-third of the shadow’s length), indicating the end of a downtrend and the beginning of an uptrend;
- Shooting Star Pattern: The shooting star consists of a long upper shadow and a short body at the bottom (preferably one-third of the shadow’s length), signaling the end of an uptrend and the beginning of a downtrend;
- Hanging Man Pattern: This pattern has a short body at the top and a long lower shadow. Typically, the Hanging Man indicates the end of an uptrend and the beginning of a downtrend;
- Engulfing Pattern: This pattern consists of two candlesticks. The first candle is formed in the current market direction, while the second candle fully engulfs the previous one and is formed in the opposite direction. This pattern helps identify trend reversals in both bullish and bearish markets.
Trading Example of Combining Fibonacci and Candlestick Patterns
To trade using the combination of Fibonacci and candlestick patterns, there are three main steps:
- Drawing the Fibonacci levels
- Price reaching one of the significant Fibonacci levels
- Formation of a candlestick pattern
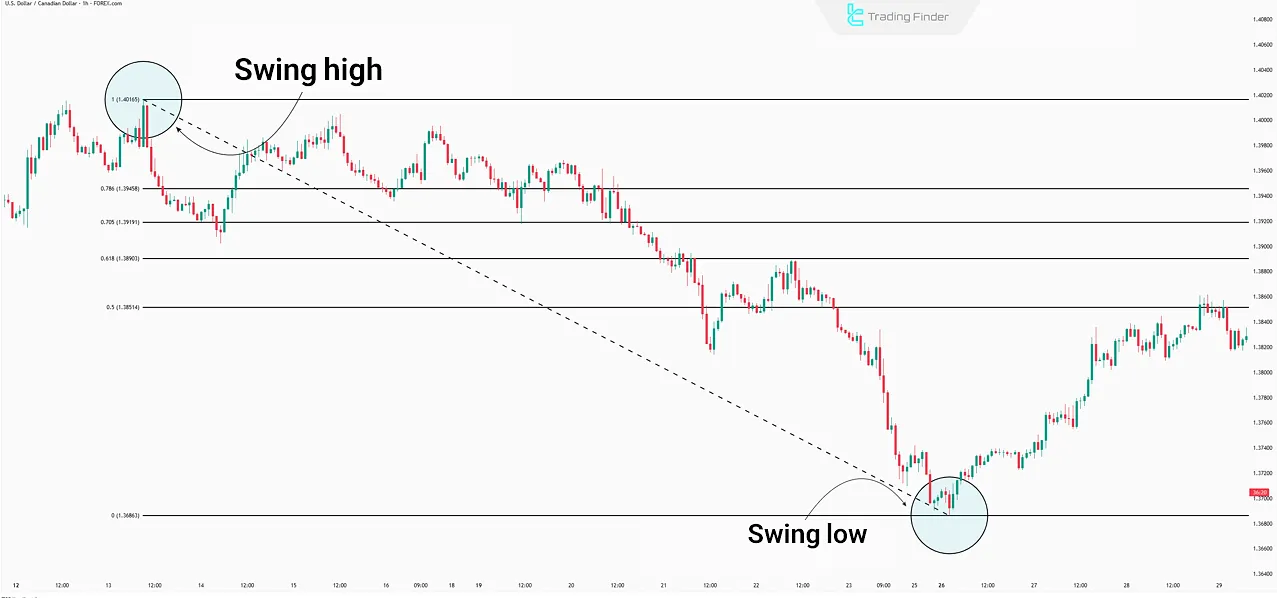
#1 Drawing Fibonacci
To draw Fibonacci retracement, a price trend must first be identified, and the swing high and swing low of that trend should be connected using the Fibonacci tool. By connecting these two points, Fibonacci levels appear on the chart.
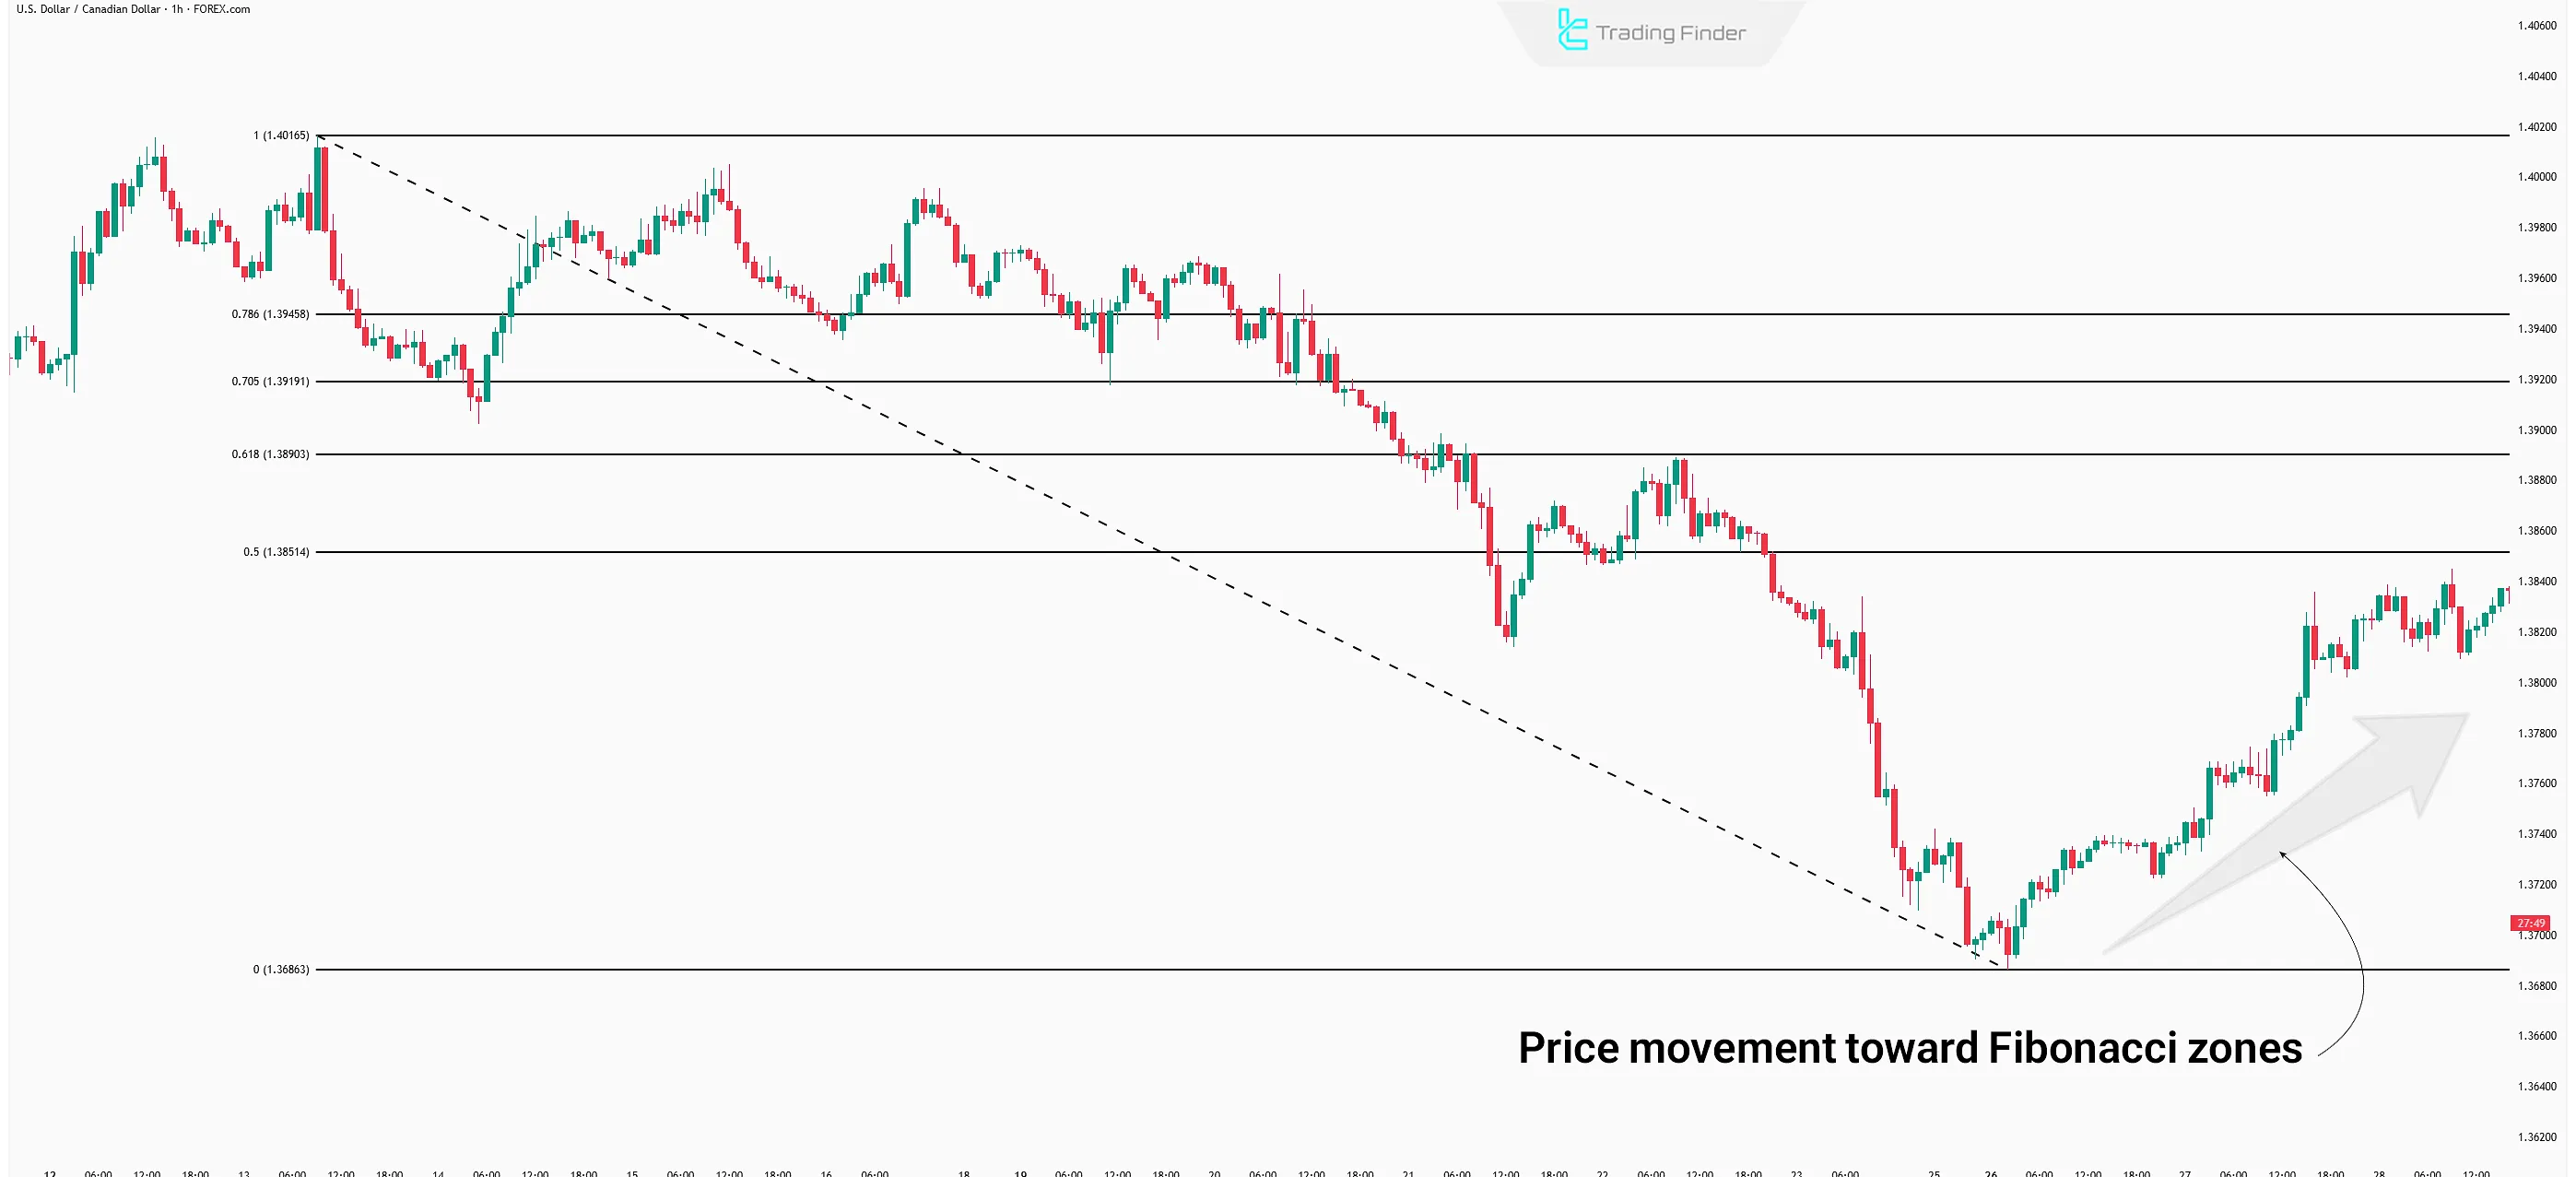
#2 Price Reaching a Significant Fibonacci Level
In the next step, the price must reach one of the Fibonacci levels. Usually, a trend reversal is more likely to occur at the 0.5, 0.618, and 0.786 Fibonacci levels.
In this trading example, the price initiates its reversal after reaching the 0.5 Fibonacci level.
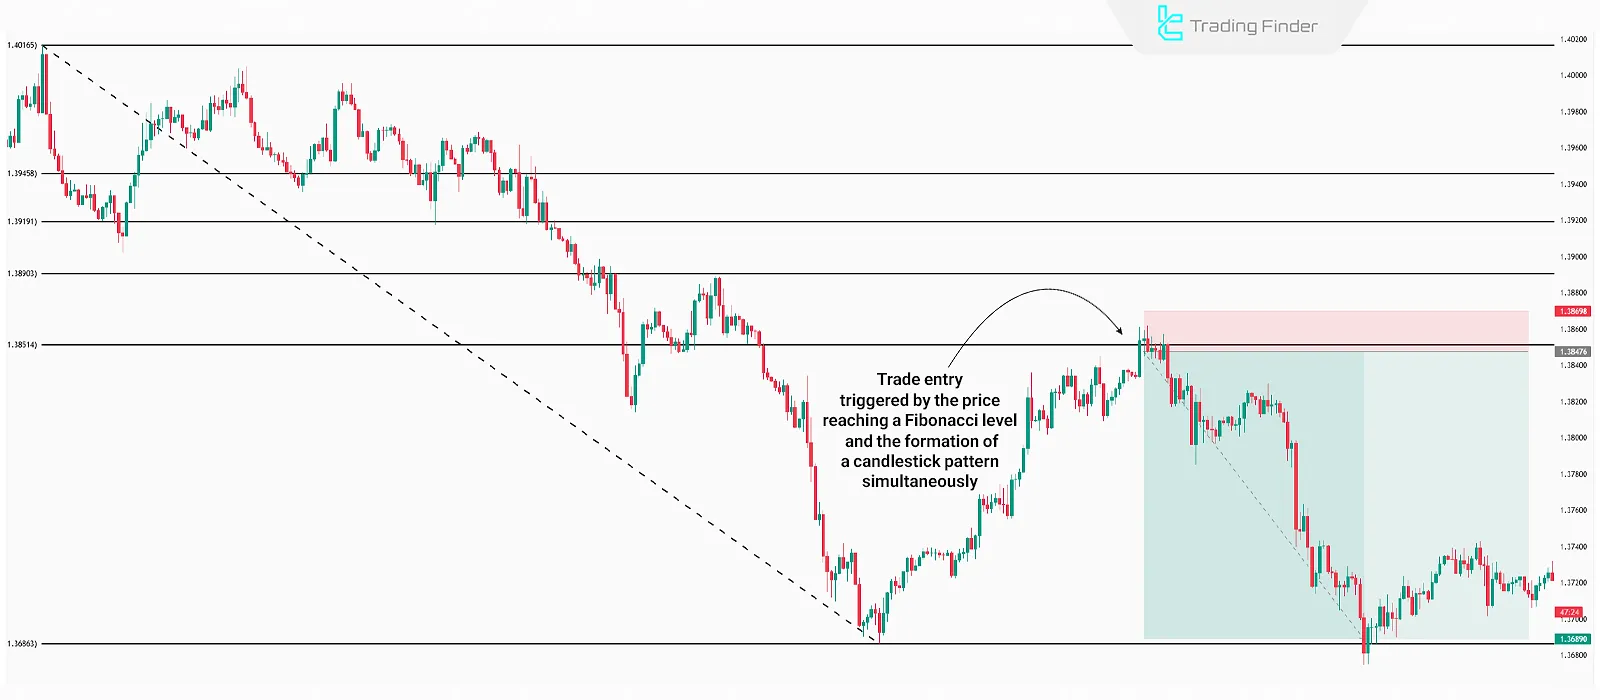
#3 Formation of Candlestick Pattern
In the third step, the Fibonacci and candlestick tools must be combined to identify a suitable entry point. Once the price reaches one of the Fibonacci levels, the trader must wait for the formation of one of the reversal candlestick patterns.
In the following example, after several indecisive candles at the 0.5 Fibonacci level, a Hammer forms, and the downward movement begins.
The Importance of Capital and Risk Management in the Fibonacci and Candlestick Strategy
Due to the presence of multiple Fibonacci levels, there is always the possibility that any of these levels may be broken, and the reversal movement may begin from the next level. Furthermore, the formation of candlestick patterns at Fibonacci levels does not guarantee a 100% price reversal, and the price trend may continue.
Therefore, implementing risk management and capital management is critically important in this strategy.
For example, a candlestick pattern might form within the 0.5 Fibonacci level, but the price may continue moving and only reverse at the 0.618 level with the formation of another candlestick pattern. Thus, if proper capital management has been applied in previous trades, sufficient capital will remain available to enter a new position at the next level.
Conclusion
The Fibonacci tool only identifies probable zones for price trend reversals. Therefore, using it in trading requires combining it with tools that allow for analyzing price behavior upon reaching a Fibonacci zone.
Candlestick patterns are one of the simplest ways to analyze price action at key levels, including Fibonacci retracements. In this combination, reversal candlestick patterns are used, and their formation at Fibonacci levels generates trade entry signals.


