


The head and shoulders pattern is among the classic reversal patterns that reflects shifts in supply and demand sentiment. This pattern consists of three consecutive peaks. As these peaks form, changes in volume and price momentum start to appear.
Combining the head and shoulders pattern with other technical analysis tools such as the RSI indicator leads to an improved trade success rate (Win Rate).
What Is the Head and Shoulders Pattern?
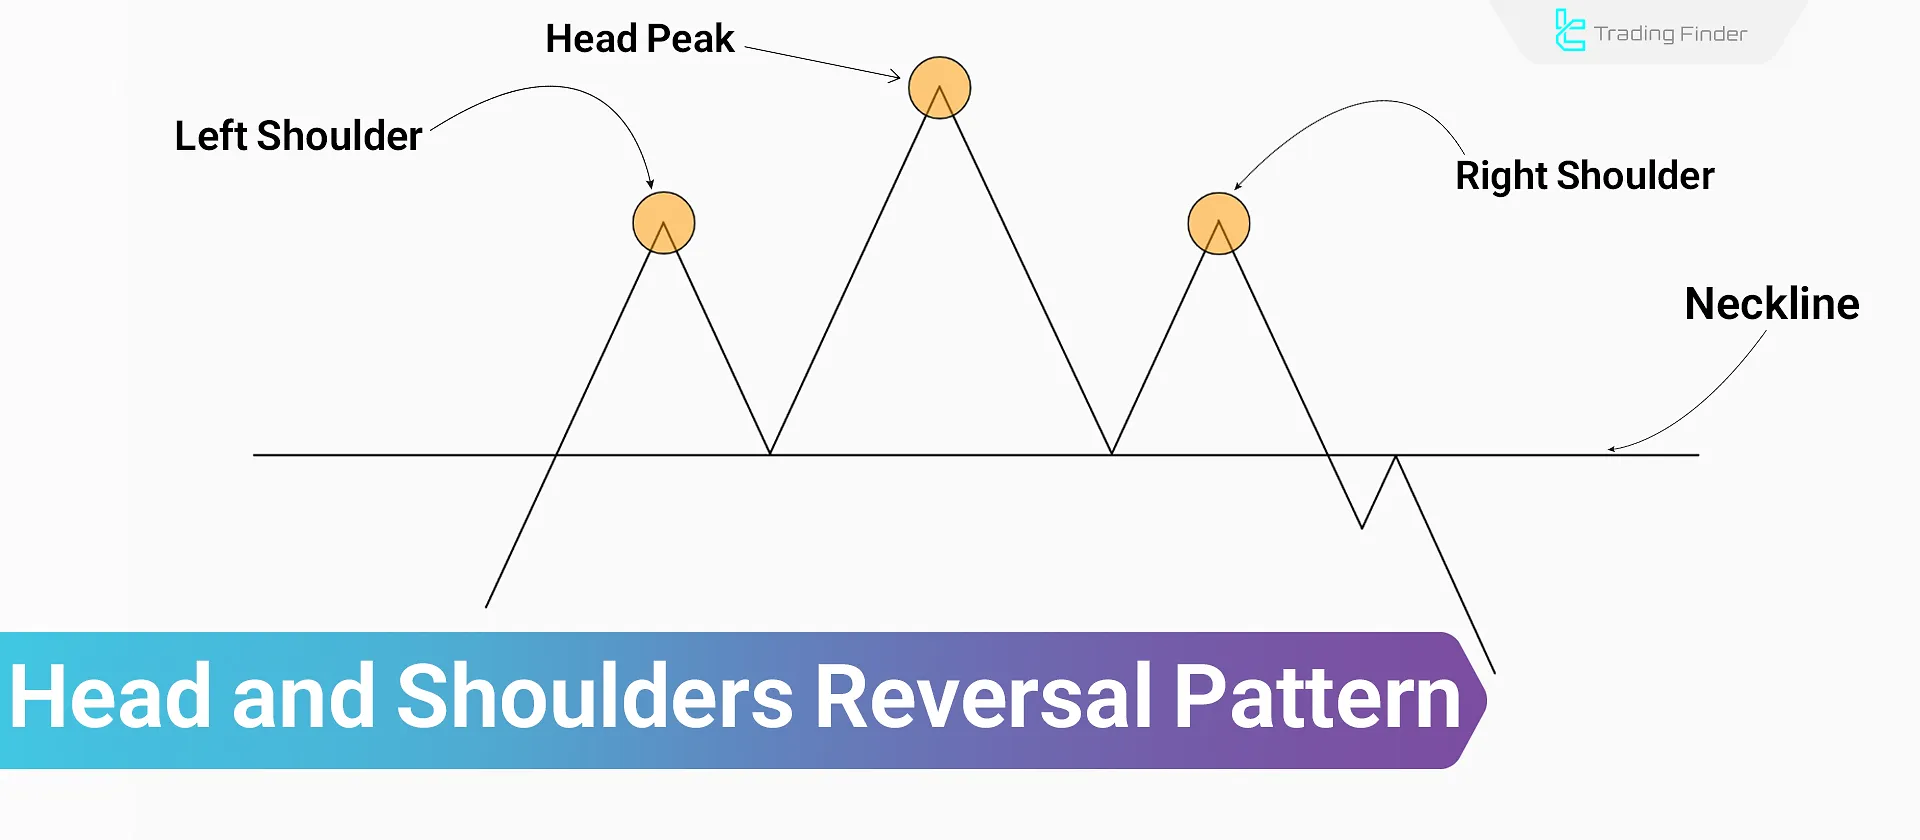
The head and shoulders pattern usually forms at the end of a trend. Price creates one peak (left shoulder), a higher peak (head), and a lower peak (right shoulder), which signals trend weakness.
This pattern at the end of a trend shows the price's inability to form higher highs or break resistance zones. In this case, a possible trend reversal is expected.
The head and shoulders pattern is valid across all financial markets, including Forex, cryptocurrencies, and stocks, and it can form on different timeframes.
Investopedia’s tutorial article on the head and shoulders pattern, this classic pattern is fully explained.
Advantages and Disadvantages of the Head and Shoulders Pattern
Thehead and shoulders pattern is highly useful in identifying trend reversals due to its clearly defined breakout level.
However, the pattern’s reliability depends on several factors such as the precise shape of the components, market conditions, and more.
Disadvantages | Advantages |
Possibility of false signals in volatile markets | Ability to detect structural weakness in trend continuation |
High dependency on valid neckline breakout | Applicable in all timeframes |
Requires confirmation from volume or indicators | Clear invalidation level |
Sensitive to how the neckline is drawn | Enables accurate stop loss and take profit levels |
Components of the Head and Shoulders Pattern
The head and shoulders pattern consists of four main parts, each with a specific role in shaping the reversal structure.
The sequence and behavioral characteristics of these components are the foundation of analyzing this pattern:
- Left Shoulder: The first peak formed after a strong bullish move, usually accompanied by high liquidity;
- Head: The second peak, which is higher than the first, representing the last effort of buyers to break resistance level;
- Right Shoulder: The third and final peak of the pattern, which is lower than the head and usually has lower liquidity than the other peaks;
- Neckline: The support line of the pattern that connects the end of the corrective moves within the structure; This line can form diagonally or horizontally depending on market conditions.
How to Trade the Head and Shoulders Pattern?
Trading based on this pattern requires accurate detection of the neckline breakout and monitoring liquidity behavior during its formation.
Entering a trade is only logical when the neckline breakout is validly confirmed and price holds below this line.
Trade Entry
There are two methods for entering trades using the head and shoulders pattern, each with different risk levels:
- Aggressive Entry: Entering the trade immediately after the neckline is broken, placing the stop loss slightly above the right shoulder, without additional confirmation;
- Conservative Entry: Entering the trade after a pullback to the neckline and receiving complementary confirmation such as candlestick patterns.
Determining Take Profit and Stop Loss
To determine the take profit (TP), the distance between the head and the neckline must be measured. Then, the TP order is placed at an equivalent distance below the neckline.
Additionally, there are two stop loss zones with different levels of risk:
- Above the Right Shoulder: This area lowers the chance of stop-hunting, but offers a lower risk-reward ratio;
- Above the Neckline Breakout Candle: This level provides a better risk-reward ratio but increases the probability of stop-hunting.
On the Wysetrade YouTube channel, various types of head and shoulders patterns are taught through video lessons:
Inverse Head and Shoulders Pattern
The inverse head and shoulders pattern is structurally similar to the classic one, except that the trend direction and neckline breakout are reversed.
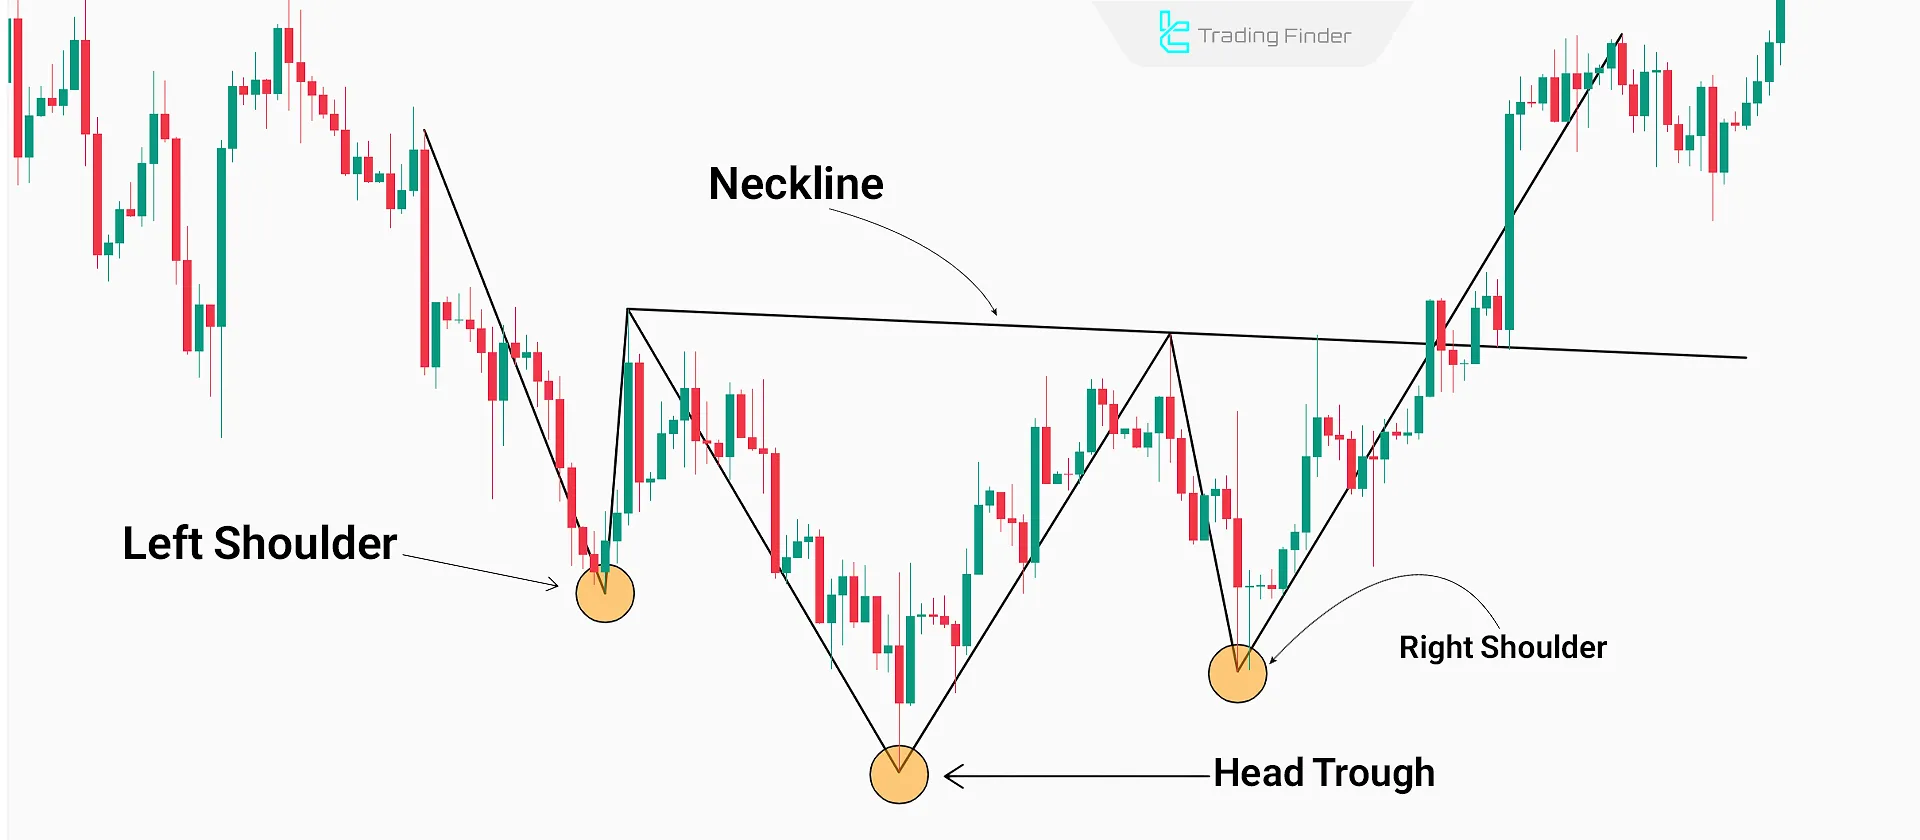
This pattern forms at the end of a downtrend. After a strong bearish move, three consecutive troughs form at different levels: the first trough is the left shoulder, the second is the head, and the third is the right shoulder.
In this pattern, the neckline breakout occurs to the upside. A sudden increase in volume during the neckline break increases the credibility of the pattern.
Double Head and Shoulders Pattern
In certain specific market conditions, a structure with two central peaks instead of a single main peak forms, known as the double head and shoulders pattern.
In this structure, the neckline serves as a key reference for the neckline in trading, as it determines the validity of the breakout. This pattern typically appears in markets with high liquidity and broad volatility, indicating the market’s second unsuccessful attempt to continue the previous trend.
Functionally, the price behavior in this pattern is similar to the regular head and shoulders formation, except that the emergence of two consecutive heads increases the likelihood of a trend reversal. During a neckline breakout, professional traders wait for structure confirmation to reduce the risk of a false breakout.
Furthermore, in detailed analysis, attention to the head and shoulders pattern neckline and its angle plays an important role in assessing the signal’s quality.
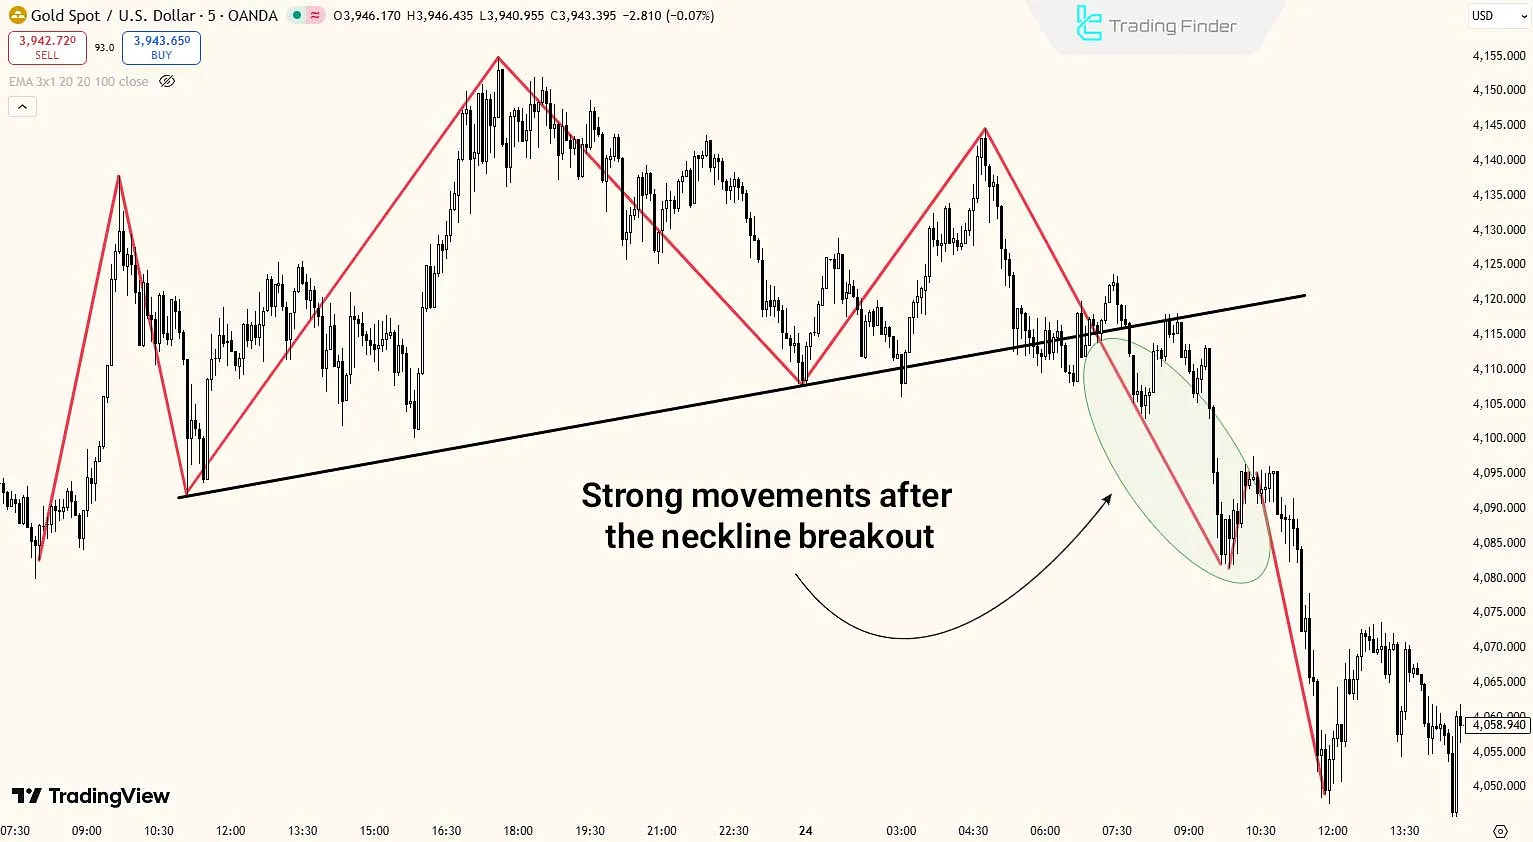
When the neckline breaks, trading volume usually rises significantly, and price movements occur faster than in the standard case.
Key Points About the Head and Shoulders Pattern
To evaluate the validity of the head and shoulders pattern, aspects such as volume, neckline slope, and shoulder symmetry should be considered.
Analyzing these factors helps identify changes in supply and demand, improving the trade successrate.
Neckline Slope
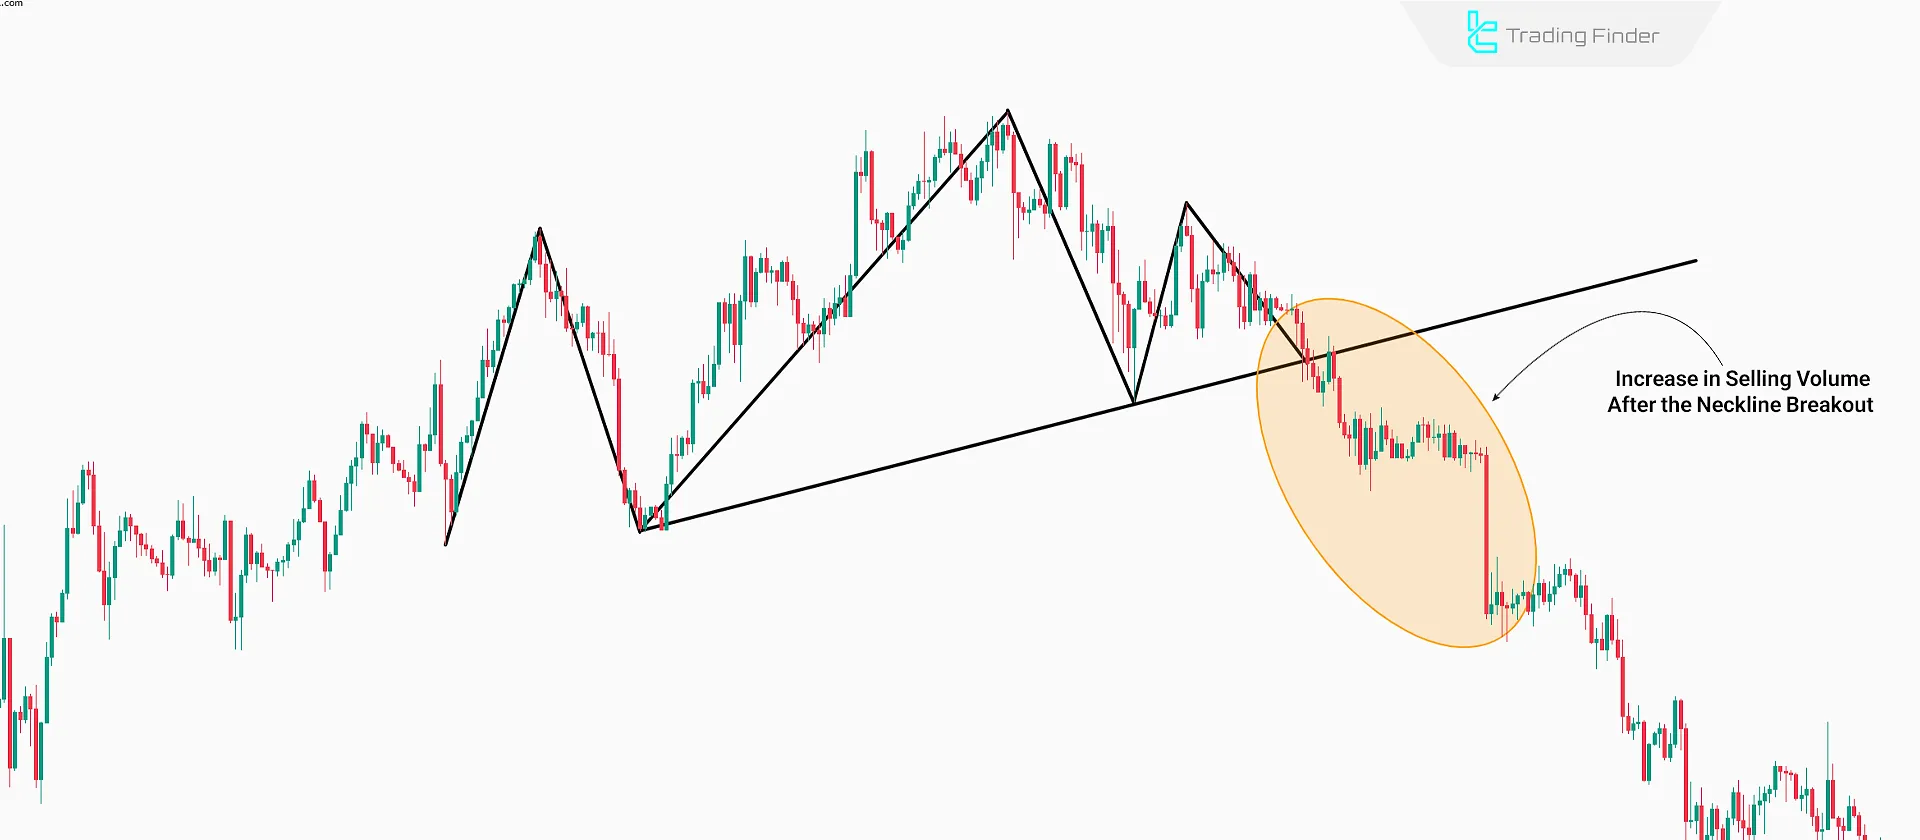
The neckline can form as horizontal, downward, or upward. In the head and shoulders pattern, a downward-sloping neckline indicates stronger bearish pressure. An upward slope generally reduces the pattern's reliability.
Trading Volume
At the beginning of the pattern formation, volume is at its highest. As the pattern develops, volume gradually decreases.
During the formation of the right shoulder, trading volume typically drops to its lowest level. However, once the neckline breaks, a sudden spike in volume confirms the pattern’s strength.
Shoulder Symmetry
Minor deviations in the height of the shoulders are natural, but the less deviation there is, the more valid the pattern becomes.
Also, the time duration between the formation of the two shoulders is important. The shorter the time gap, the higher the reliability of the pattern.
Price Behavior Before the Breakout
The weaker the upward moves before the neckline breakout, the more valid the breakout becomes.
Additionally, compressed price ranges and short-term consolidations are signs of buyer weakness and increasing seller dominance.
Breakout Confirmation
By analyzing price action after the neckline breakout, one can assess the validity of the breakout based on how price stabilizes below the neckline. The use of the RSI indicator is also helpful in verifying the breakout’s strength.
The appearance of long wicks without price stabilizing below the neckline, often signals a weak breakout and the possibility of a return to the previous trend.
Comparison of Aggressive and Conservative Entries in the Head and Shoulders Pattern
To better understand the difference between these two approaches, the table below shows the trading structure, risk level, and suitable conditions for each type of entry.
Within the framework of the head and shoulders trade pattern, an aggressive entry is made immediately after the neckline breakout, while a conservative entry occurs after the price returns to the neckline and receives candle confirmation.
These decisions in the context of head and shoulders trading become more effective when risk management and the risk-to-reward ratio are clearly defined. Although a head and shoulders pattern breakout may appear attractive, it can be misleading without volume confirmation.
Entry Type | Entry Timing | Risk Level | Advantages | Disadvantages |
Aggressive Entry | Immediately after the neckline breakout | High | Better price entry and shorter stop loss | High chance of stop-hunt and false breakout |
Conservative Entry | After pullback to the neckline and candle confirmation | Lower | Breakout confirmation and reduced error risk | Missing part of the initial price movement |
Liquidity Behavior in the Head and Shoulders Pattern
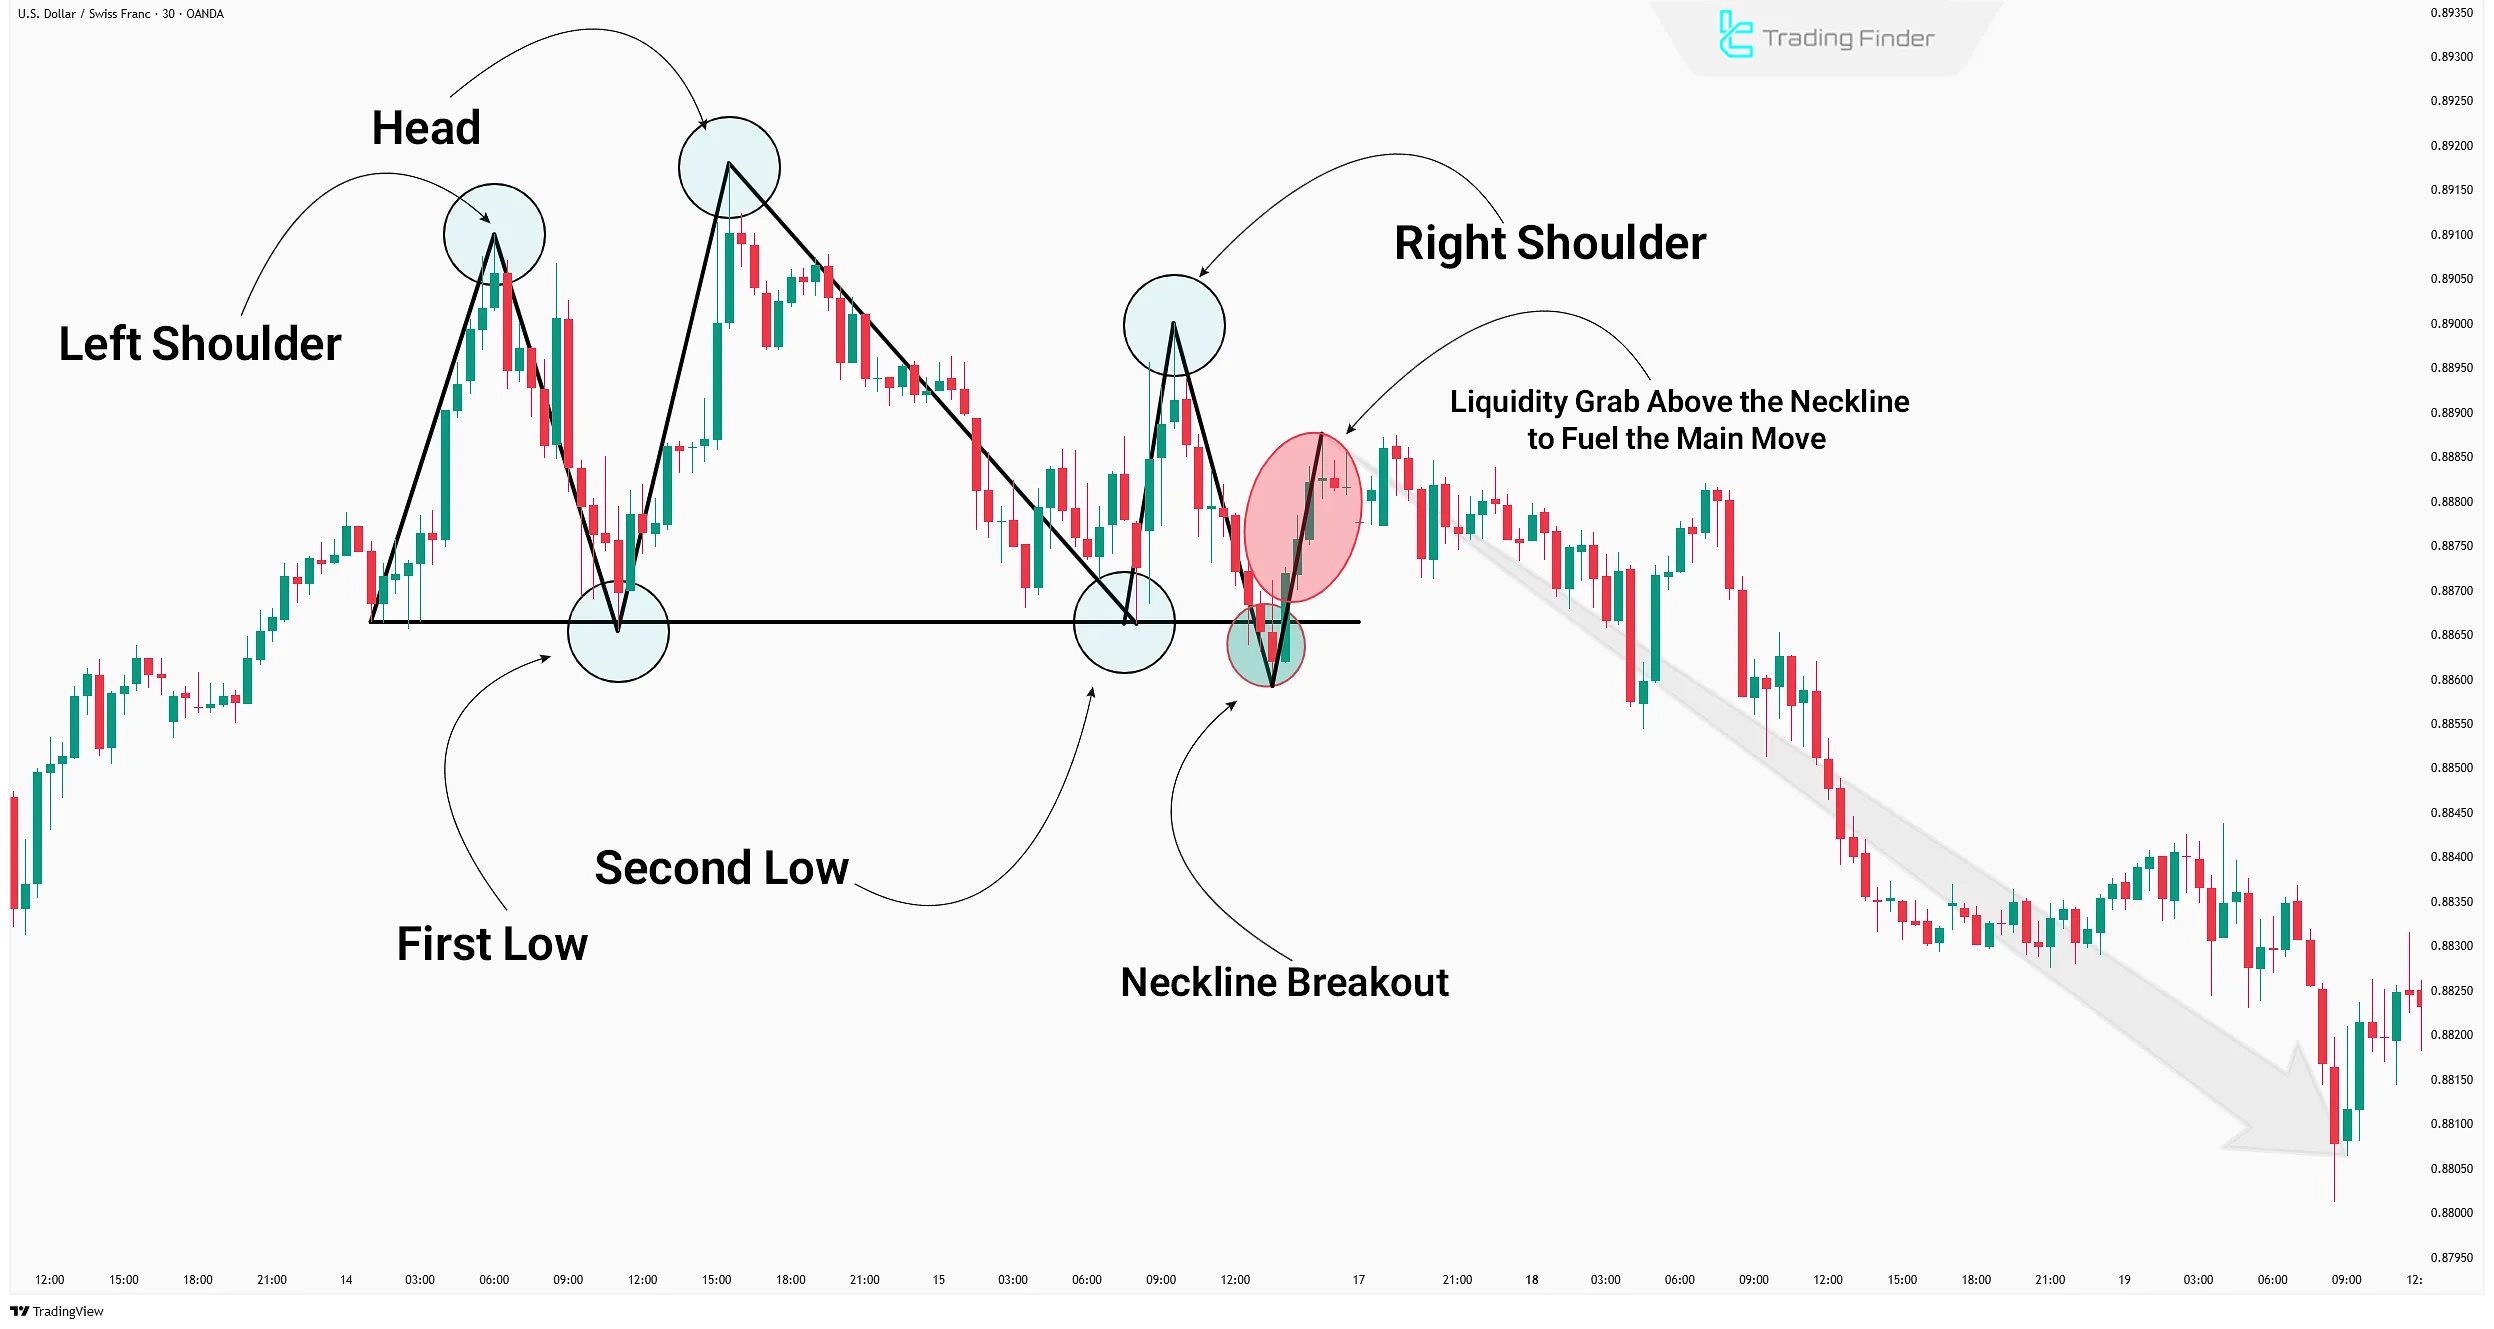
Before a confirmed breakout in the head and shoulders pattern, intentional liquidity movements occur in the market order flow.
In many cases, significant liquidity accumulates above the right shoulder or near the neckline, where market makers (the dominant players) attempt to absorb liquidity through fake moves or stop-hunting before the actual price reversal.
This behavior is often seen as false breakouts or temporary penetrations of the neckline area, prior to the main move.
Additionally, the formation of tight liquidity zones near the pattern's key points reflects imbalance in supply and demand and shows the market is ready for a directional move.
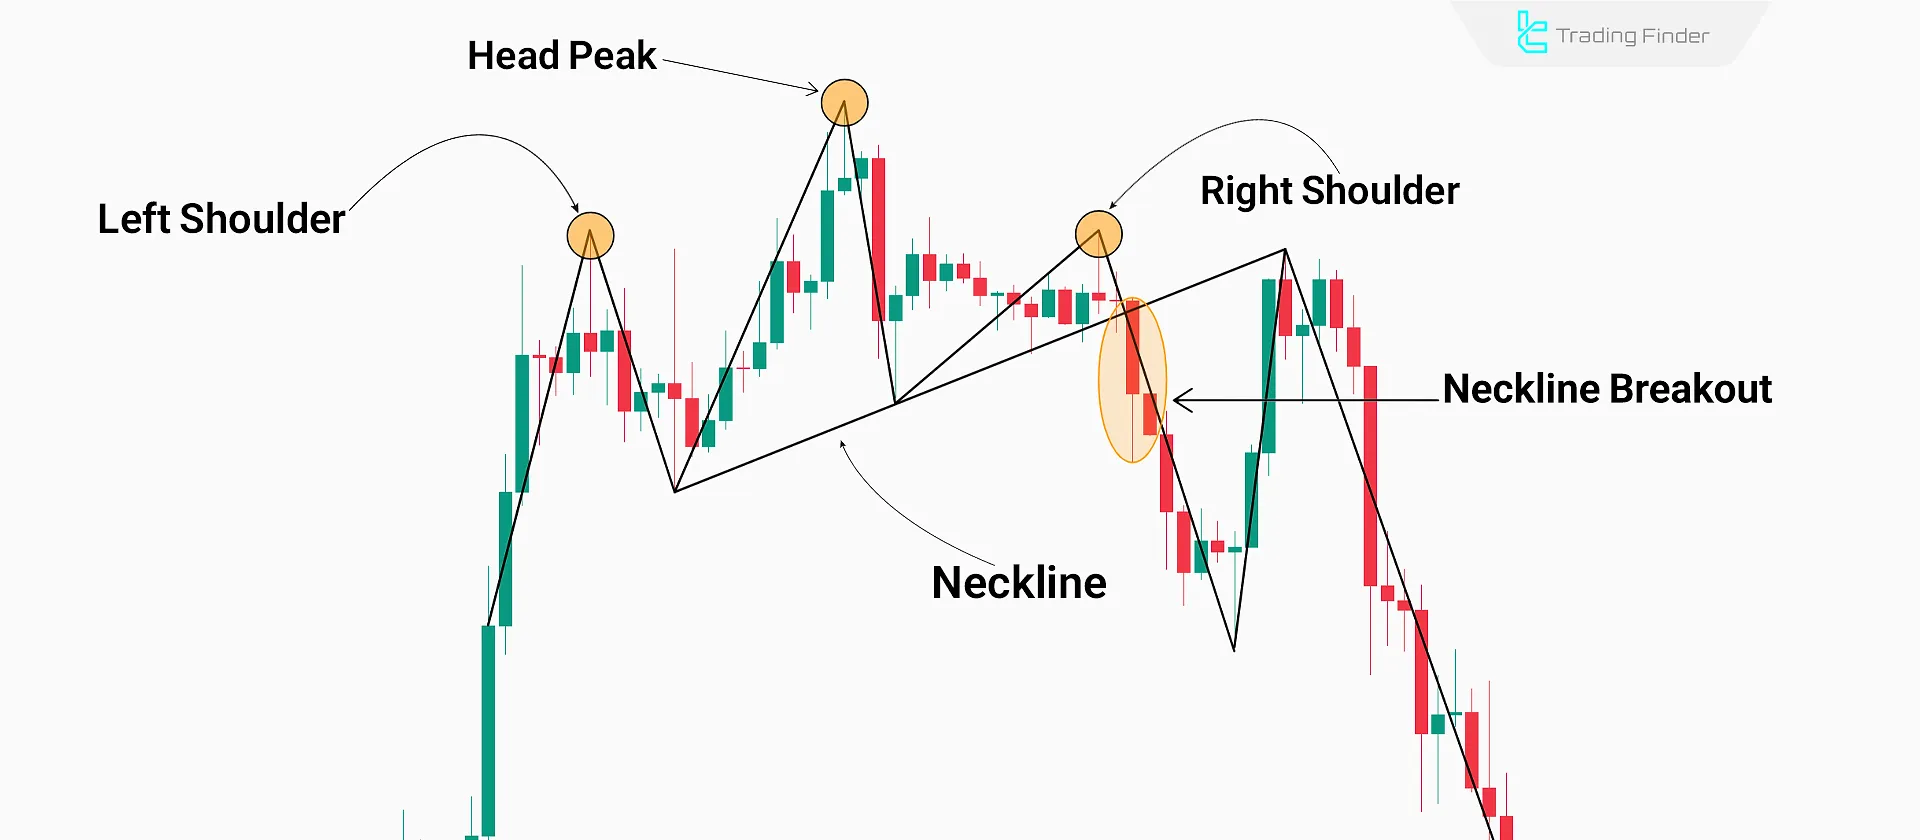
Example of Liquidity Behavior in the Head and Shoulders Pattern
In this example, after the formation of the head and shoulders pattern on the chart, the price makes a strong move toward the neckline and breaks through it, but immediately after crossing this level, it returns to the previous area.
At this stage, beginner traders interpret this move as a false breakout and enter buy positions, while the price at this point is actually seeking to absorb enough liquidity to start a downward move.
As shown in the example image, after absorbing liquidity above the neckline, the price begins its bearish movement. In such contexts, applying head and shoulders technical analysis along with simultaneous examination of higher timeframes can help prevent premature entries.
If the structure forms in reverse, analysts identify an inverse head and shoulder pattern near the bottom area, which is accompanied by an upward breakout.
For staged entry management, some traders use the head and shoulder trade pattern framework alongside volume-based criteria to control short-term volatility.
Validity Assessment of the Head and Shoulders Pattern
To determine the validity of the head and shoulders pattern, in addition to its visual characteristics, one must also examine its structural position and the logic of its formation.
In many cases, patterns that visually resemble the head and shoulders pattern are observed, but they do not form in the right context or ideal locations for a trend reversal.
For example, a rapidly formed and unbalanced right shoulder, or a pattern that forms mid-range in a sideways trend, are signs of low pattern credibility.
Sometimes, partial head and shoulders patterns with misleading price combinations may lead to misinterpretation and losses.
Identifying the Head and Shoulders Pattern on the TradingView Platform
The TradingView platform is one of the most powerful tools for analyzing price structures and automatically detecting classic patterns such as the head and shoulders.
On this platform, traders can use built-in filters or custom indicators to automatically identify the points where shoulders form and where the neckline breaks.
In the Indicators section, tools such as Auto Chart Pattern or Head and Shoulders Detector provide the ability to detect the pattern and alert traders when a neckline breakout occurs.
Professional users can also write custom scripts and algorithms to detect the pattern more accurately based on volume, neckline angle, and volatility compression.
This process gives traders of currency pairs engaged in trading head and shoulders better insight into the breakout and pullback cycle.
In the forex market, the use of head and shoulders in forex becomes prominent when liquidity behavior around the neckline aligns with volume data.
From a risk management perspective, evaluating the approximate head and shoulders pattern win rate only makes sense when the trend bias on a higher timeframe is confirmed.
In stock and commodity markets, analysts also use the head and shoulders finance framework to interpret structural trend changes. Ultimately, focusing on identifying a valid head and shoulders pattern can reduce the number of false signals.
Trading Strategy: Combining the Head and Shoulders Pattern with the RSI Indicator
In this trading strategy, in addition to analyzing market structure, elements such as momentum changes using the RSI indicator are considered, which increase the trade success rate.
#1 Identifying the Complete Structure
In the first step, the full formation of the head and shoulders pattern must be confirmed. The shoulders should be relatively symmetrical in height.
The formation of a downward-sloping neckline increases the credibility of this trading strategy.
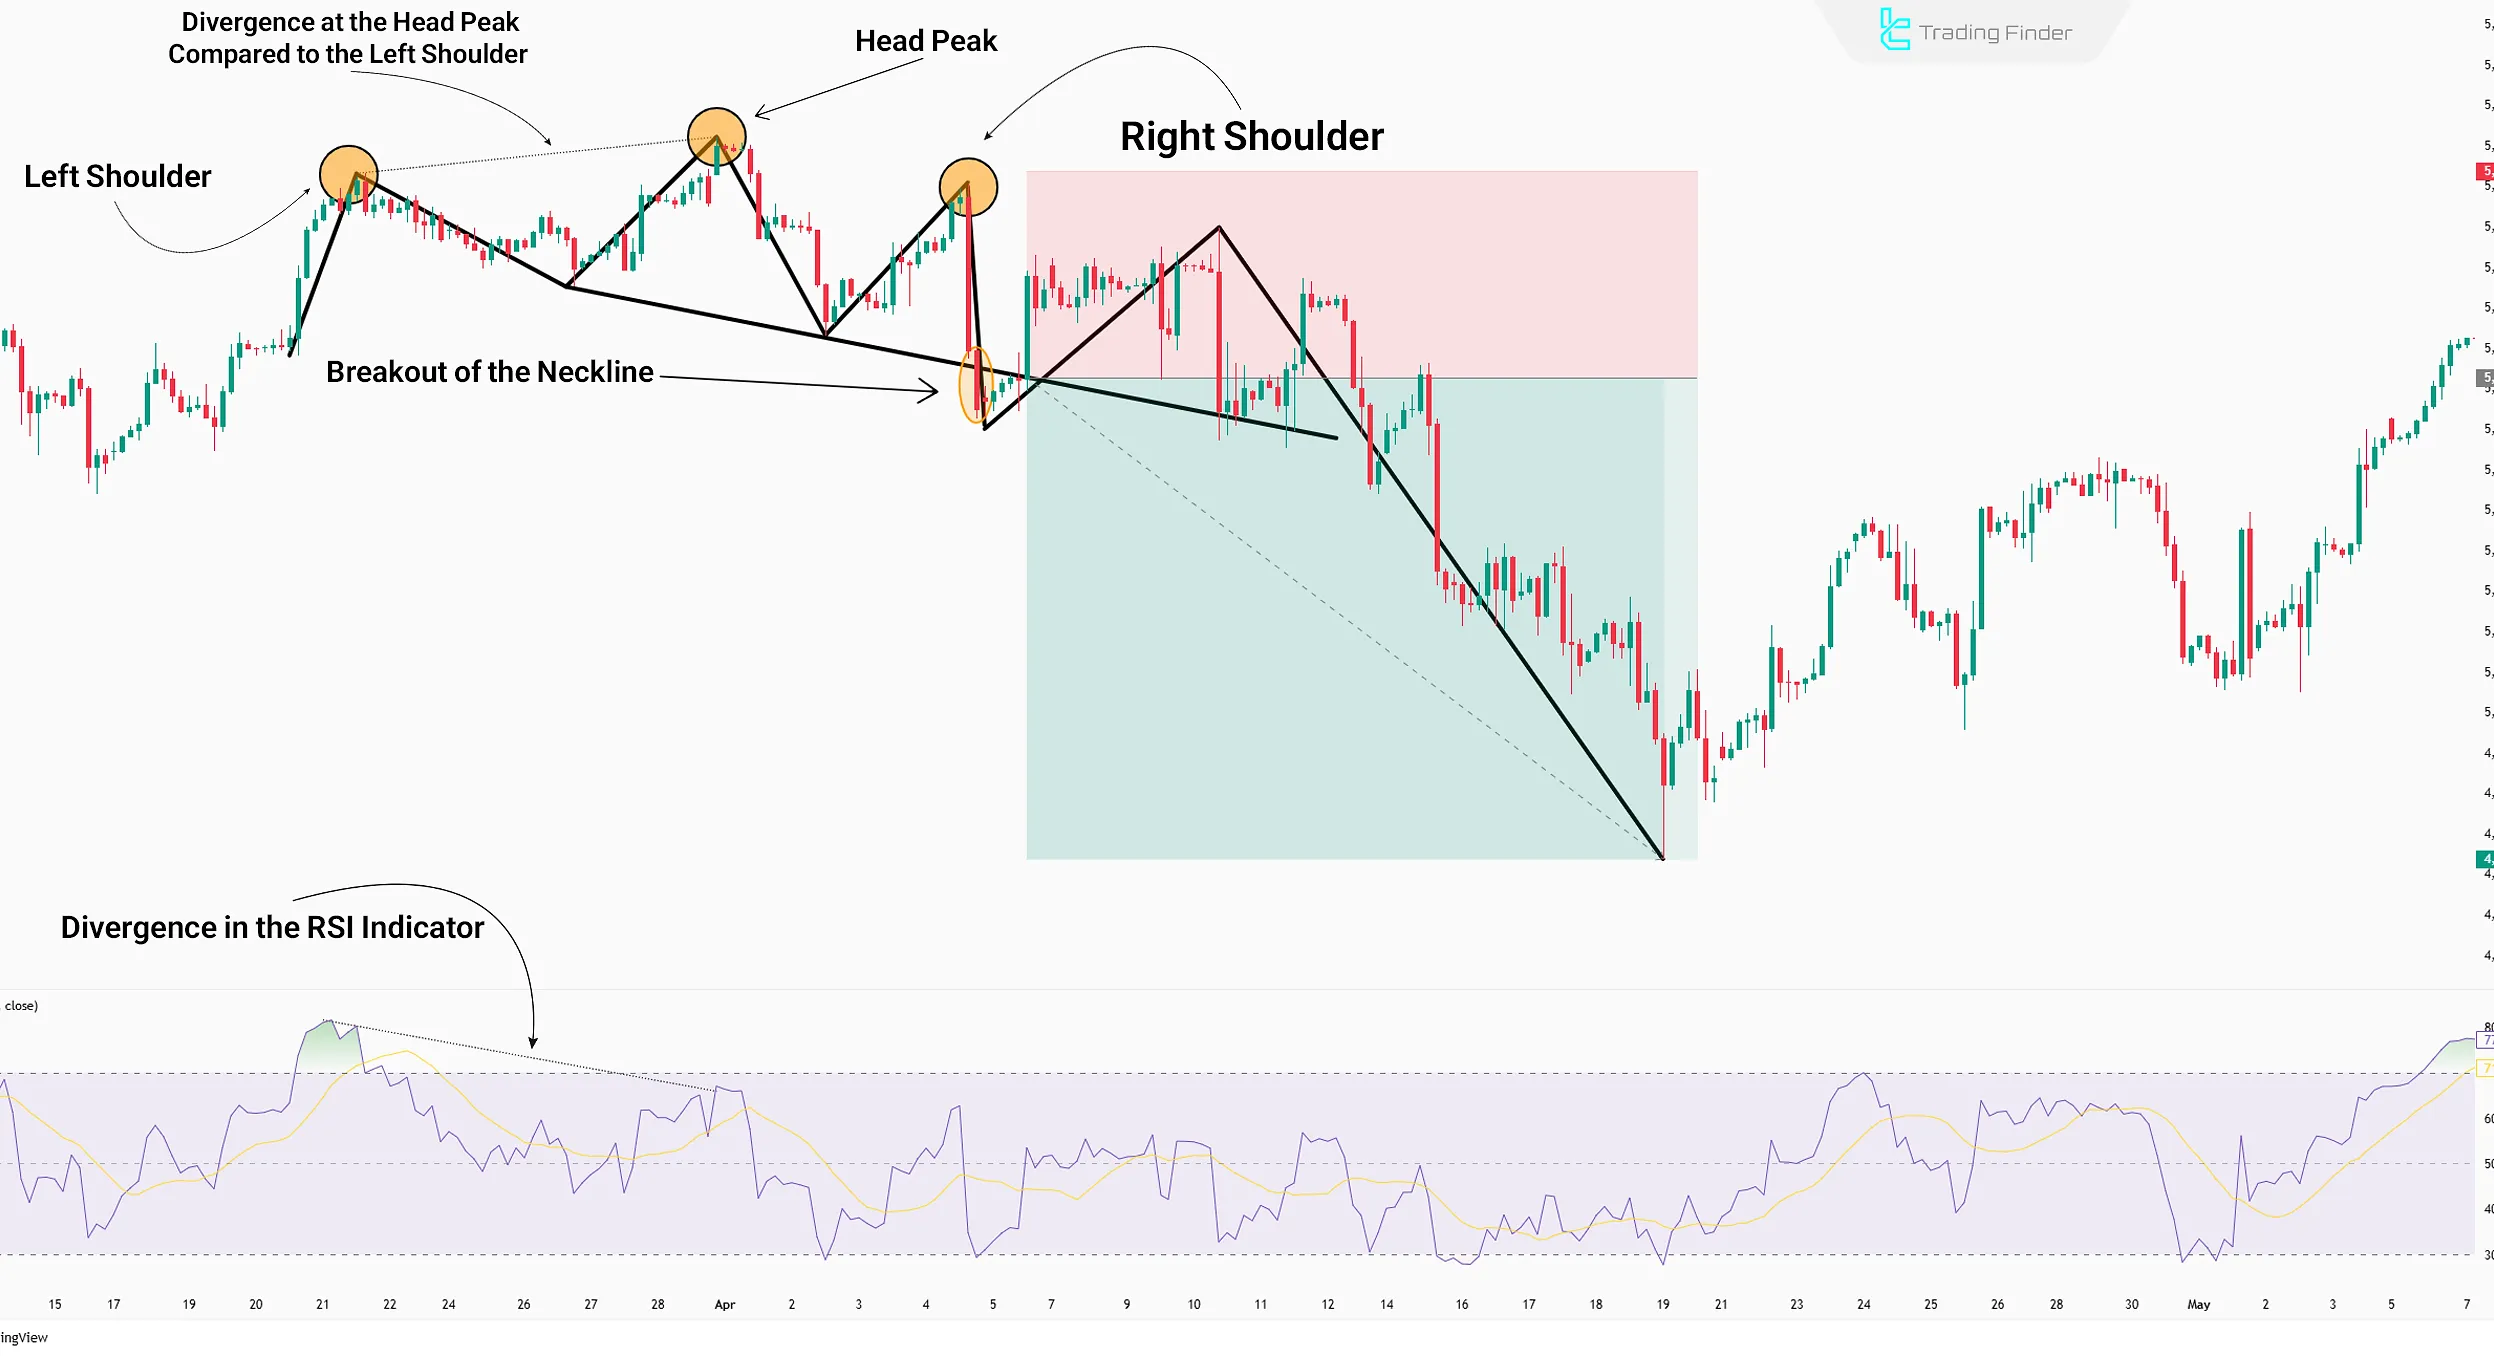
#2 RSI Divergence on the Right Shoulder
After confirming the pattern structure, a bearish divergence must be checked on the RSI indicator between the right shoulder and the head.
The formation of a lower peak on RSI compared to the head, indicates the development of a price bubble, which increases the probability of a price drop.
#3 Overlap of Neckline Breakout and RSI Crossing Below 50
The next step in this trading strategy is the RSI dropping below the 50 levelsimultaneously with the neckline breakout. This overlap signals the beginning of divergence release and price bubble burst.
#4 Final Confirmation of Entry Signal
After a valid breakout and momentum confirmation via RSI, entry occurs once price stabilizes below the neckline.
If any part of the strategy does not confirm buyer weakness, the entry signal is considered invalid.
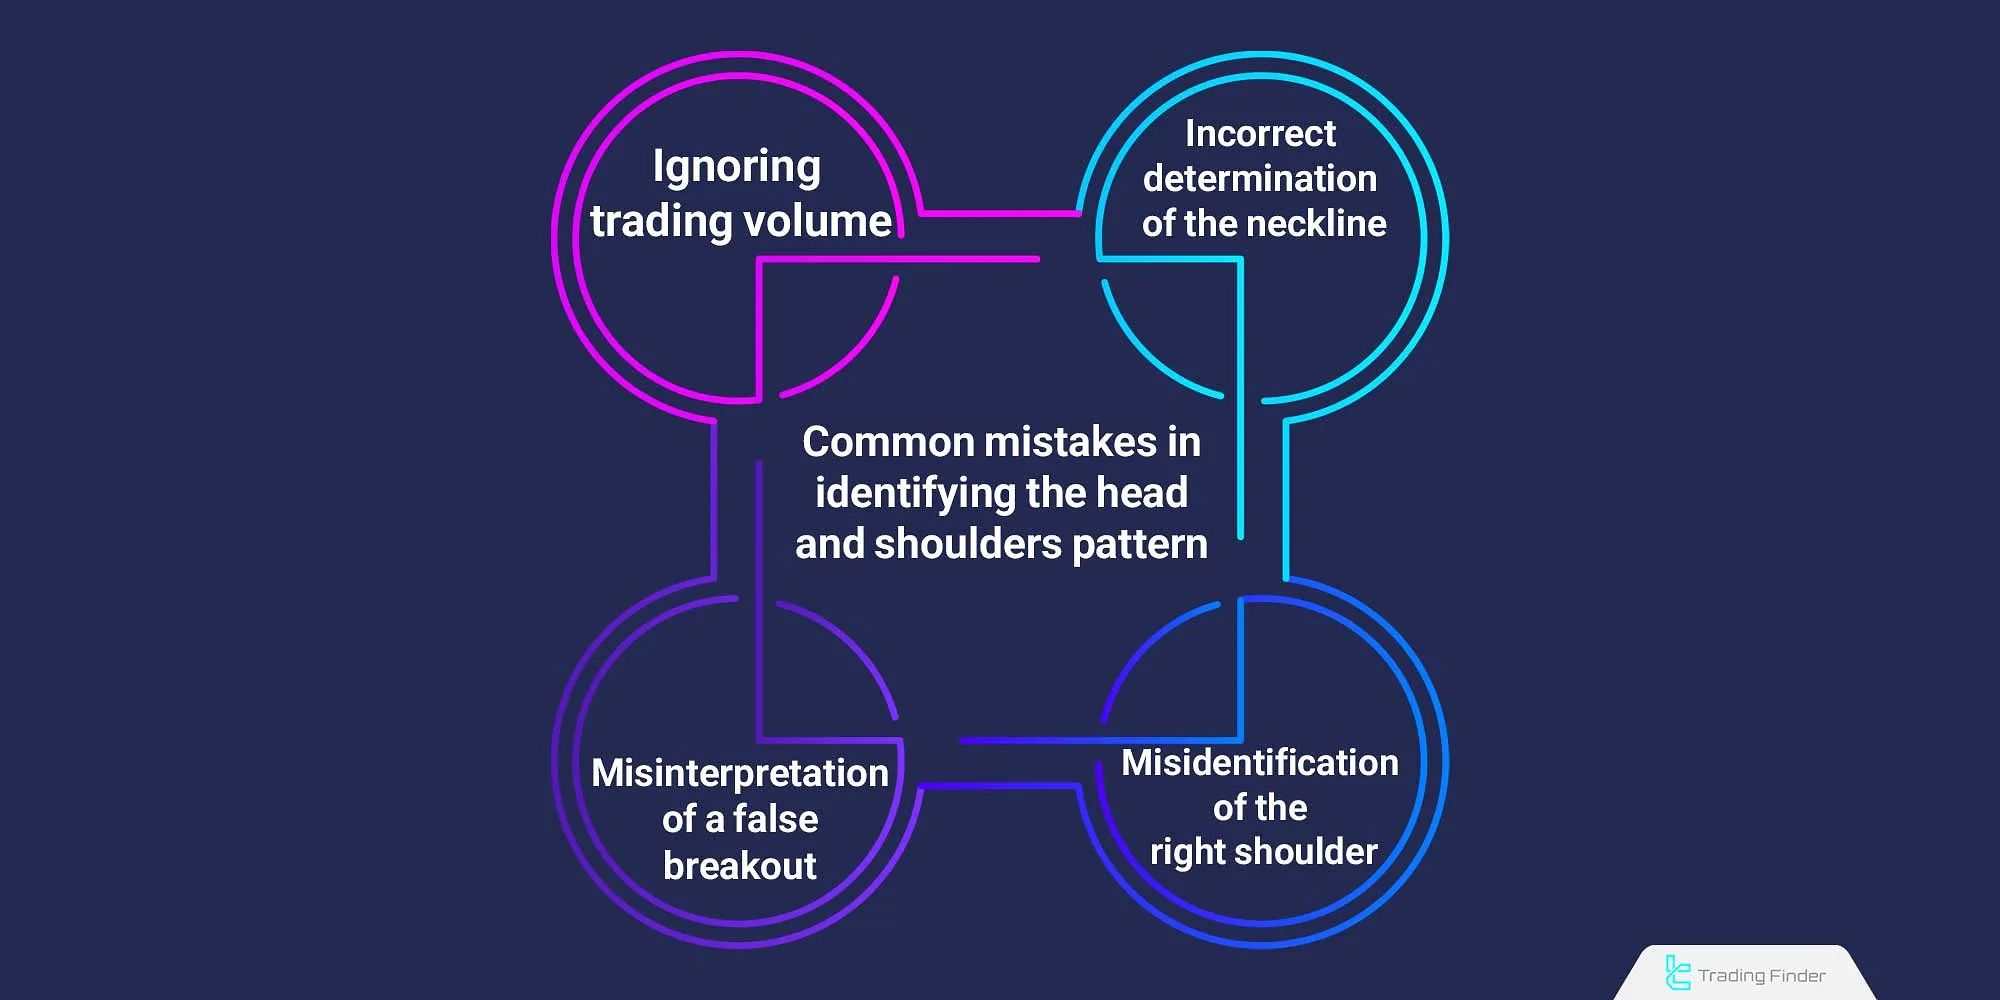
Common Mistakes in Identifying the Head and Shoulders Pattern
Many traders make common mistakes when drawing or interpreting this pattern, which can lead to incorrect decisions. The most important ones include:
- Incorrect determination of the neckline: drawing the neckline without considering the actual peaks or troughs causes false signals;
- Ignoring trading volume: the gradual decrease in volume during pattern formation and the sudden increase during breakout is one of the main signs of validity;
- Misidentifying the right shoulder: in many cases, the right shoulder is not fully formed, and traders enter positions prematurely;
- Misinterpreting a false breakout: short-term penetration of price below the neckline does not necessarily confirm a breakout and requires price stabilization.
To reduce these errors, using a head and shoulders analysis framework along with precise entry and exit rules is essential.
In top patterns, the head and shoulders top formation stage has greater validity when the breakout is accompanied by candle confirmation and simultaneous volume increase.
Also, when creating a trading plan, attention to the head and shoulder strategy and defining the invalidation zone improves execution quality.
Head and Shoulders Visual Indicator
With the advancement of artificial intelligence in chart analysis, automatic recognition of price patterns such as the Head and Shoulders has now become algorithmically possible.
Platforms like ChartAI, Pattern Smart, and Trend Spider use machine learning models to simultaneously scan thousands of charts and identify patterns with valid structures in the shortest possible time.
These technologies, in addition to automatic detection, evaluate parameters such as neckline slope, trading volume, and symmetry ratio to increase the accuracy of trading signals.
Combining these tools with manual technical analysis can create an advanced and multidimensional trading system for professional analysts.
Download Head and Shoulders Indicator (Head and Shoulders Visual)
The Head and Shoulders Visual indicator is one of the most accurate technical analysis tools for identifying reversal patterns.
This indicator automatically detects both types of Head and Shoulders patterns: the bearish (top) and the bullish (bottom) formations, and displays them on the price chart.
It is designed to help traders identify trend reversals and find optimal entry and exit points based on price structure.
The functionality of this indicator is based on the classical Head and Shoulders pattern, which includes the left shoulder , head, right shoulder, and neckline .
For example, on a one-hour gold chart (XAU/USD) , when an inverted Head and Shoulders pattern forms at the end of a downtrend and the neckline is broken upward, a Buy signal is generated, indicating the beginning of a new bullish trend.
Conversely, in charts such as GBP/AUD, at the end of an uptrend, a standard Head and Shoulders pattern may form, and if the neckline breaks downward, a Sell signal appears, indicating the start of a bearish phase.
From a technical perspective, the Head and Shoulders Visual indicator belongs to the Price Action and Classical Patterns category and is suitable for Forex , stock, and cryptocurrency markets.
It is designed for traders with an intermediate skill level and supports multi-timeframe (MTF) analysis.
In the settings section, users can customize features such as pattern color , zigzag line style and thickness, neckline slope percentage, and the display mode of regular and inverted patterns.
Combining this tool with complementary indicators such as RSI or MACD can further increase the reliability of its signals.
In conclusion, the Head and Shoulders indicator is a powerful tool for trend analysis and identifying market reversal points. With a simple user interface and customizable settings, it serves as an ideal choice for both professional and semi-professional traders.
- Download Head and Shoulders Visual Indicator for MetaTrader 5
- Download Head and Shoulders Visual Indicator for MetaTrader 4
Conclusion
The head and shoulders pattern is one of the classic reversal patterns. It forms at the end of a trend and reflects weakness in the current trend’s strength.
This pattern is most effective when combined with a detailed analysis of price behavior and liquidity conditions.
Accurate identification of the pattern’s components, proper structure evaluation, and confirmation of the neckline breakout are the key factors that determine the success rate of trades using the head and shoulders pattern.
Combining this pattern with the RSI indicator helps filter false signals and enhance entry points.


