


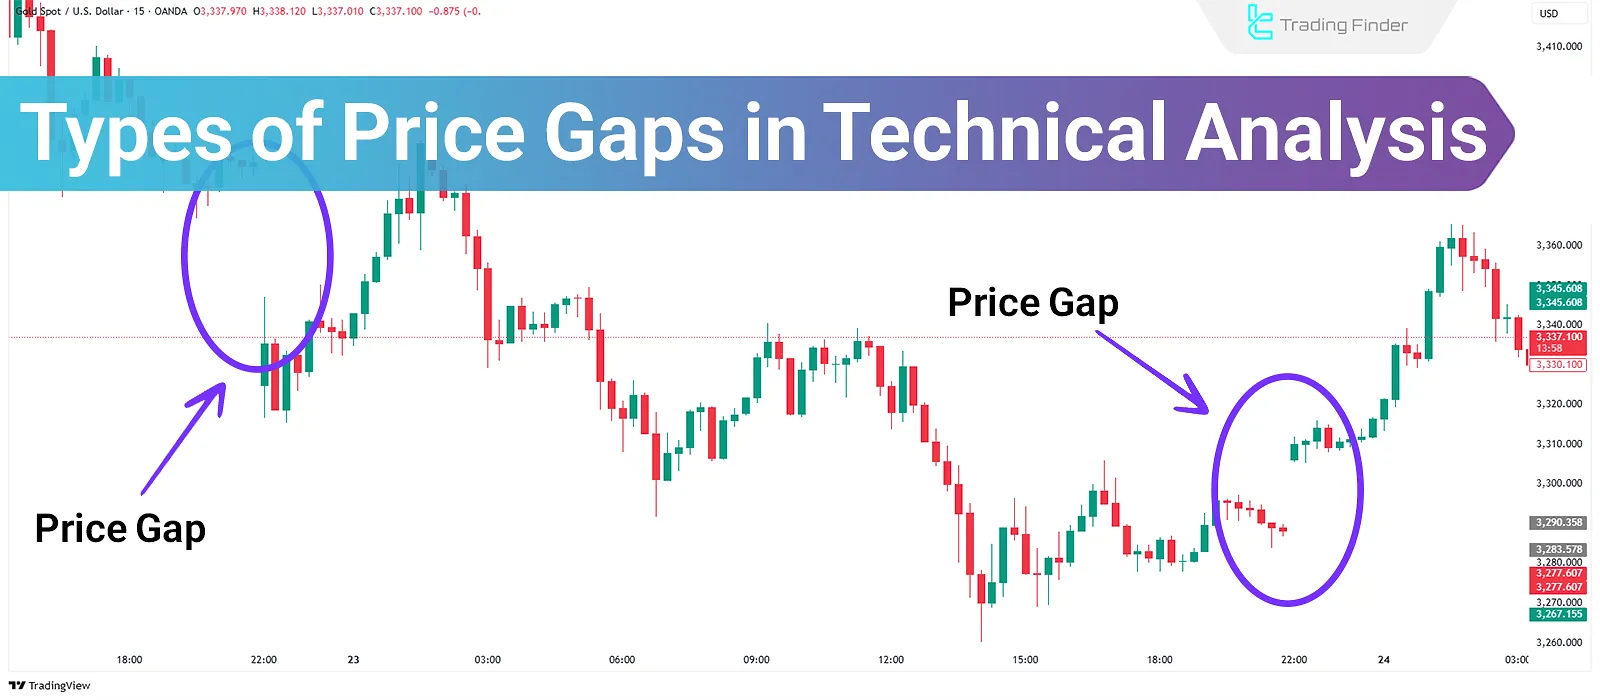
Types of price gaps refer to discontinuities on a price chart where no trading activity has occurred. These types of gaps in trading emerge when the opening price of a candlestick is significantly higher or lower than the close of the previous one.
This phenomenon typically results from sudden price changes, often triggered by economic news or abrupt shifts in supply and demand conditions.
Price gaps, depending on their position on the chart, indicate the strength or weakness of a trend and play an important role in determining entry and exit points.
Analysts assess the likelihood of trend continuation or reversal by examining trading volume and candlestick patterns surrounding the gap.
Why Do Price Gaps Occur on Charts?
Price gaps are formed as a result of sudden changes in the balance between supply and demand and are usually caused by economic events or specific market conditions. The main factors that lead to the formation of gaps include:
- Sudden release of economic news (Economic News) such as interest rate decisions, employment reports, or central bank announcements;
- Differences in market session timing (Market Session Timing), especially between the New York and Sydney sessions;
- Changes in liquidity or trading volume (Liquidity & Volume) during low-activity hours;
- Sudden entry of large institutional orders (Institutional Orders) that trigger price jumps;
- Rapid reaction of trading algorithms (Trading Algorithms) to new data.
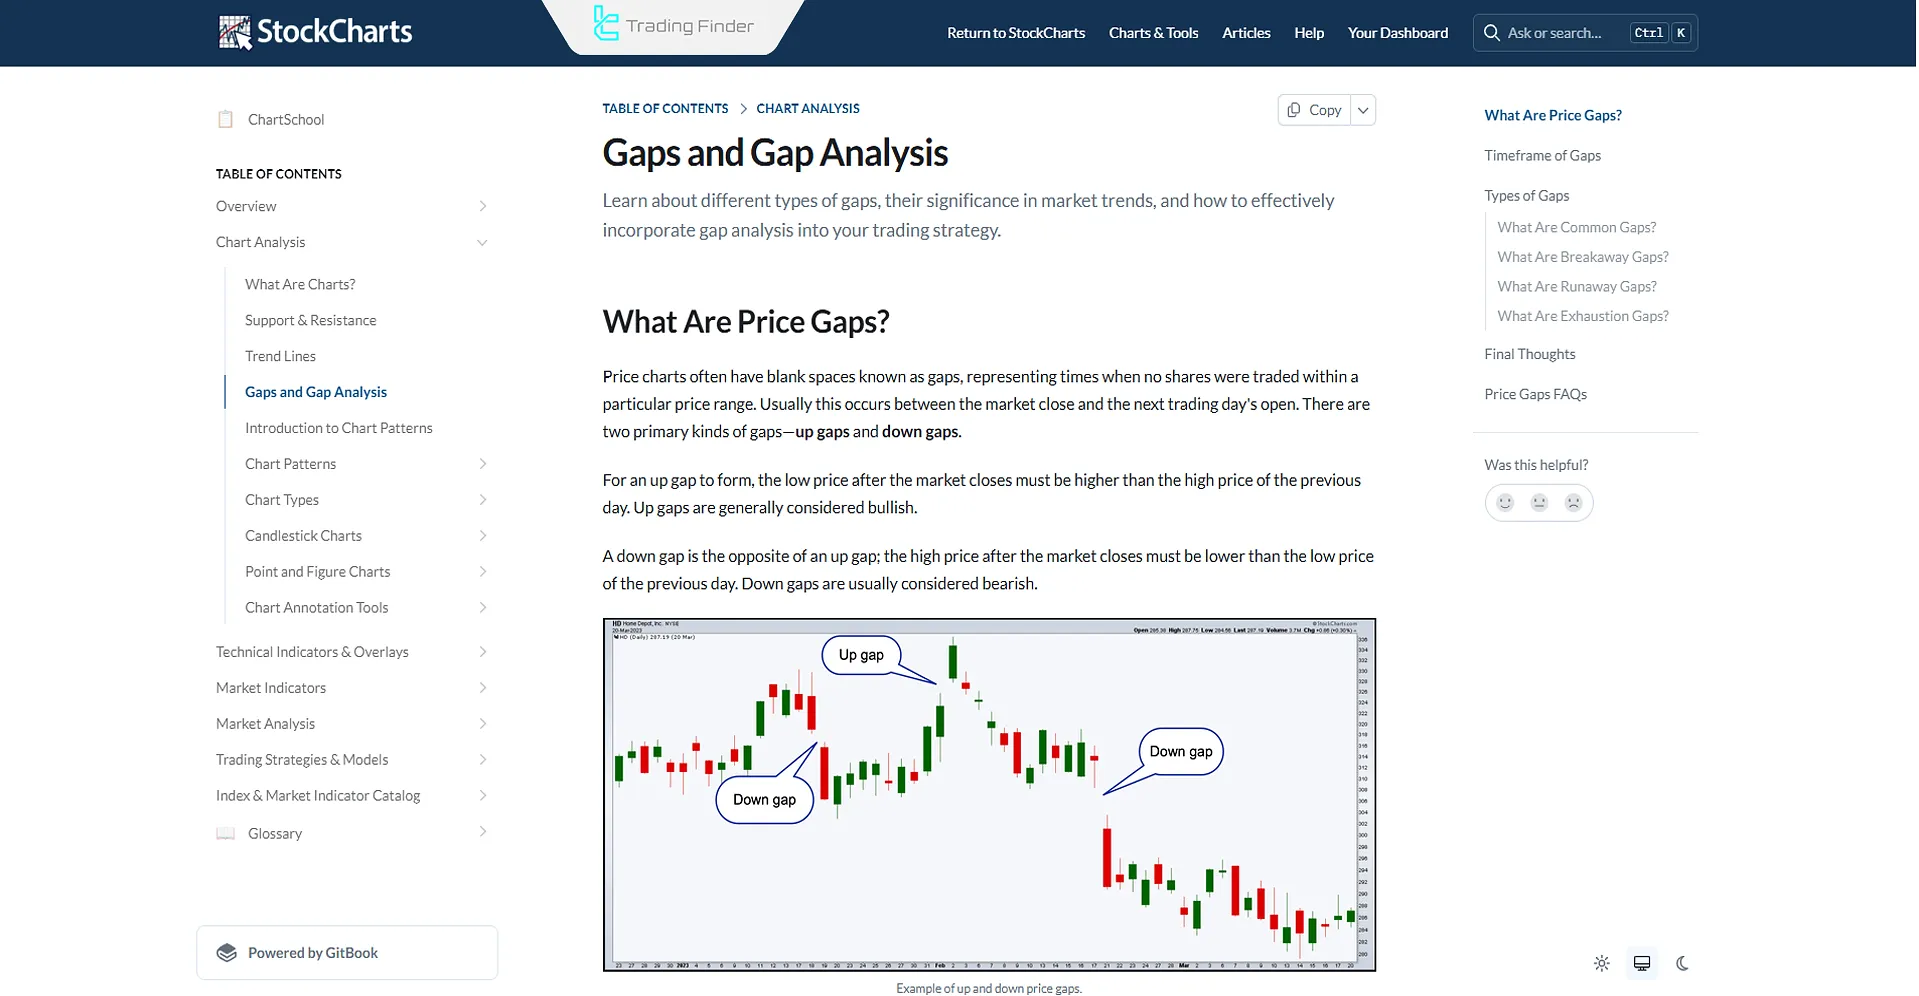
The article price gap analysis tutorial on chartschool.stockcharts.com discusses additional details for identifying and understanding gaps within price movement trends.
Types of Price Gaps in Trading
Each price gap type signals different aspects of market direction, reversal areas, and momentum. Price gaps are classified into four primary categories:
- Common Gap
- Breakaway Gap
- Continuation Gap (Runaway Gap)
- Exhaustion Gap
The table below compares different types of price gaps in terms of trading volume, signal, position within the trend, and key analytical notes in technical analysis:
Type of Price Gap | Technical Definition | Position in Trend | Signal and Meaning | Trading Volume | Key Notes |
Common Gap | Temporary imbalance between supply and demand in a sideways market | Range-bound areas | Low significance, fills quickly | Low | Short-term market excitement, suitable for short-term trades |
Breakaway Gap | Beginning of a new trend accompanied by a breakout of key support or resistance | Start of trend | Start of a new trend, breakout confirmation | High | Strong entry point, confirm with pullback |
Runaway/Continuation Gap | Indicates strength and continuation of the current trend | Middle of trend | Continuation of price movement | Medium to high | Sustained trend momentum, usually not filled until trend completion |
Exhaustion Gap | Sign of final excitement and weakening trend | End of trend | Market reversal warning | Very high, then declining | Often accompanied by divergence and reversal patterns, signal of trend exhaustion |
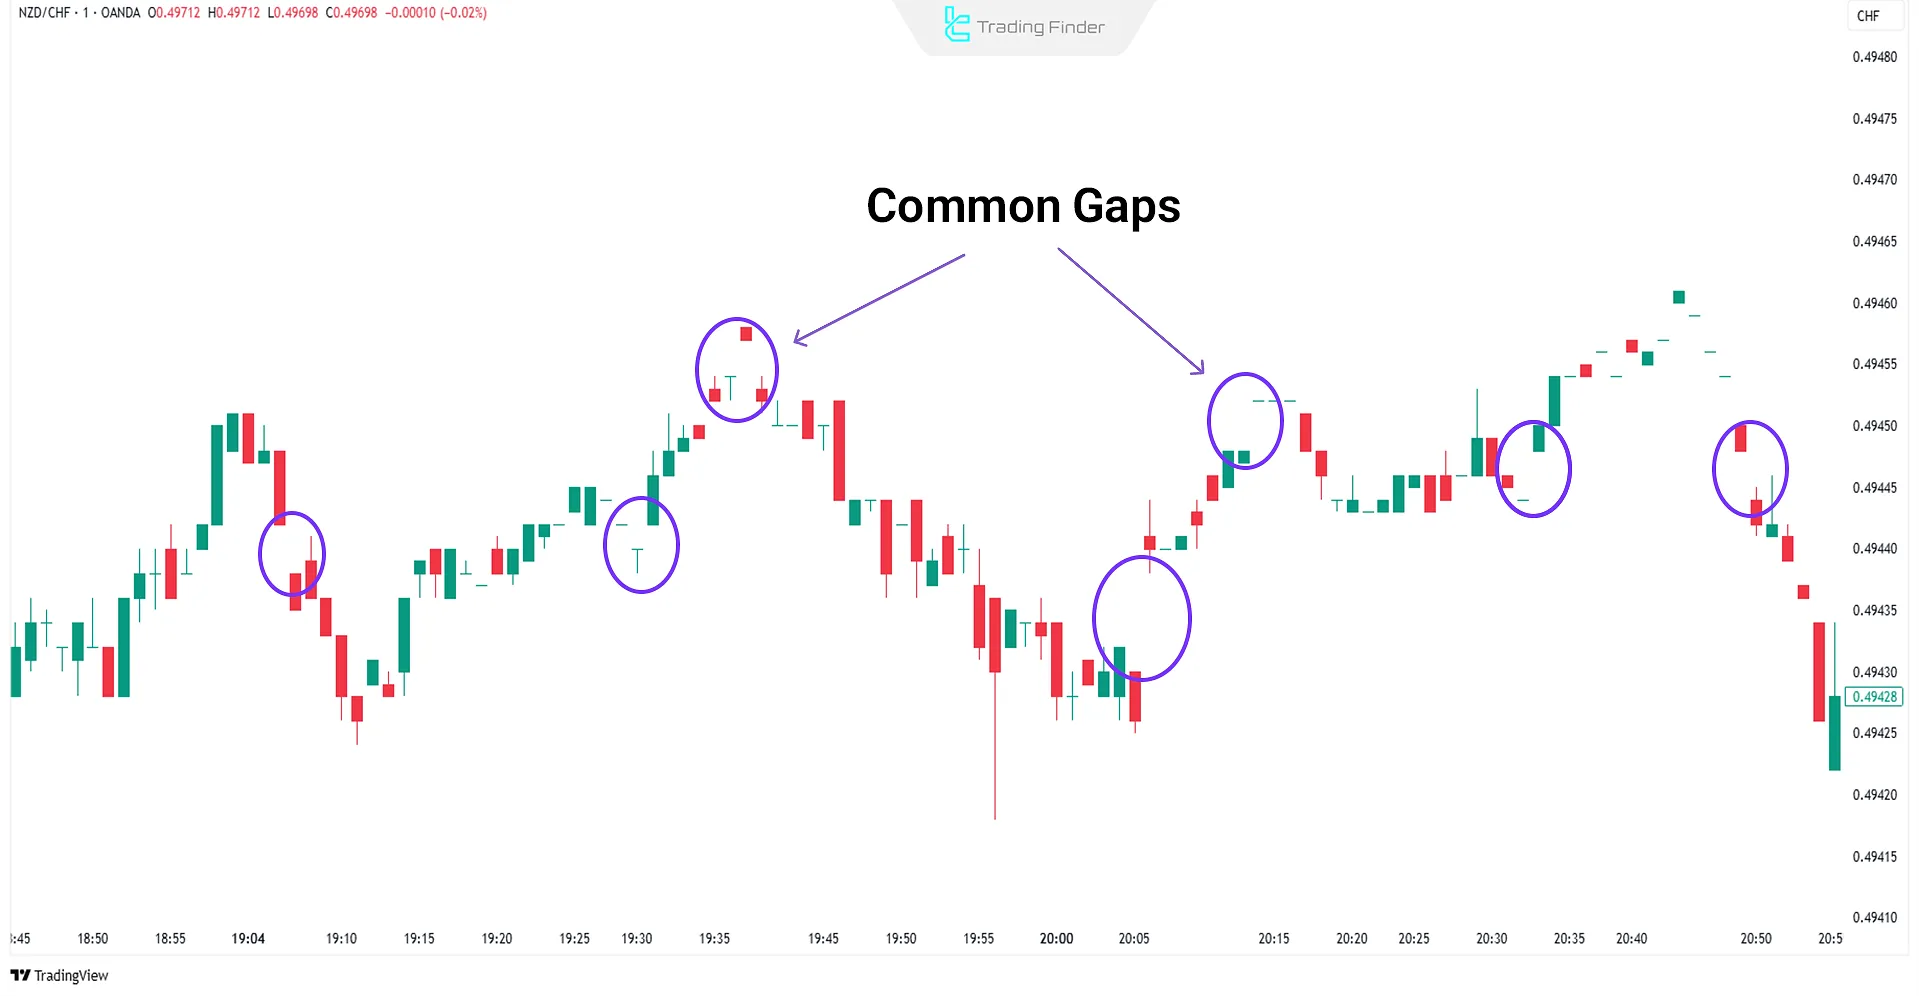
Common Gap
The common gap is one of the most frequently observed types of price gaps, often appearing in choppy or sideways markets with average trading volume.
Characteristics of Common Gaps
- Also known as "area gaps" or "trading gaps"
- Typically, unrelated to major events
- Small in size
- Filled quickly
- Provide no strong market signals
- Usually form within price ranges
Real Example of Common Gap
Below is a chart showing common gaps on the NZD/CHF pair in a one-minute timeframe.
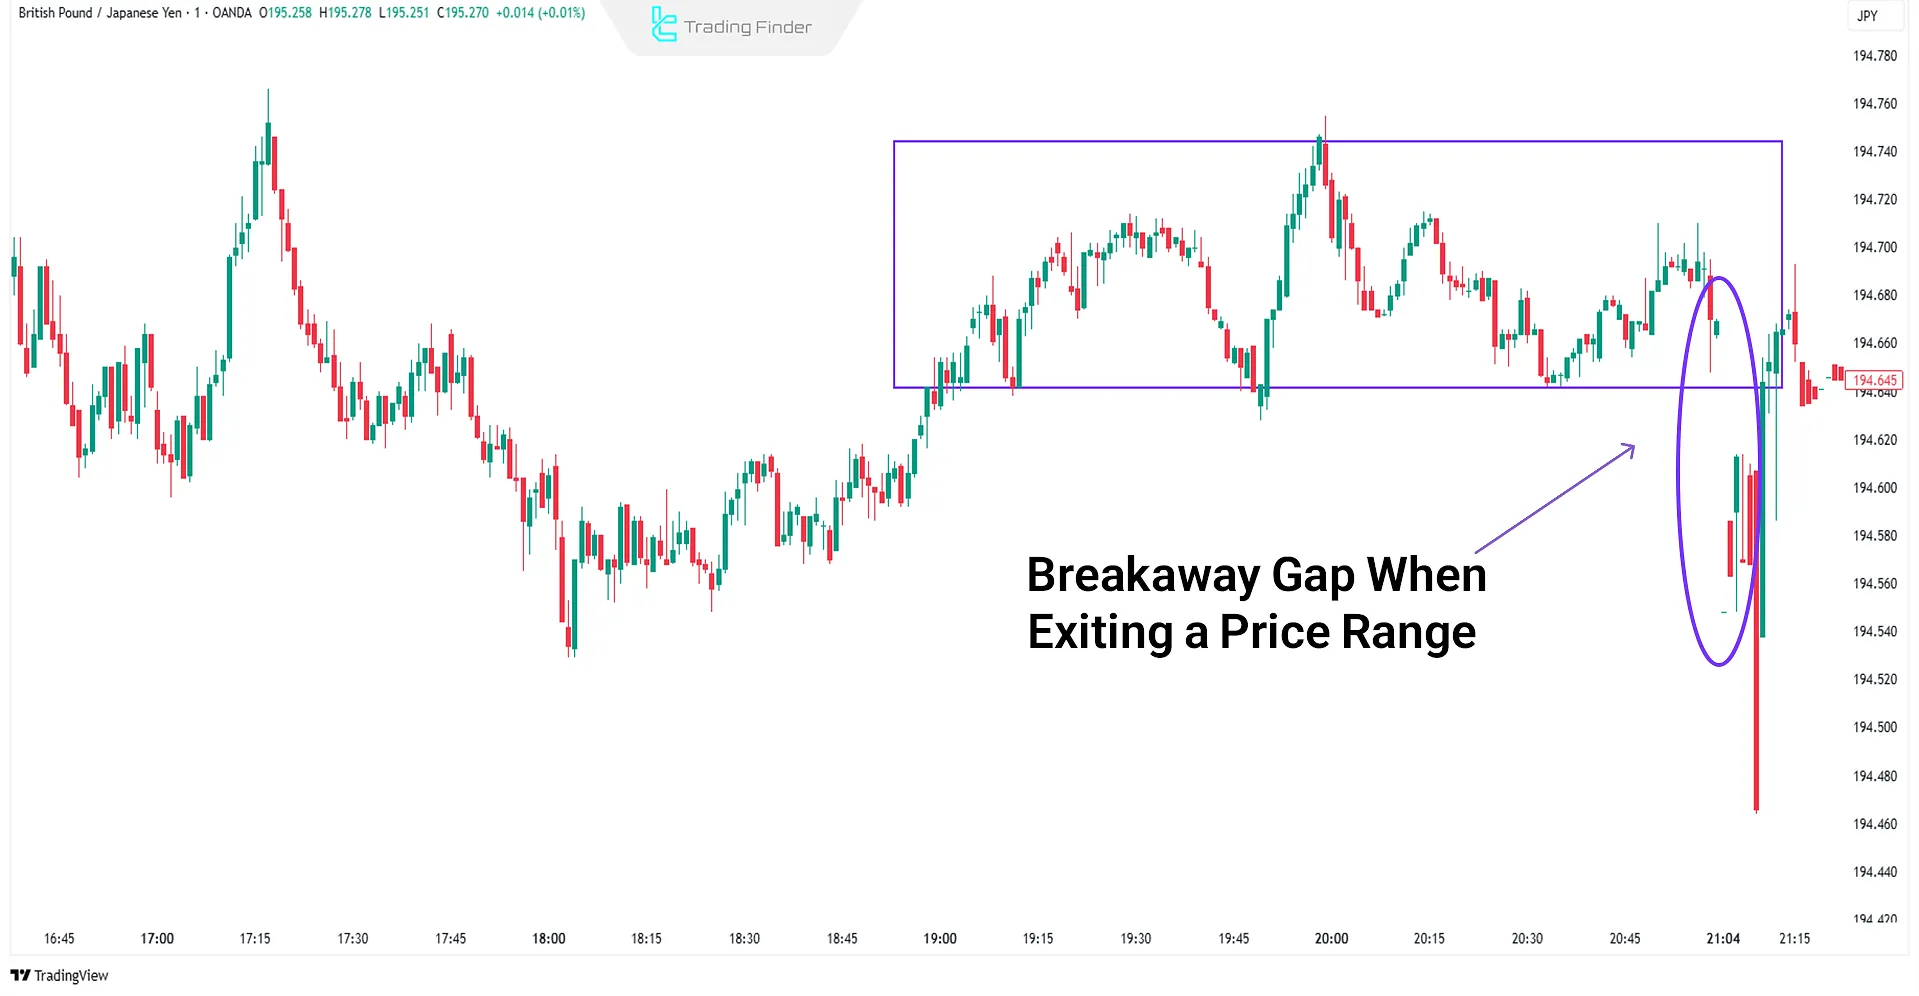
Breakaway Gap
A breakaway gap occurs when the price breaks out from a key support or resistance level. It reflects strong momentum, with price typically continuing in the direction of the gap.
Characteristics of Breakaway Gaps
- Occur at the beginning of a new trend
- Appear after price exits a consolidation zone
- High trading volume
- Indicate trend direction changes
- Rapid price movement
Real Example of Breakaway Gap
The chart below shows a breakawaygap after price exits a range in the GBP/JPY pair (1-minute chart).
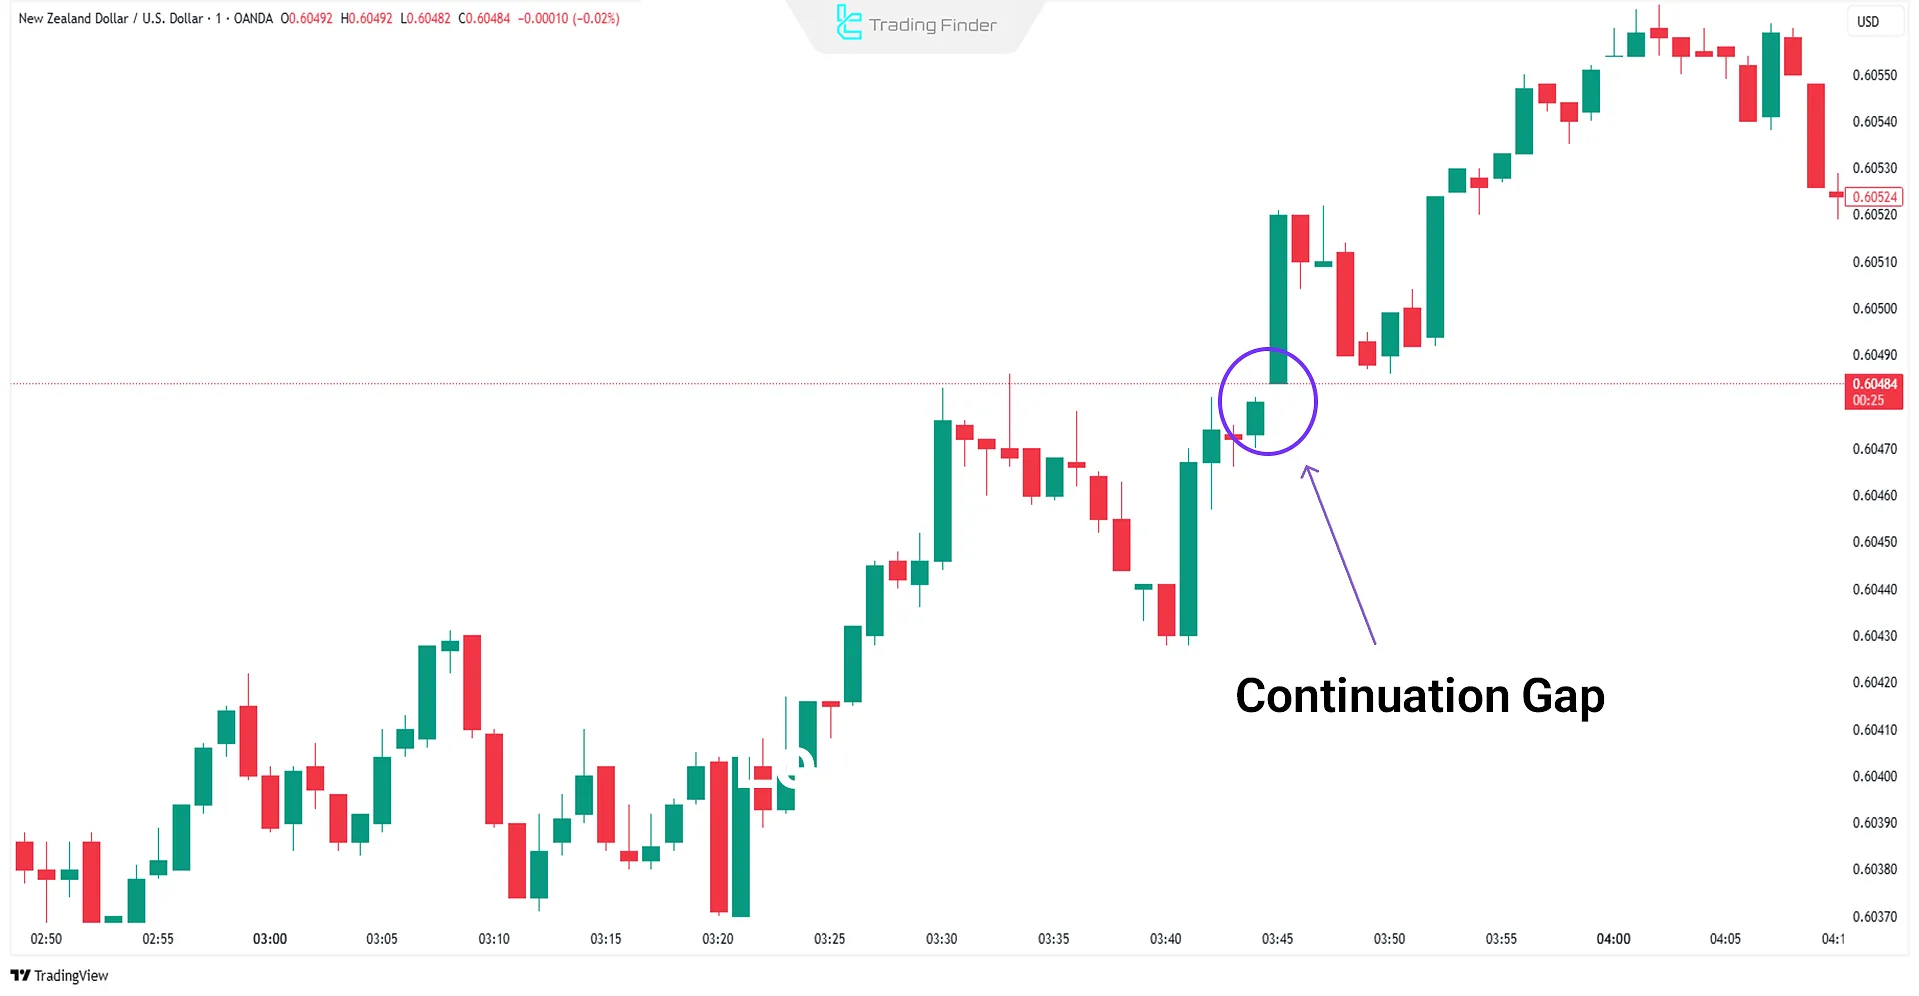
Continuation Gap (Runaway Gap)
The continuation gap, also known as a runaway gap, forms when traders who missed the initial move enter aggressively, causing a surge in buying or selling pressure.
These gaps often remain unfilled for extended periods, suggesting a strong continuation of the trend, whether bullishorbearish.
Characteristics of Continuation Gaps
- Form within strong trends
- Driven by high volume
- Indicate trend strength
- Rarely retrace to gap origin
- May be news-driven
Real Example of Continuation Gap
A continuation gap on the NZD/USD pair in a one-minute chart is shown below.
Exhaustion Gap
Exhaustion gaps typically appear near the end of a trend or around significant support and resistance levels. They may resemble continuationgaps but are usually filled quickly by subsequent candles.
Characteristics of Exhaustion Gaps
- Indicate the end of a trend
- Signal weakening momentum
- Follow prolonged price moves
- Occur near major support/resistance
- Accompanied by high volume
Real Example of Exhaustion Gap
The chart below illustrates an exhaustion gap followed by a trend reversal on the US100 index (1-minute chart).

Comparing Price Gaps in Technical Analysis
Price gaps are used to detect sudden shifts in price action across financial markets. By using price gaps, traders can predict price trends and potential reversal points.
Traders view different types of price gaps as trading opportunities, and there is a common belief among market participants that gaps will eventually be filled.
Difference Between True and Pseudo Gaps in the Market
In technical analysis, not all gaps are real some are formed due to differences in price data between brokers or across timeframes.
Identifying the type of gap allows traders to perform a more accurate analysis of actual price movements.
- True Gap: Occurs when no trades take place between the closing price of the previous candle and the opening price of the new one; usually caused by major news, economic data, or shifts in market sentiment;
- Pseudo Gap: Created as a result of spread differences, broker server discrepancies, or mismatched lower timeframes, and has low analytical reliability.
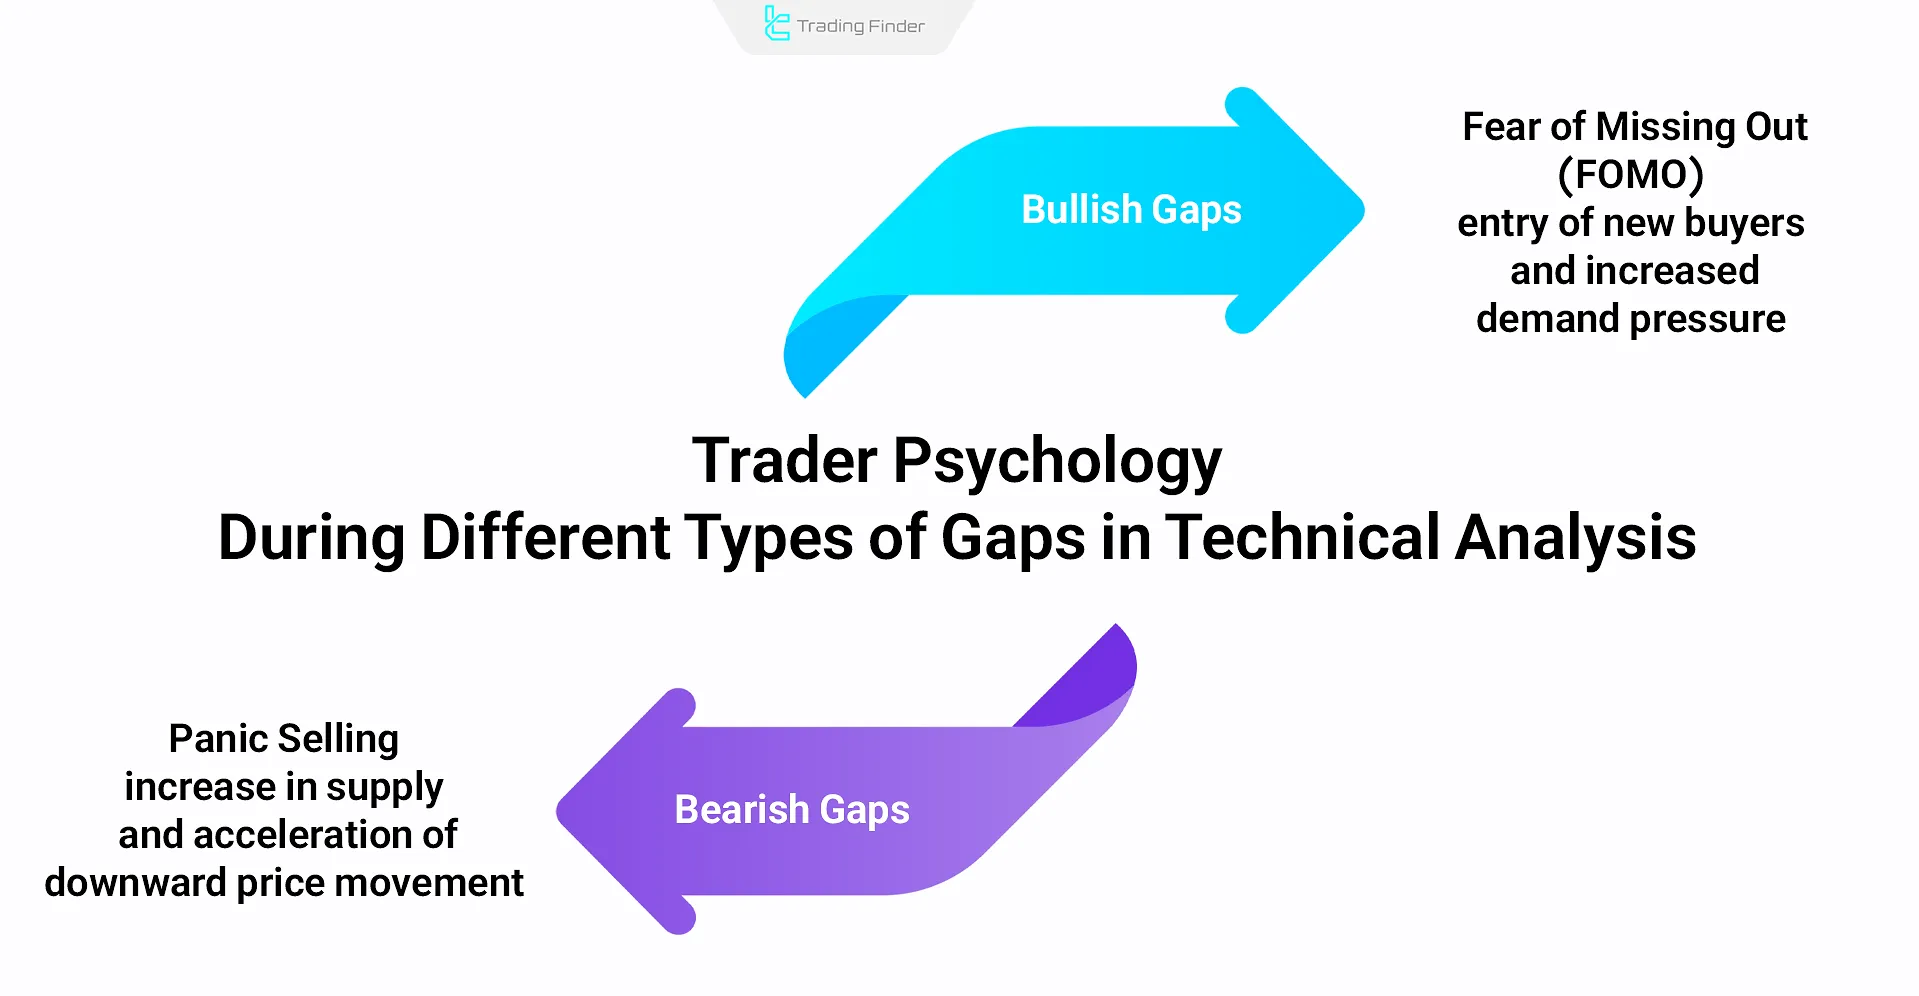
Trader Psychology During Different Types of Gaps in Technical Analysis
Gaps reflect sudden changes in market sentiment and often mark the beginning of strong price movements.
Understanding these behavioral patterns enables analysts to assess trend strength more accurately and keep their trading decisions free from emotional bias.
- In bullish gaps, the Fear of Missing Out (FOMO) drives new buyers into the market, increasing demand pressure;
- In bearish gaps, Panic Selling triggers a rise in supply and accelerates the downward price movement.
Difference Between Price Gaps in Technical Analysis
The various types of gaps in technical analysis provide insights such as trend position and direction, shifts in market sentiment, support and resistance zones, and changes in strength and trading volume. The interpretation of each gap differs based on these factors.
Key Notes on Using Price Gaps
Despite being easy to spot, the correct usage of types of gaps in trading requires trader skill. Misinterpretation can lead to missed opportunities or losses.
- Timing matters: Different gaps mean different things at various times;
- Strategic use: Gaps can serve as entry/exit signals;
- Volume relevance: Volume at the gap provides clues about strength and continuation;
- Type identification: Recognizing the type of gap is essential for technical analysis.
CME Gap in Cryptocurrency Markets
In crypto markets, the CME gap refers to the price difference between Bitcoin's close and open on the Chicago MercantileExchange (CME). These gaps usually occur because cryptoexchanges operate continuously, unlike the CME.
Crypto traders use the CME gap as a reference tool to assess potential price targets and entry and exitpoints.
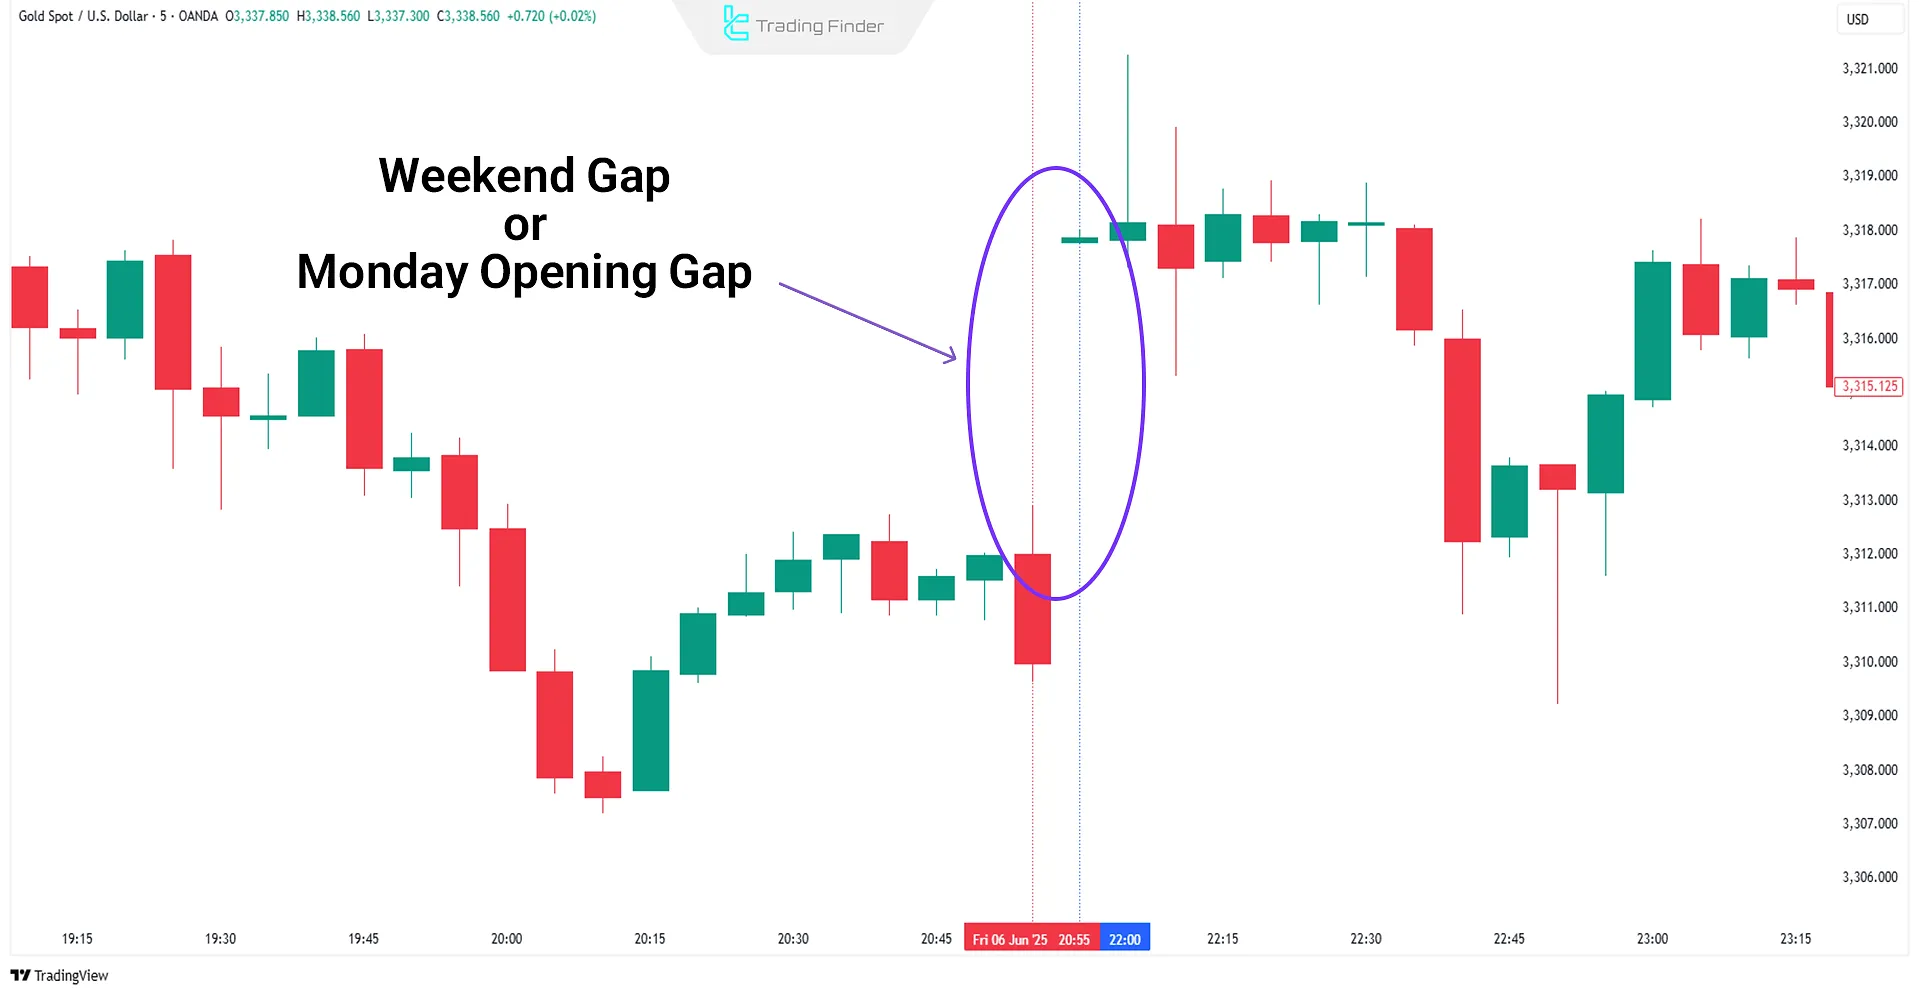
Monday Opening Gaps
At the beginning of a new trading week, price gaps can form due to the release of macroeconomic news over the weekend.
These are often breakaway or continuation gaps, depending on the nature of the move.
Gap Filling or Closing Gaps
In many cases, the market tends to fill the price gap created during its subsequent movement.
This behavior results from the restoration of balance between supply and demand. However, the type of gap plays a decisive role in determining the likelihood of it being filled:
- In breakaway gaps, the price gap usually does not get filled, as its formation is associated with the beginning of a new trend;
- In exhaustion gaps, the probability of being filled is very high because this type of gap typically indicates the end of a trend.
By analyzing trading volume (Volume Analysis) and the position of the gap within the trend structure, analysts can more accurately estimate the likelihood of the gap being filled.
In the educational video on the ClayTrader YouTube channel, more detailed information about price gap filling is provided, and those interested can watch this video for further insight.
Analyzing Gaps Across Different Timeframes
The behavior of price gaps varies across different timeframes, and their interpretation must align with the analytical time scale.
In daily and weekly timeframes, gaps usually occur due to market closures and reactions to new information, giving them higher analytical reliability.
In lower timeframes, such as the one-hour chart, most gaps are pseudo-gaps caused by spread fluctuations or changes in liquidity.
Gap analysis should always be performed in the timeframe that aligns with the trader’s strategy and decision-making horizon.
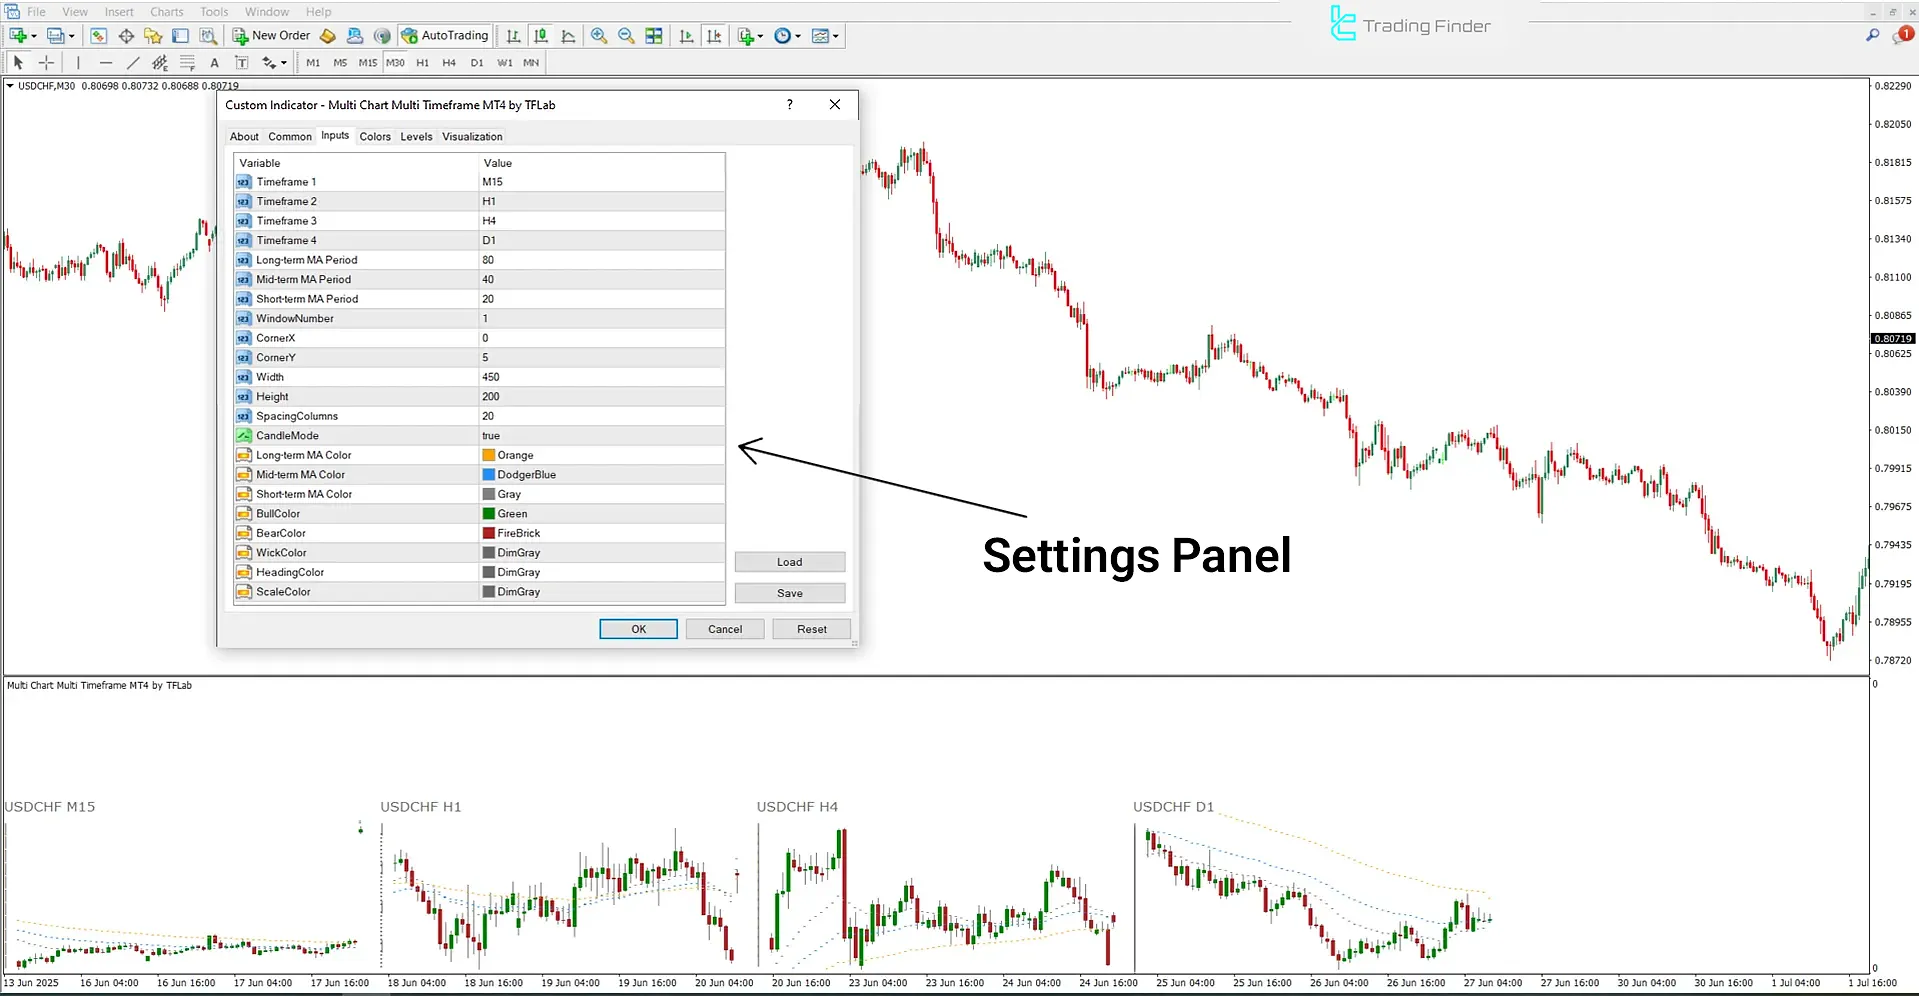
Multi Chart Multi Time Frame Indicator in MetaTrader for Analyzing Charts Across Different Timeframes
The Multi Chart Multi Time Frame Indicator is one of the advanced analytical tools on the MetaTrader platform that enables traders to analyze price movements across multiple timeframes simultaneously.
This feature allows analysts to gain a unified view of the market structure without the need to switch between different time intervals.
- Download Multi Chart Multi Time Frame Indicator for MetaTrader 5
- Download Multi Chart Multi Time Frame Indicator for MetaTrader 4
Within this indicator, data such as price charts, moving averages, and various analytical filters are displayed in a separate window. This setup enables users to study both the overall and detailed market trends across short-, medium-, and long-term timeframes.
This capability is highly useful for day trading, scalping, and swing trading.
When price movements align across multiple timeframes, the likelihood of forming a strong trend increases. For example, in a currency pair chart, when the price remains above the moving averages and forms new highs, it confirms the continuation of a bullish trend.
Conversely, inconsistency between signals can indicate a potential trend reversal or a transition to a consolidation phase.
For instance, analyzing a currency pair chart on the daily and 4-hour timeframes may show the price moving below the moving average, reinforcing the probability of a bearish continuation.
In the indicator’s settings panel, users can select multiple time intervals (from 1 to 4 timeframes), define periods for long-, medium-, and short-term moving averages, and customize candle colors, scale, and display position.
This high level of customization ensures compatibility with any trading style.
The Multi Chart Multi Time Frame Indicator is an intelligent tool that combines multi-timeframe analysis with moving averages.
It provides a comprehensive market view across forex, cryptocurrencies, stocks, and commodities, helping traders identify entry and exit points with higher accuracy and optimize trading decisions based on simultaneous multi-chart analysis.
Conclusion
Types of price gaps appear as gaps between candlesticks, providing various market insights based on timing and location. Traders use them for price analysis and to define entry and exit levels.
They reveal information on trend strength, market sentiment shifts, and key levels. In the cryptocurrency market, the CME gap has become a key tool for Bitcoin traders.


