


In technical analysis, identifying the strength of a trend is just as important as recognizing its direction. The ADX Indicator serves as a tool for measuring trend strength and helps distinguish between trending and ranging markets.
With this indicator, traders can avoid entering weak or non-trending positions.
What is the ADX Indicator?
The ADX Indicator, or Average Directional Index, is used to assess the strength of a price trend, regardless of its direction. Through this indicator, traders can determine whether the market is trending or moving sideways in a ranging pattern.
Using the ADX Indicator in Technical Analysis is especially valuable for identifying suitable trading charts and confirming entries during trend continuation.
ADX Indicator Calculation Formula
The ADX is composed of three main components, each responsible for a part of trend strength measurement. Combined, they provide insights into market movement:
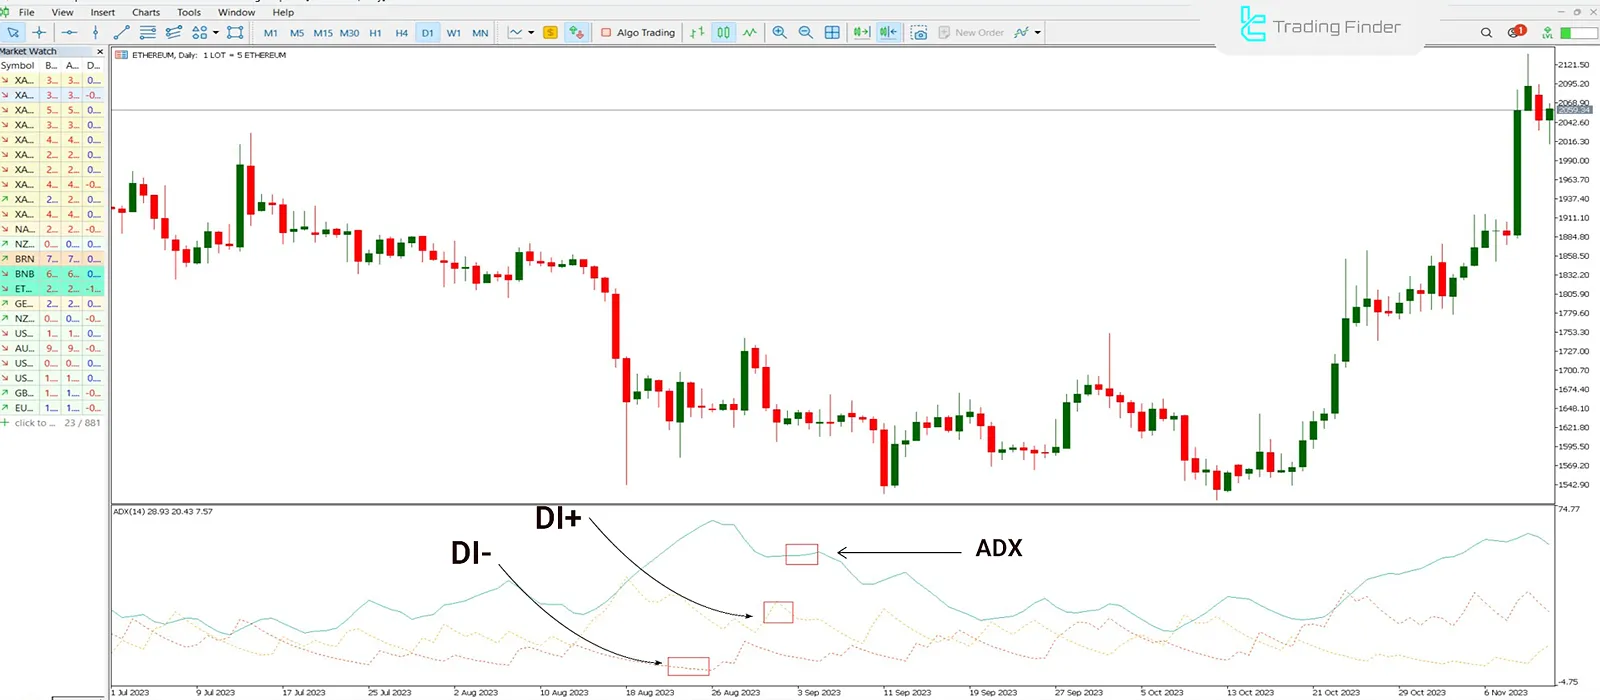
- +DI (Positive Directional Indicator)
- -DI (Negative Directional Indicator)
- ADX (Average Directional Index)
These components work together to measure trend strength. The ADX is derived from the difference between +DI and -DI, then smoothed using a moving average (typically 14 periods).
ADX Calculation Steps
To better understand how the ADX Indicator works, it is important to grasp the following steps:
Calculate Directional Movement (DM)
First, determine the daily price direction relative to the previous day. Directional movement is calculated as follows:
- If (Today's High – Yesterday's High) is bigger than (Yesterday's Low – Today's Low), then it's a positive movement;
- If (Yesterday's Low – Today's Low) is bigger than (Today's High – Yesterday's High), then it's a negative movement;
Otherwise, both values are zero.
Calculate +DI and -DI
Divide the positive and negative DM values by the Average True Range (ATR), and smooth them over a set period to obtain +DI and -DI.
Calculate Directional Index (DX)
With the +DI and -DI values, calculate the directional index:
Calculate ADX
Smooth the DX values using an exponential moving average (EMA) over a specific period (e.g., 14 days):
Explanation: EMA is used to average the DX over 14 periods.
ADX Indicator Structure
The ADX Indicator measures trend strength on a scale from 0 to 100, without indicating trend direction.
An ADX value below 20 usually signals a lack of a clear trend or a ranging market. When the ADX exceeds 50, it indicates a strong trend, whether bullish or bearish.
The ADX is built upon +DI and -DI, which measure upward and downward movements, respectively. The ADX itself averages the difference between these two indicators, providing a single value that reflects trend strength.
How ADX Provides Signals
When the ADX value exceeds 40, it typically indicates that the market is entering a strong trending phase. If this occurs alongside a breakout from a technical level like support or resistance, it can be a confirmation of a powerful move.
Conversely, if ADX starts falling after rising above 50, it may signal a weakening trend. In such cases, the market may be transitioning into a corrective or ranging phase.
Example of Trend Strength in ADX
In the 4-hour chart of XAUUSD (Gold vs USD), an ADX value above 50 with an upward slope indicates a strong trend. However, when the slope declines and the ADX falls below20, it often signifies trend weakening and a shift to range-bound conditions.

Combining ADX with Other Indicators
Since the ADX Indicator only measures trend strength, it's best used in combination with indicators that define trend direction. Examples:
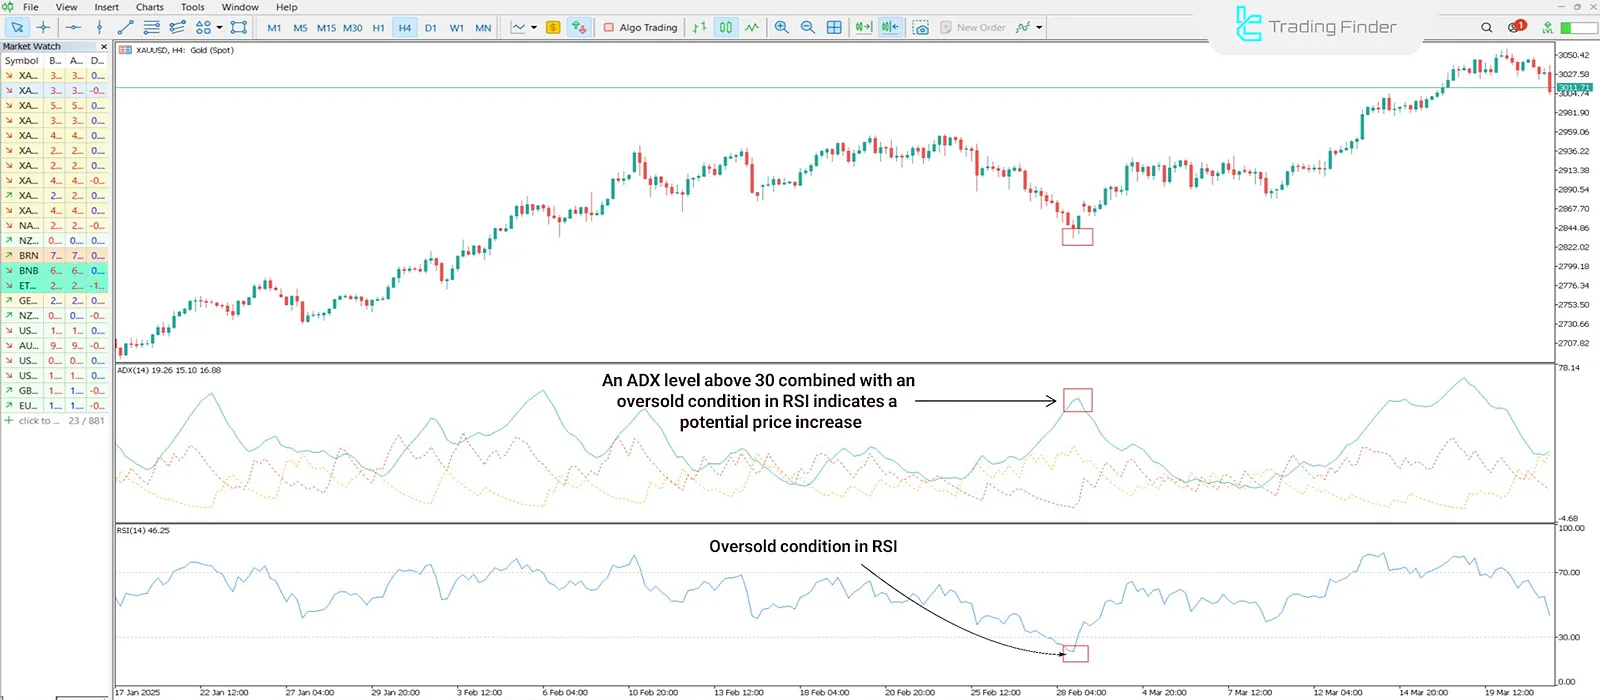
ADX and RSI
RSI is useful for identifying overbought and oversold levels, especially in ranging markets. When ADX is above 25 or 30 (indicating trend strength) and RSI bounces from the oversold zone, it may signal the start of a bullish trend.
Conversely, in strong trends, a reversal from RSI's overbought zone may indicate a bearish turn.
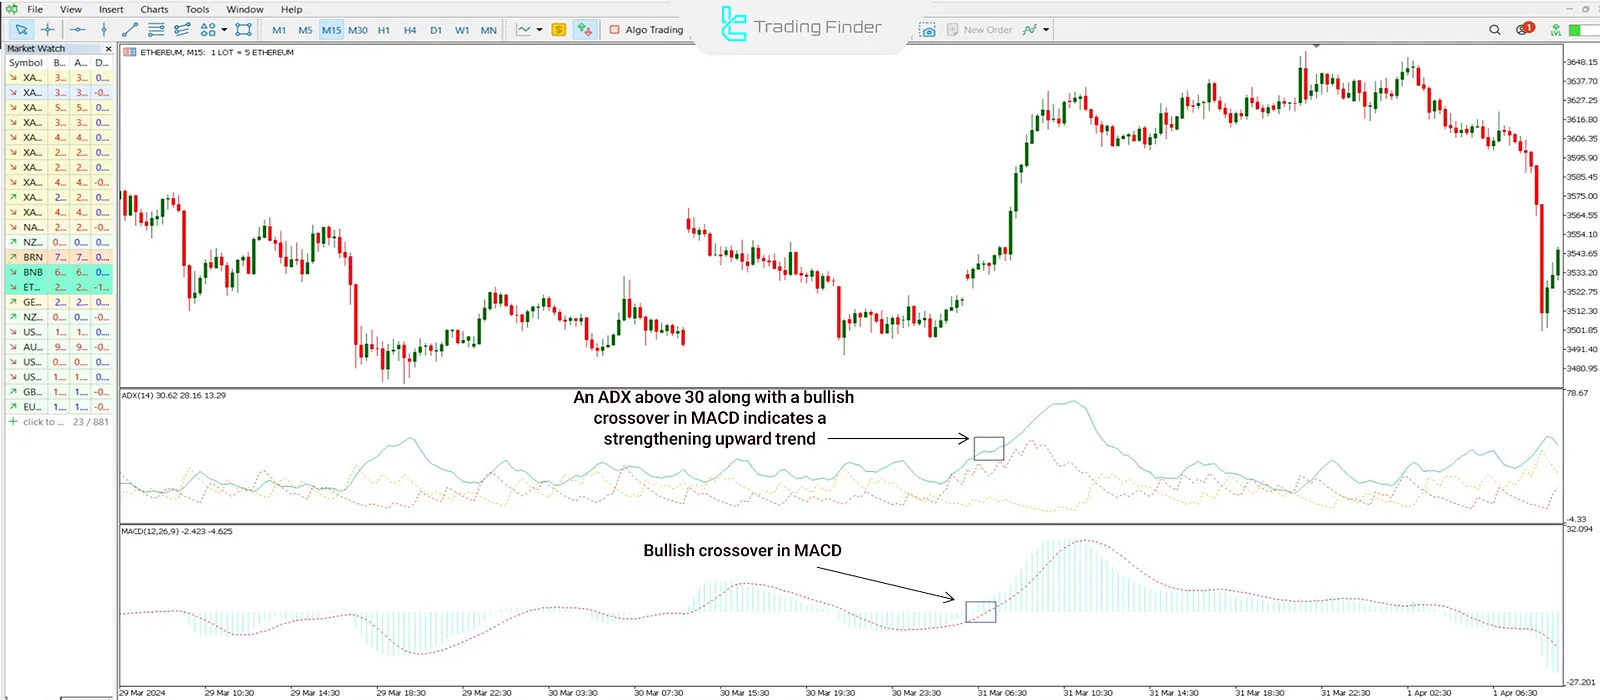
ADX and MACD
MACD Indicator detects trend direction and momentum. When ADX is above 30 and a bullish crossover occurs in MACD, the likelihood of a strong upward trend increases. Similarly, a strong ADX with a bearish crossover in MACD can confirm a downward trend.
Common Mistakes with the ADX Indicator
Despite its popularity, many traders misuse the ADX. Here are some common errors:
Using ADX as a Buy/Sell Signal
ADX measures trend strength, not direction. Relying on it alone for trade entries is a mistake. Always combine it with directional indicators.
Ignoring the Slope of ADX
The slope of the ADX line is crucial. A rising slope shows a strengthening trend even if ADX is below 25. A falling slope can indicate weakening momentum even if ADX is above 40.
Using ADX in Low-Volatility Markets
During inactive periods (e.g., pre-news or low-volume sessions), ADX may provide misleading signals. In such cases, it's best to wait for additional confirmations.
Neglecting Time Frame Relevance
ADX behavior varies across time frames. A value indicating a strong trend in a daily chart may be insignificant in an hourly one; Misinterpreting this can lead to poor analysis.
Not Combining ADX with Price Action or Key Levels
Solely relying on ADX is limiting. Enhancing its use with support/resistance, candlestick patterns, or breakout signals strengthens analysis.
Conclusion
The ADX Indicator is a valuable tool for measuring trend strength, but it doesn't indicate direction. It effectively identifies trending vs. ranging markets, but interpretation should include slope analysis, timeframe context, and combination with other tools like RSI or MACD.
ADX signals are most valid when aligned with price breakouts or structural shifts. Beyond trend confirmation, the ADX is also instrumental in filtering out low-probability market conditions.


