


A Pivot Point in Technical Analysis is a computational method that identifies key market levels for the next trading day based on price data. These levels are directly derived from the previous day's price behavior and help anticipate potential market turning points.
The main use of the Pivot Point is to define zones where price reactions (either reversals or breakouts) are likely. Day traders, scalpers, and even trading algorithms use it to design entry, exit, and stop-loss levels because, unlike subjective levels, pivot points are numerical, specific, and repeatable.
What is a Market Pivot Point?
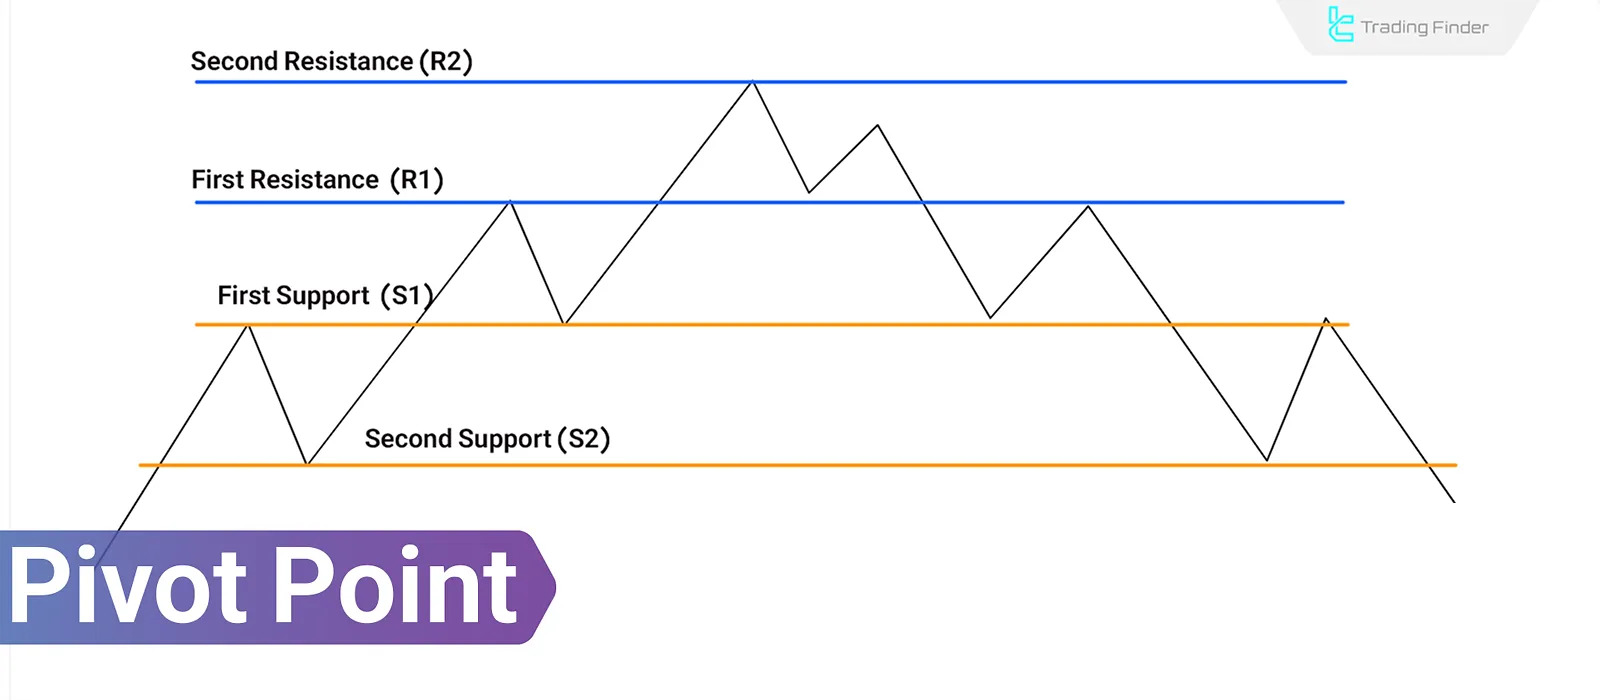
A Pivot Point is a level calculated from the average of the previous day's high, low, and closing prices. It acts as a dividing line between bullish and bearish market sentiment for the current trading day. If the price remains above the Pivot Point, the market tends to be bullish; if below, selling pressure is dominant.
This level serves as the basis for calculating supportand resistance levels. Price often reacts to or reverses in these areas. Traders use Pivot Points to determine entry and exit points, stop-loss levels, and price targets.
For convenience, you can use TradingFinder Pivot Point indicators for easy calculation:
- Pivot Point Indicators for MetaTrader 4
- Pivot Point Indicators for MetaTrader 5
- Pivot Point Indicators for TradingView
How to Calculate a Pivot Point?
The Pivot Point is derived from three key prices of the previous day, reflecting the real market behavior and forming the basis for important levels of the current day:
- High: The highest price
- Low: The lowest price
- Close: The closing price
Pivot Point Calculation Formula:
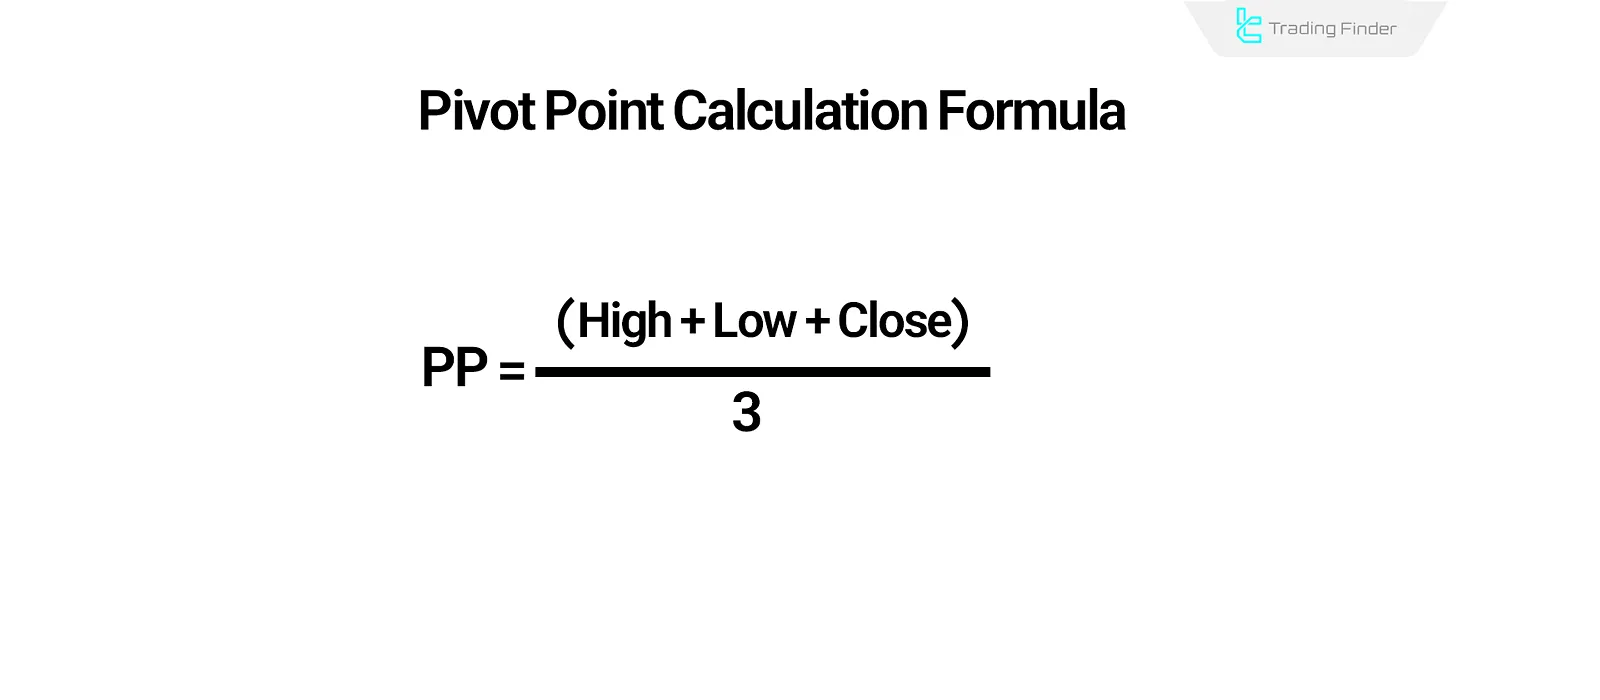
This value becomes the central point and the foundation for support and resistance level calculations.
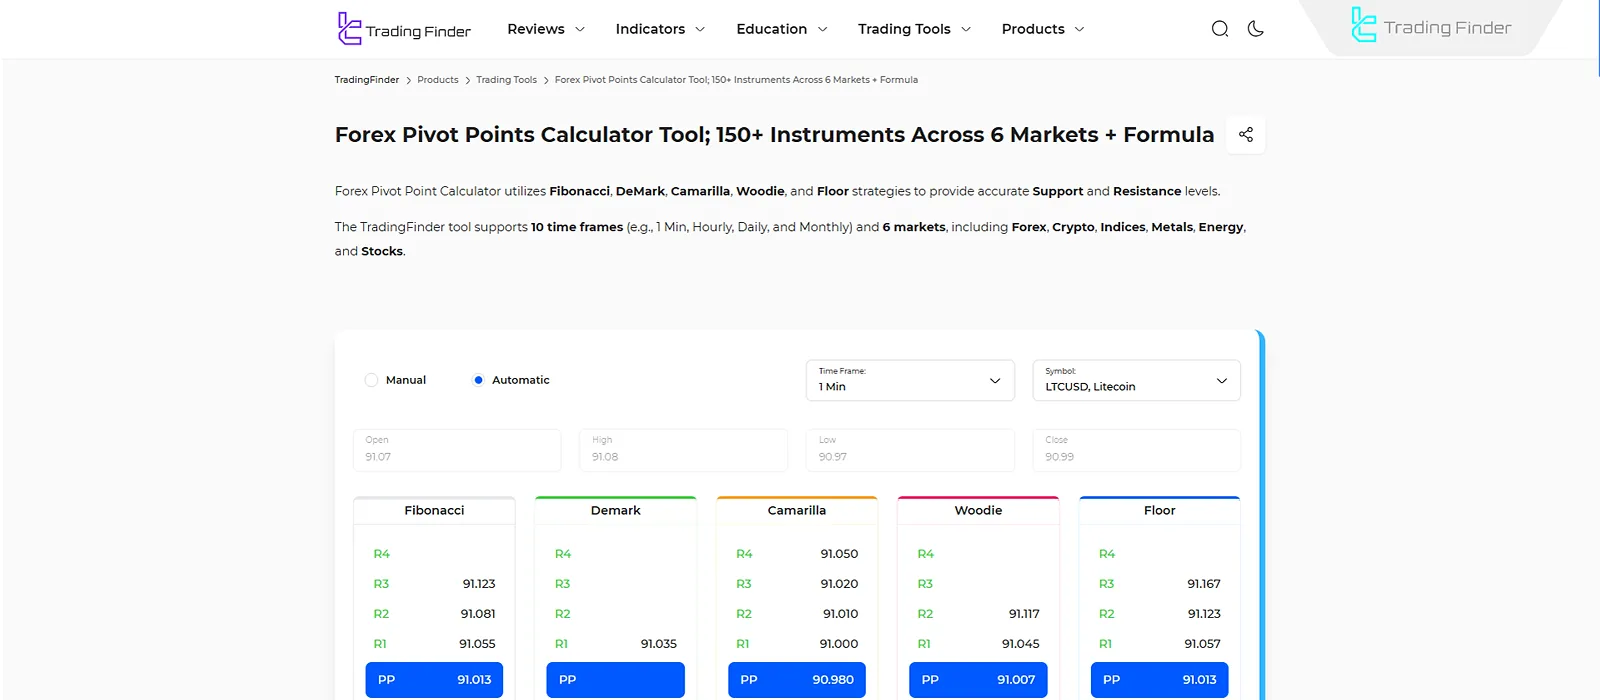
Note: You can use the TradingFinder Pivot Point Calculator Tool to calculate the Pivot Point.
Calculating Resistance in a Pivot Point (Pivot Point)
Resistance levels are specific zones where the probability of a bullish trend halting or reversing increases. These levels are typically considered as areas to sell or reduce long positions. Here's how to calculate resistance in a Pivot Point:
Calculating Support in a Pivot Point (Pivot Point)
Support levels are zones where buying pressure increases, and the likelihood of a bearish trend reversing becomes higher.
Different Methods of Pivot Point Calculation
Each Pivot Point calculation method has its own unique structure and is used in different market conditions or trading styles. Here are the common methods:
Standard Pivot
The most widely used model, based on the average of the high, low, and closing prices of the previous day. It provides a reference point to assess buying and selling pressure. Pivot Point Calculation Formula in the Classic Method (Standard Pivot):
Fibonacci Pivot
Same as the standard pivot but uses Fibonacci ratios (e.g., 0.382, 0.618) to calculate support and resistance levels.
Fibonacci Resistance Levels:
Fibonacci Support Levels:
Woodie Pivot
More sensitive to the closing price compared to the standard method:
Camarilla Pivot
Focuses on intraday movements and uses fixed multipliers to calculate fourresistance and foursupport levels. It is suitable for volatile markets, especially in scalping and reversal trading.
Example Formula for R4:
DeMark Pivot
Unlike other methods, DeMark uses the previous day's closing price and its relationship to the opening price to adjust the high and low. DeMark Pivot formula:
Practical Applications of Pivot Points in Trading
Pivot Points serve as a reference framework for determining daily market bias, potential reversal zones, and price-reaction-based entry/exitlevels. Key usage methods include:
- Entry and Exit Points
- Setting Take-Profit and Stop-Loss
- Market Direction Analysis
- Combination with Indicators
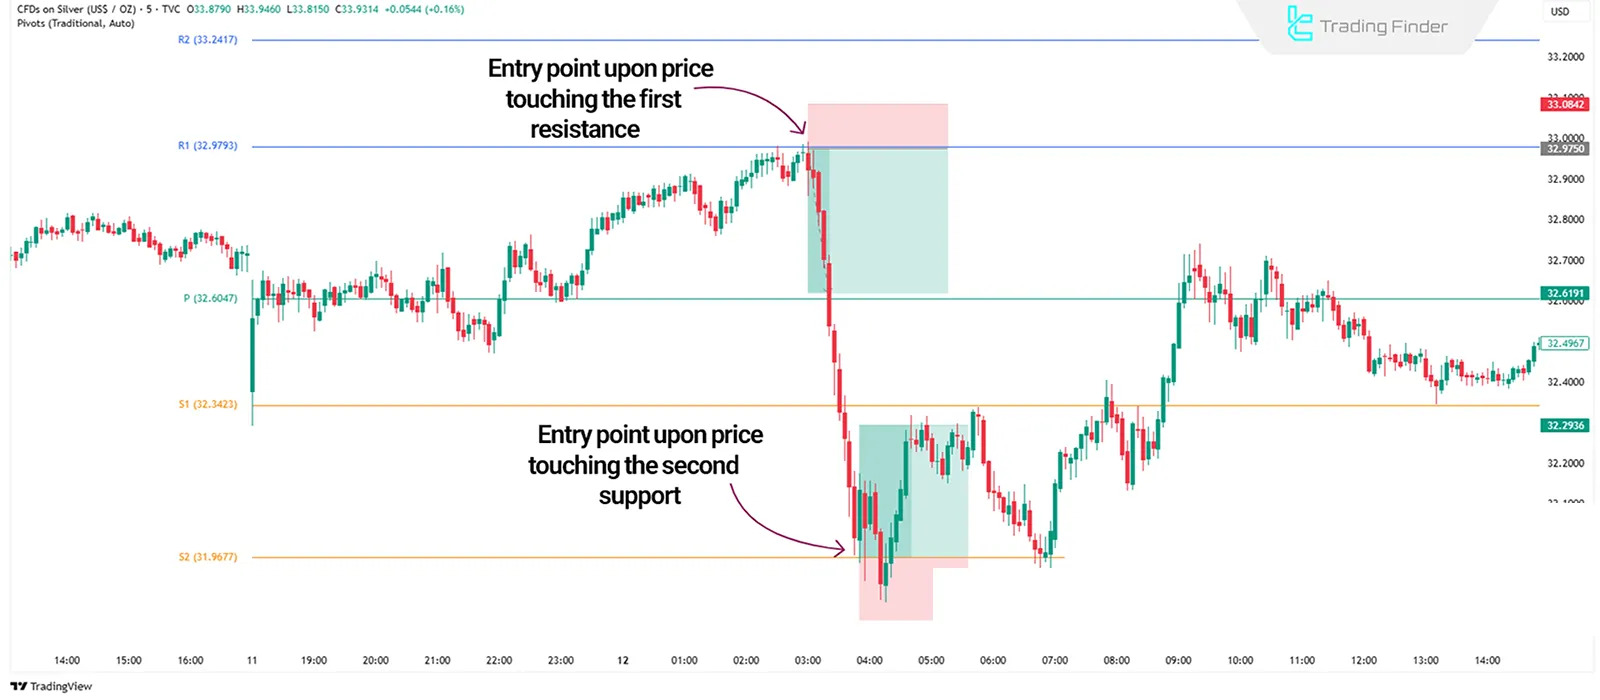
Entry and Exit Points
Pivot Pointsupport and resistance levels form zones where the price typically reacts or breaks through. Traders adjust their positions accordingly.
Setting Take-Profit and Stop-Loss
R1, R2, S1, and S2 Levels are ideal zones to set take-profit and stop-loss orders, as price reactions here are more probable. Stop-loss is typically placed behind the broken level.
Market Direction Analysis
If the price remains above Pivot Point most of the day, the market has a bullish bias; If it is below, the trend is bearish. This positioning helps define potential buy/sell signals.
Combination with Indicators
Pivot Points are more powerful when combined with indicators like RSI, MACD Indicator, or moving averages. For example, an RSI divergence near R2 or a moving average crossover around the Pivot Point can validate an entry or exit signal.
Conclusion
Pivot Point, a numeric tool based on the previous day's data, identifies key entry, exit, and reversal zones. Price often reacts to the PP level, but breaking and holding above R1 or below S1 indicates trend continuation.
Combining Pivot Points with structural confirmations on lower timeframes increases entry accuracy. The method used (Standard, Fibonacci, Woodie, Camarilla) should match market volatility.


