![AMKA Indicator for MetaTrader 4 – Free Download [TradingFinder]](https://cdn.tradingfinder.com/image/460253/2-104-en-amka-indicator-mt4-1.webp)
![AMKA Indicator for MetaTrader 4 – Free Download [TradingFinder] 0](https://cdn.tradingfinder.com/image/460253/2-104-en-amka-indicator-mt4-1.webp)
![AMKA Indicator for MetaTrader 4 – Free Download [TradingFinder] 1](https://cdn.tradingfinder.com/image/460262/2-104-en-amka-indicator-mt4-2.webp)
![AMKA Indicator for MetaTrader 4 – Free Download [TradingFinder] 2](https://cdn.tradingfinder.com/image/460252/2-104-en-amka-indicator-mt4-3.webp)
![AMKA Indicator for MetaTrader 4 – Free Download [TradingFinder] 3](https://cdn.tradingfinder.com/image/460264/2-104-en-amka-indicator-mt4-4.webp)
The AMKA indicator is a type of adaptive moving average based on the Kaufman algorithm.
Compared to standard moving averages like SMA or EMA, this trading tool features two key differences:
- In trending markets, It reacts faster to price changes and aligns with the trend movement;
- In ranging or sideways markets, it moves more slowly to reduce false signals.
AMKA Indicator Table
The general specifications of the AMKA indicator are shown in the table below.
Indicator Categories: | Signal & Forecast MT4 Indicators Currency Strength MT4 Indicators Momentum Indicators in MT4 |
Platforms: | MetaTrader 4 Indicators |
Trading Skills: | Elementary |
Indicator Types: | Reversal MT4 Indicators |
Timeframe: | Multi-Timeframe MT4 Indicators |
Trading Style: | Intraday MT4 Indicators |
Trading Instruments: | Stock Market MT4 Indicators Cryptocurrency MT4 Indicators Forex MT4 Indicators |
Overview of the AMKA Indicator
The Adaptive Moving Average Kauffman (AMKA) uses a 9-period adaptive moving average to identify trend reversal points and the current market direction.
In trending markets, the AMA line can serve as a dynamic support or resistance level.
The tool visually displays entry signals:
- Blue Dots: Indicate bullish (buy) signals;
- Red Dots: Indicate bearish (sell) signals.
Indicator in an Uptrend
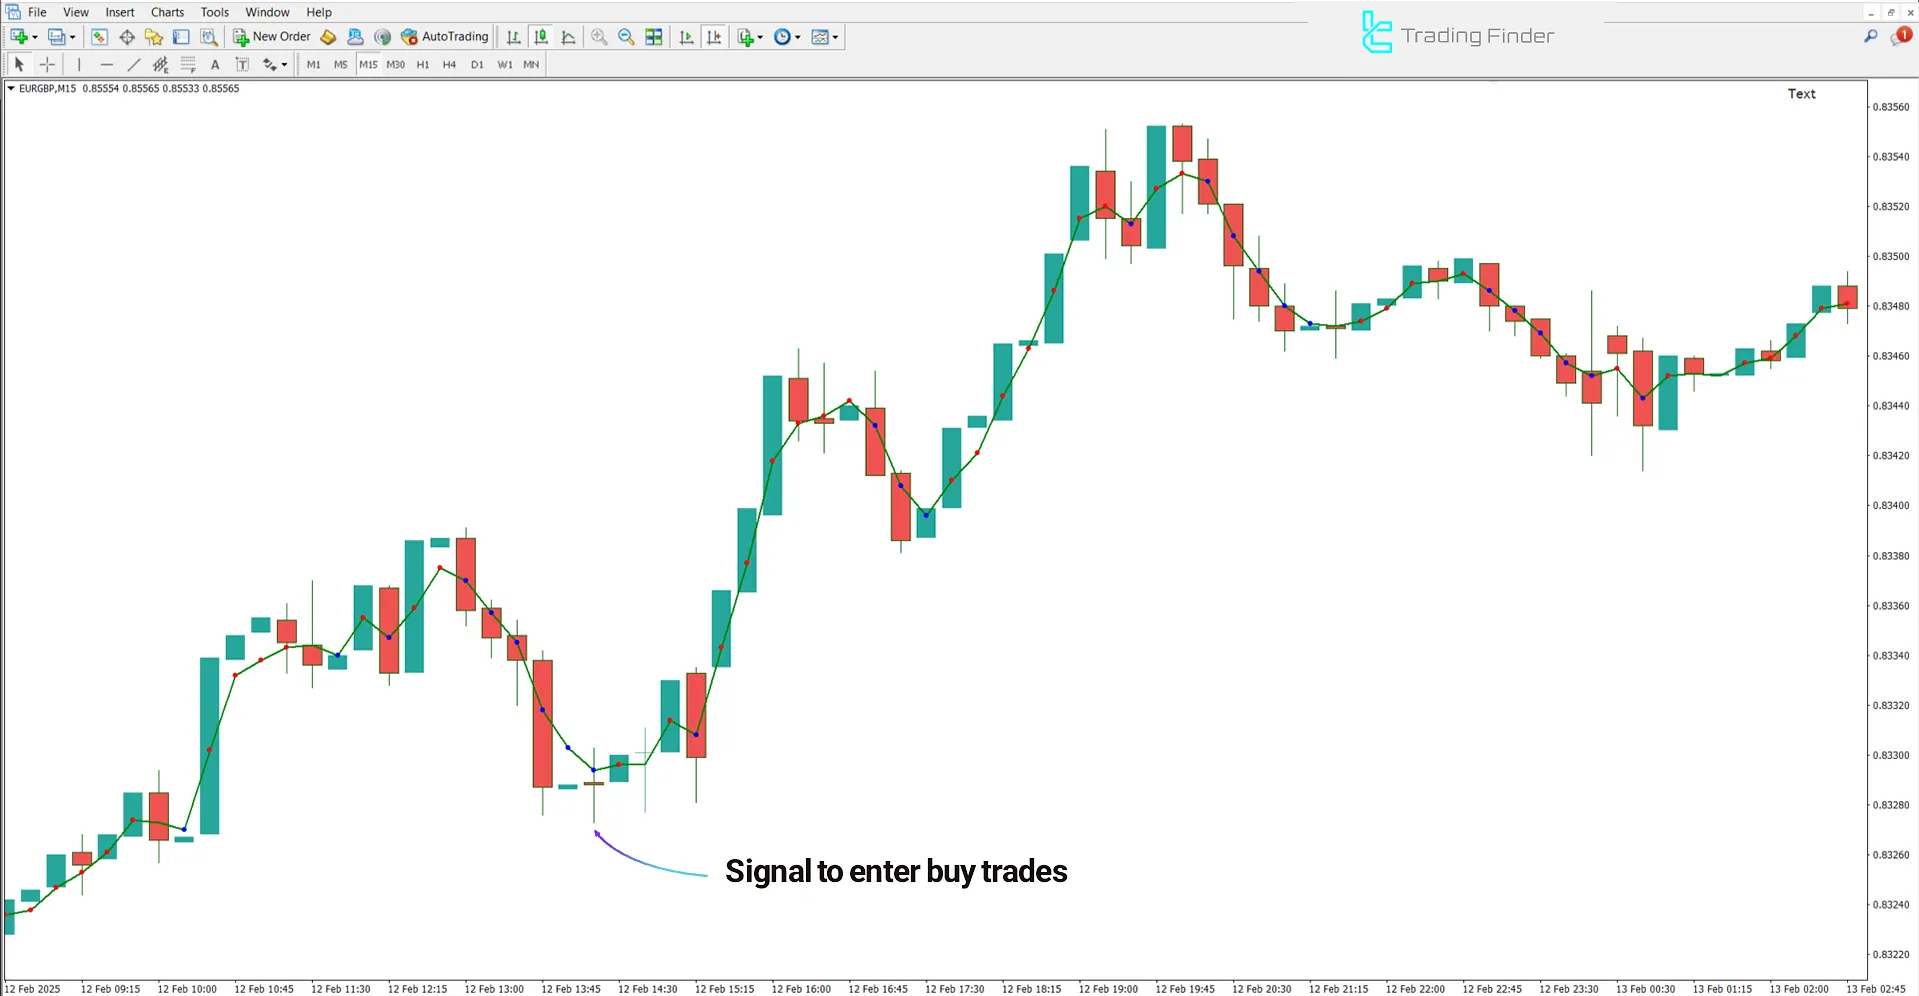
The chart below shows the EUR/GBP currency pair on a 15-minute timeframe. In this indicator, when the price breaks above the AMKA line from below, it indicates a potential trend reversal.
If green dots appear simultaneously, it confirms a buy signal.

Indicator in a Downtrend
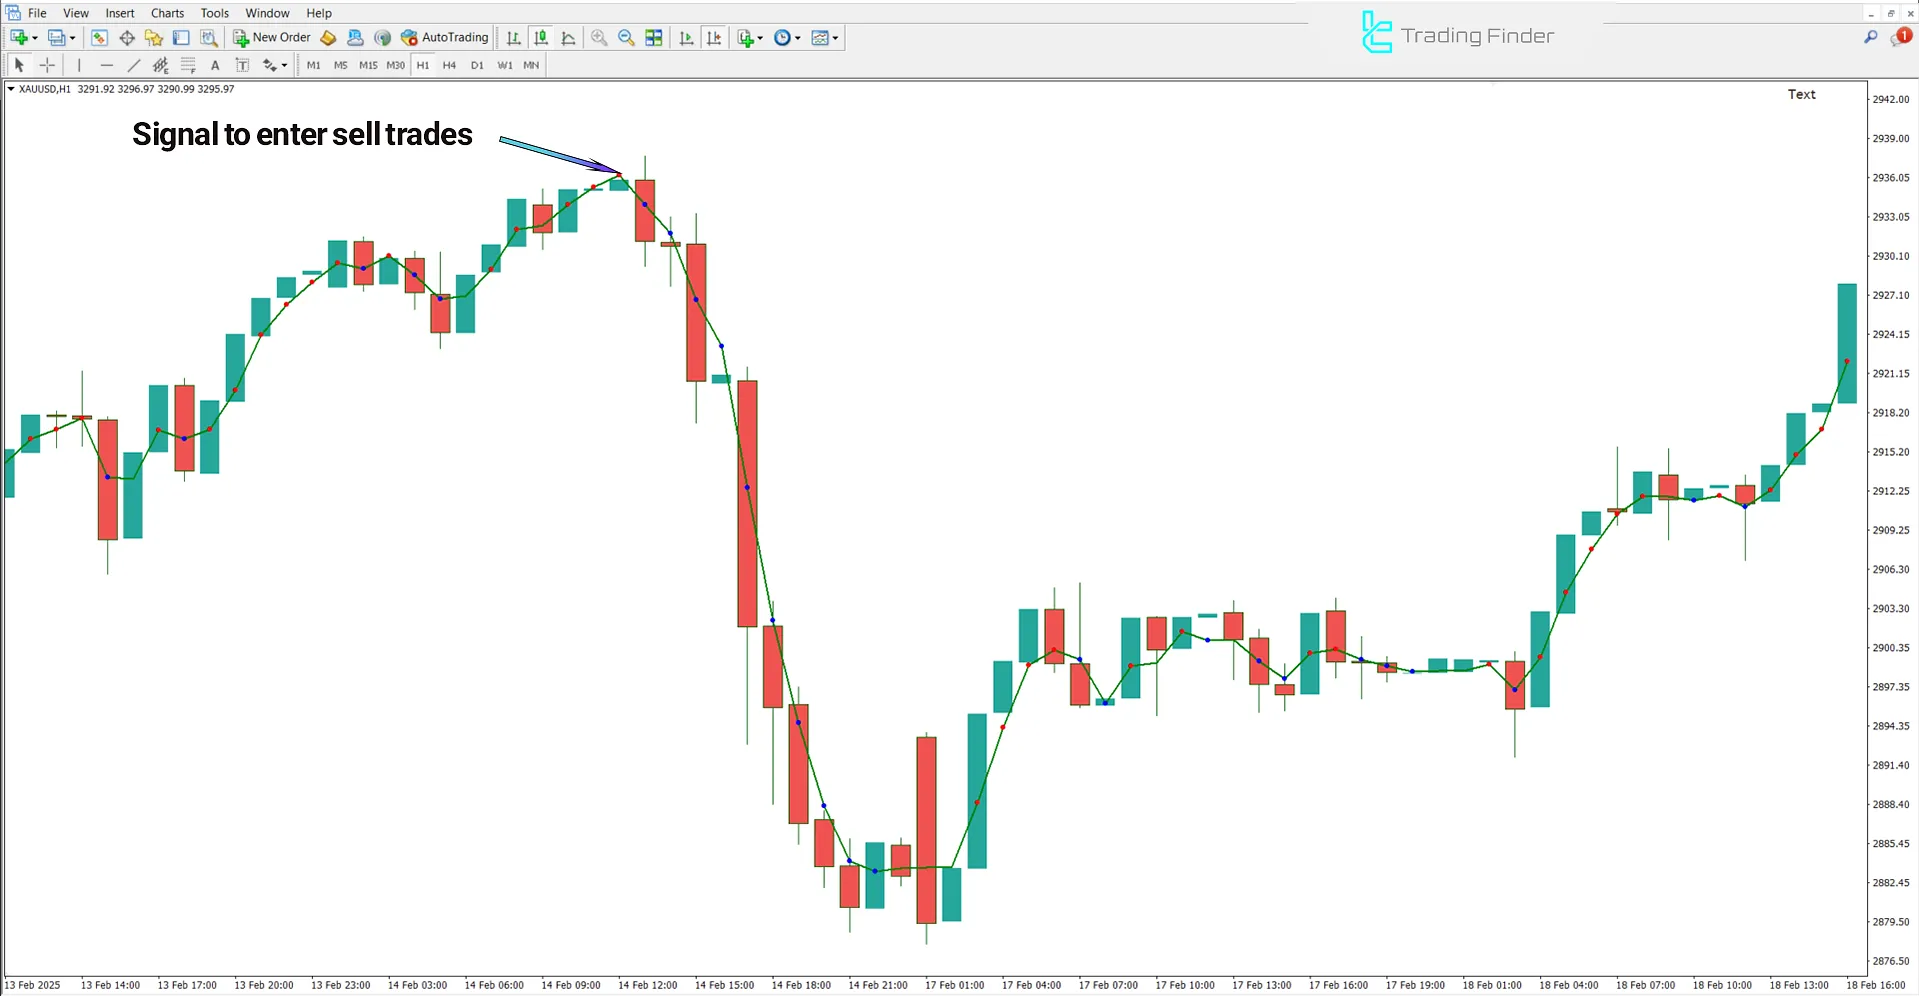
The image below shows the XAU/USD (Gold) index. When the price drops below the AMKA line and red dots appear on the line, this combination may signal the beginning of a downtrend, and the indicator triggers a sell signal.

AMKA Indicator Settings
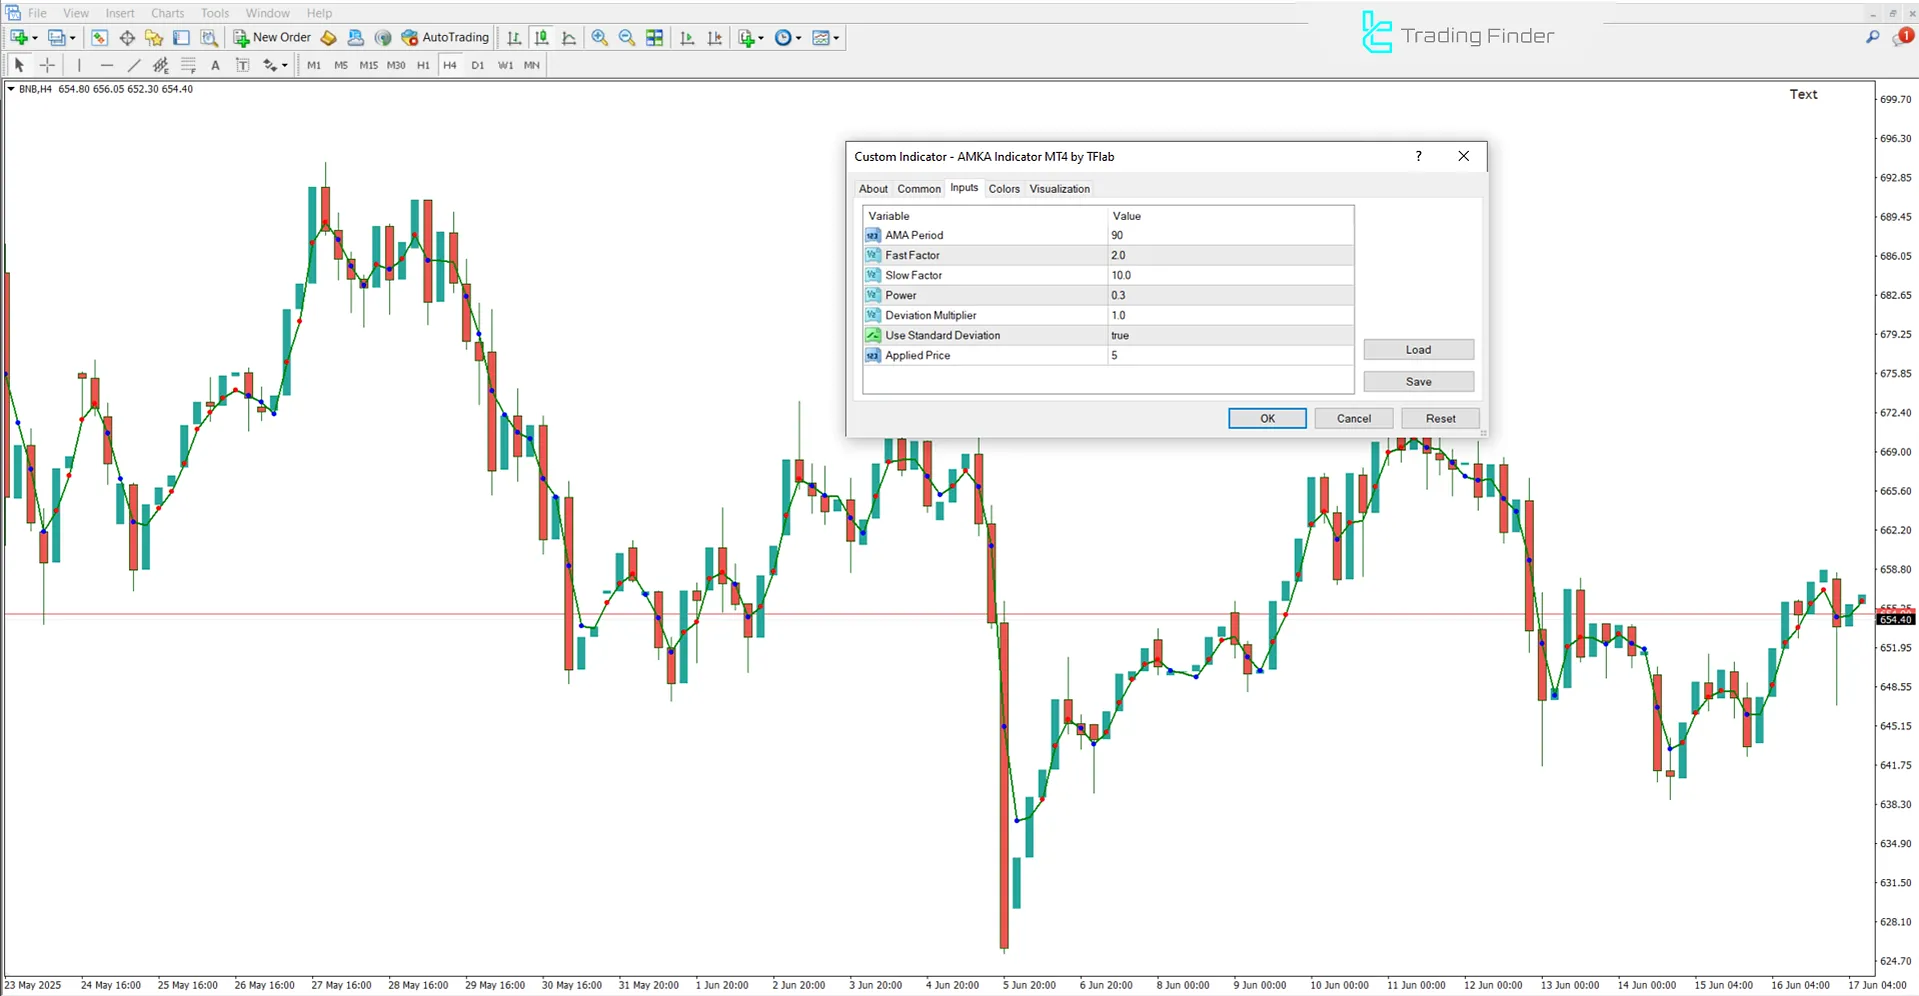
The image below displays the settings panel for the AMKA (Adaptive Moving Average Kauffman) indicator:

- AMA Period: AMA calculation period;
- Fast Factor: Fast smoothing factor;
- Slow Factor: Slow smoothing factor;
- Power: Smoothing power;
- Deviation Multiplier: Standard deviation multiplier;
- Use Standard Deviation: Toggle for using deviation;
- Applied Price: Base price used for calculation.
Conclusion
The AMKA indicator is an advanced moving average tool that utilizes the Kaufman algorithm to detect market trends accurately.
By displaying colored dots (blue and red) and indicating the price's position relative to its line, it provides clear entry and exit signals.
AMKA MT4 PDF
AMKA MT4 PDF
Click to download AMKA MT4 PDFHow can I use the AMKA indicator for entering a buy trade?
When the price crosses above the AMKA line and green dots appear, this indicates the beginning of a bullish trend and a buy opportunity.
Is the AMKA indicator suitable for all timeframes?
Yes, this trading tool can be used across all timeframes.


