![Volatility Switch Indicator for MetaTrader 4 Download – Free – [TFlab]](https://cdn.tradingfinder.com/image/403558/4-53-en-vsi-indicator-mt4-1.webp)
![Volatility Switch Indicator for MetaTrader 4 Download – Free – [TFlab] 0](https://cdn.tradingfinder.com/image/403558/4-53-en-vsi-indicator-mt4-1.webp)
![Volatility Switch Indicator for MetaTrader 4 Download – Free – [TFlab] 1](https://cdn.tradingfinder.com/image/403557/4-53-en-vsi-indicator-mt4-2.webp)
![Volatility Switch Indicator for MetaTrader 4 Download – Free – [TFlab] 2](https://cdn.tradingfinder.com/image/403556/4-53-en-vsi-indicator-mt4-3.webp)
![Volatility Switch Indicator for MetaTrader 4 Download – Free – [TFlab] 3](https://cdn.tradingfinder.com/image/403555/4-53-en-vsi-indicator-mt4-4.webp)
The Volatility Switch Indicator (VSI) is a useful tool on the MetaTrader 4 platform that analyzes market volatility over a specific timeframe.
This indicator normalizes values between 0 and 1 and applies a Simple Moving Average (SMA) with a 21-period, providing accurate information on market volatility intensity.
By displaying overbought and oversold zones as an oscillator, it helps traders identify key entry and exit points.
Volatility Switch Indicator Specifications
The table below summarizes the features of this indicator.
Indicator Categories: | Oscillators MT4 Indicators Volatility MT4 Indicators Trading Assist MT4 Indicators |
Platforms: | MetaTrader 4 Indicators |
Trading Skills: | Intermediate |
Indicator Types: | Reversal MT4 Indicators |
Timeframe: | Multi-Timeframe MT4 Indicators |
Trading Style: | Intraday MT4 Indicators |
Trading Instruments: | Forward Market MT4 Indicators Stock Market MT4 Indicators Cryptocurrency MT4 Indicators Forex MT4 Indicators |
Indicator at a Glance
The Volatility Switch Indicator (VSI) analyzes trading volume, allowing traders to detect sudden changes in market volume flow and use this information to predict future market movements.
Sudden spikes in trading volume indicate significant changes in trader behavior, which may signal the beginning of a new trend or the continuation of an existing one.
Indicator in a Bullish Trend
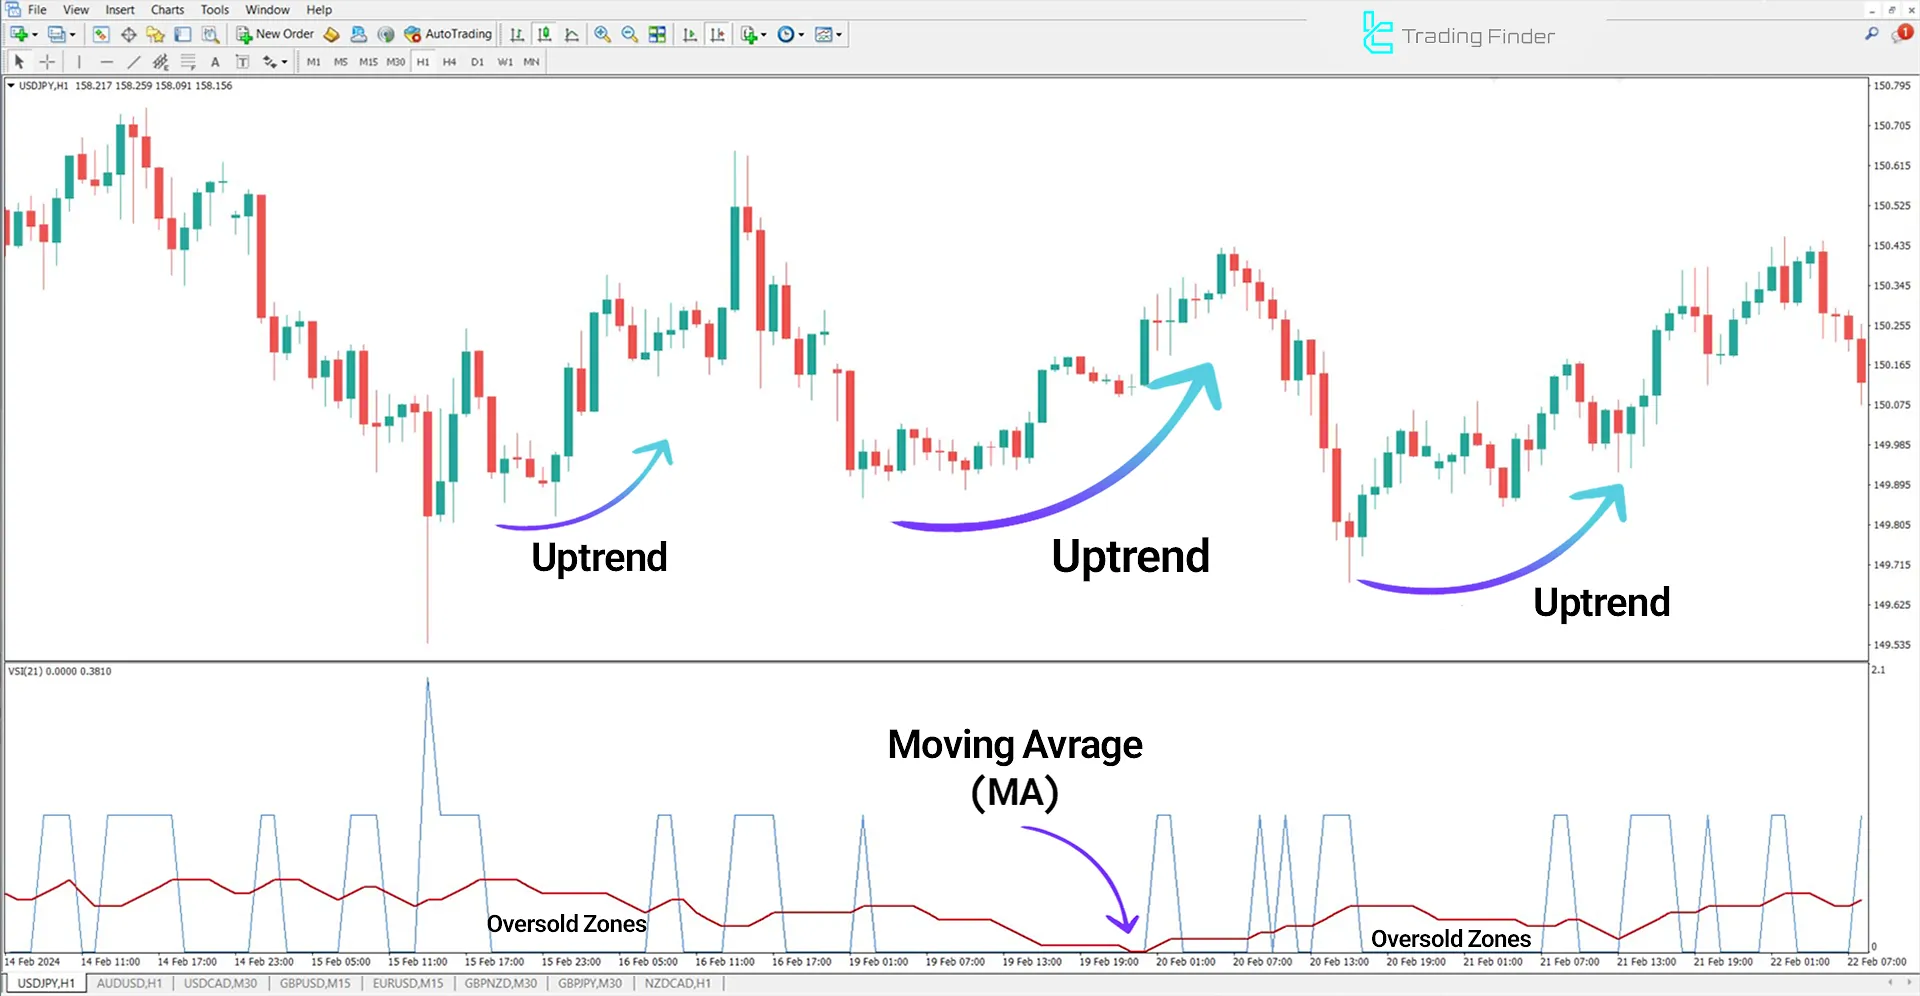
In the 1-hour price chart of USD/JPY, when the blue oscillator line reaches its lowest level and moves below the moving average, this condition is identified as an oversold zone.
In such cases, traders interpret this as a buy (Buy) signal, expecting a price increase and a potential rebound.

Indicator in a Bearish Trend
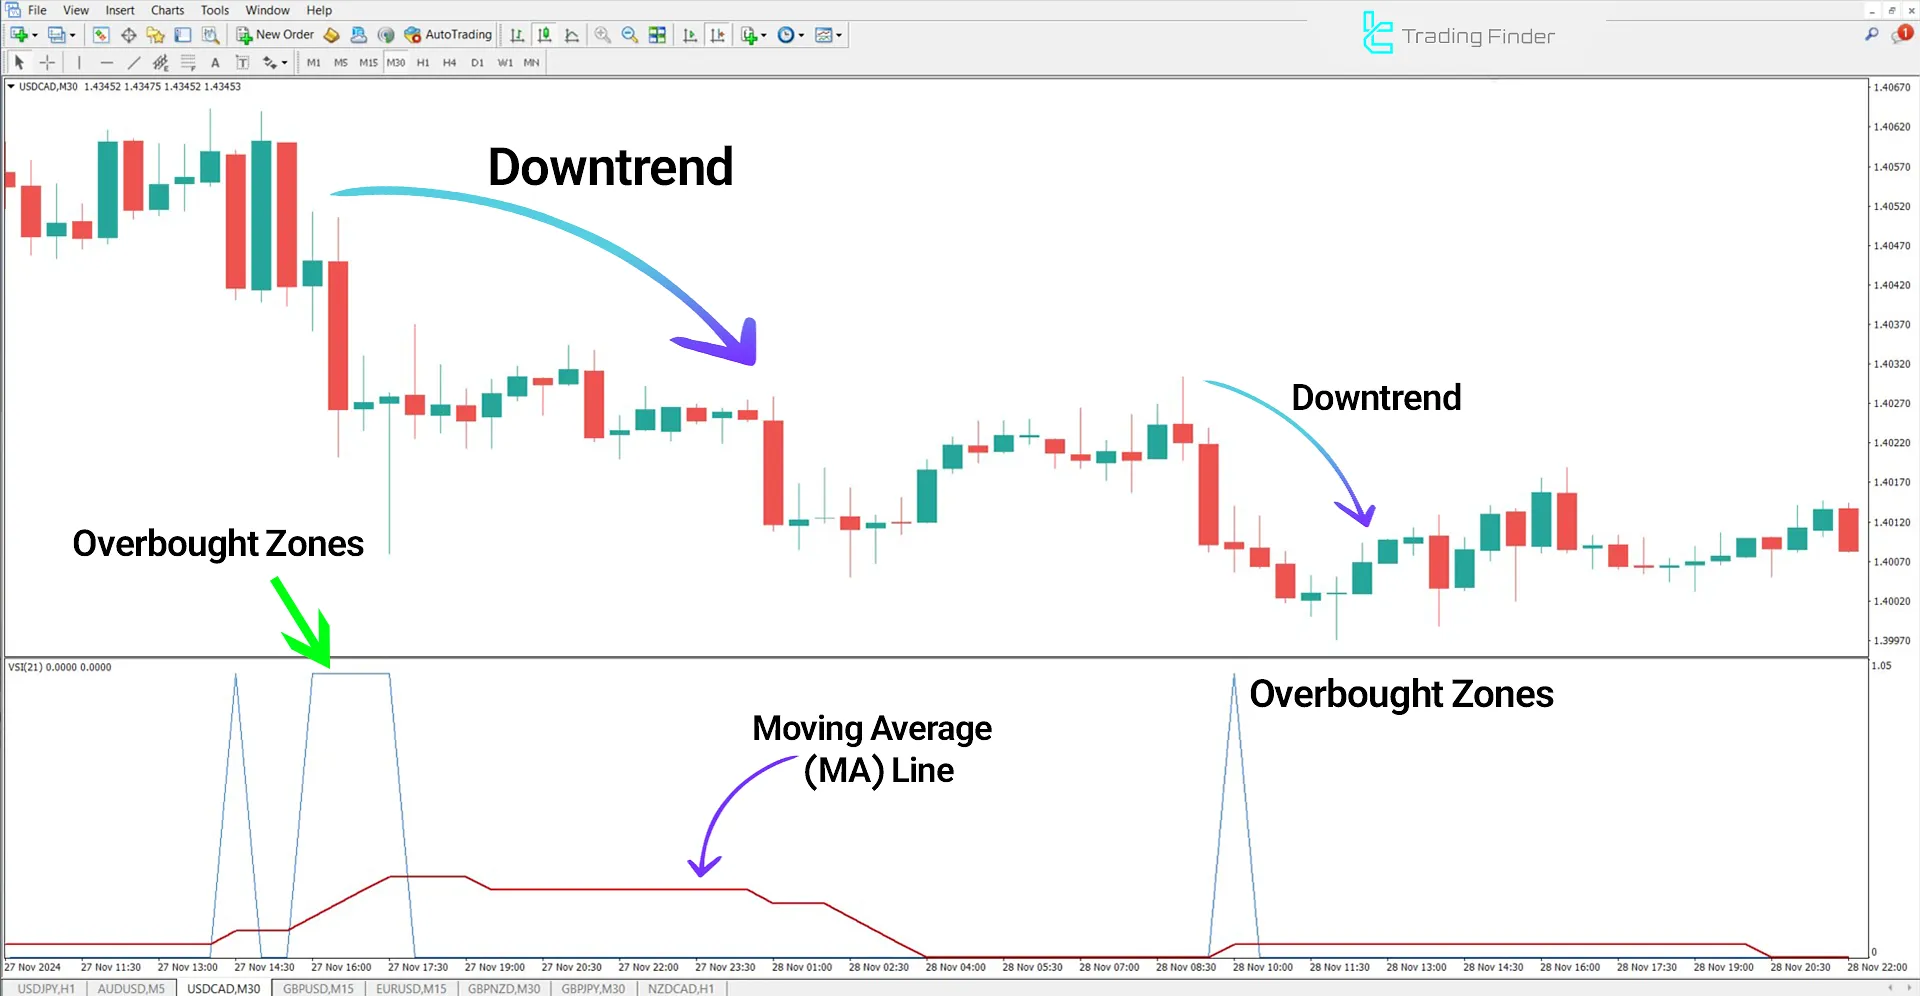
In a bearish trend, when the blue oscillator line crosses above the moving average and reaches the upper boundary of the oscillator window, this indicates an overbought zone, suggesting a potential trend reversal.
The closer the moving average is to the upper boundary, the more significant and reliable these zones become.

Indicator Settings
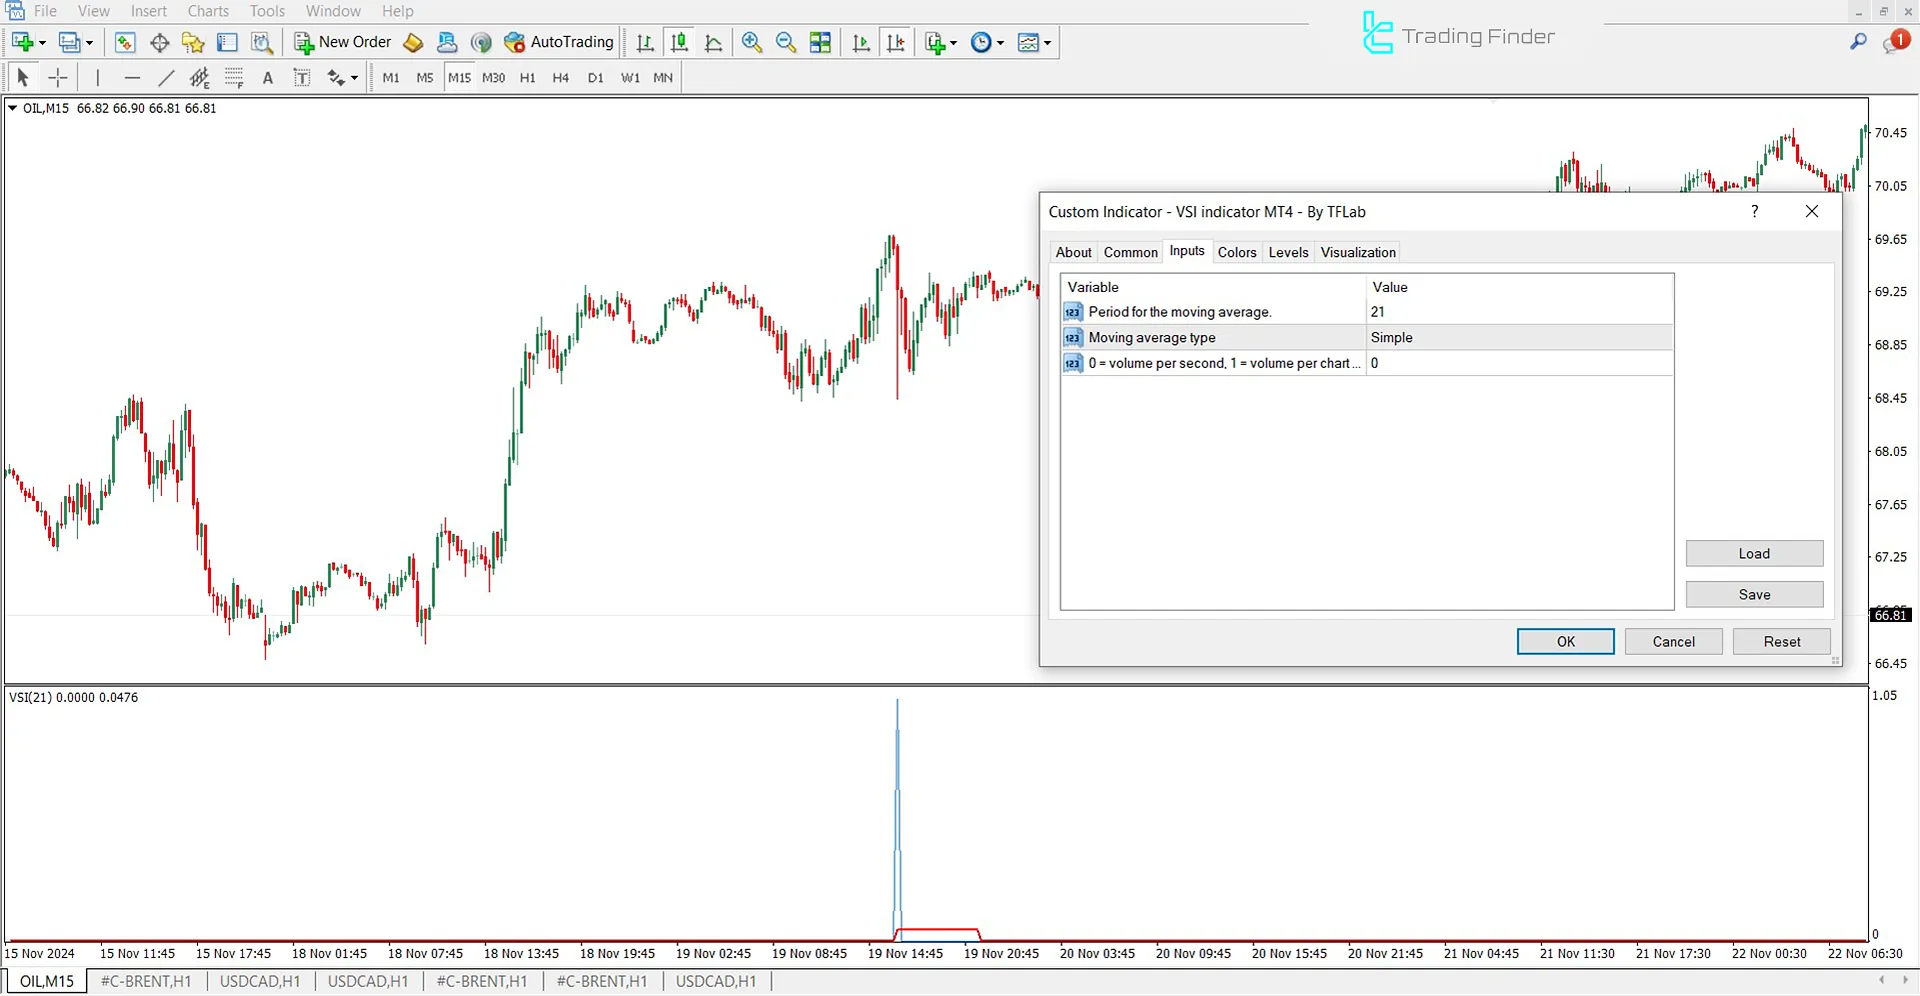
The image below displays the Volatility Switch Indicator settings:

- Period for the Moving Average: Defines the calculation period for the moving average.
- Moving Average Type: Specifies the type of moving average.
- Volume Per Second: Calculates the ratio of each period to the entered volume.
Conclusion
The Volatility Switch Indicator (VSI) is specifically designed to identify overbought and oversold zones.
This MetaTrader 4 oscillator combines market volatility data with moving averages to detect potential reversal points.
Volatility Switch MT4 PDF
Volatility Switch MT4 PDF
Click to download Volatility Switch MT4 PDFWhat is the Volatility Switch Indicator (VSI)?
The Volatility Switch Indicator (VSI) is a MetaTrader 4 tool that analyzes market volatility and identifies overbought (Overbought) and oversold (Oversold) zones.
Is the VSI indicator only applicable to Forex?
No, this indicator can be used in various markets, including Forex, stocks, and cryptocurrencies.


