![AMDX/XAMD Indicator ICT Style for MT5 Download - Free - [TFlab]](https://cdn.tradingfinder.com/image/248540/13-73-en-amdx-xamd-mt5-01.webp)
![AMDX/XAMD Indicator ICT Style for MT5 Download - Free - [TFlab] 0](https://cdn.tradingfinder.com/image/248540/13-73-en-amdx-xamd-mt5-01.webp)
![AMDX/XAMD Indicator ICT Style for MT5 Download - Free - [TFlab] 1](https://cdn.tradingfinder.com/image/248539/13-73-en-amdx-xamd-mt5-02.webp)
![AMDX/XAMD Indicator ICT Style for MT5 Download - Free - [TFlab] 2](https://cdn.tradingfinder.com/image/248541/13-73-en-amdx-xamd-mt5-03.webp)
![AMDX/XAMD Indicator ICT Style for MT5 Download - Free - [TFlab] 3](https://cdn.tradingfinder.com/image/248542/13-73-en-amdx-xamd-mt5-04.webp)
The "AMDX/XAMD" Indicator is one of the indicators developed based on the ICT trading style that facilitates the identification of potential trend reversals in the market.
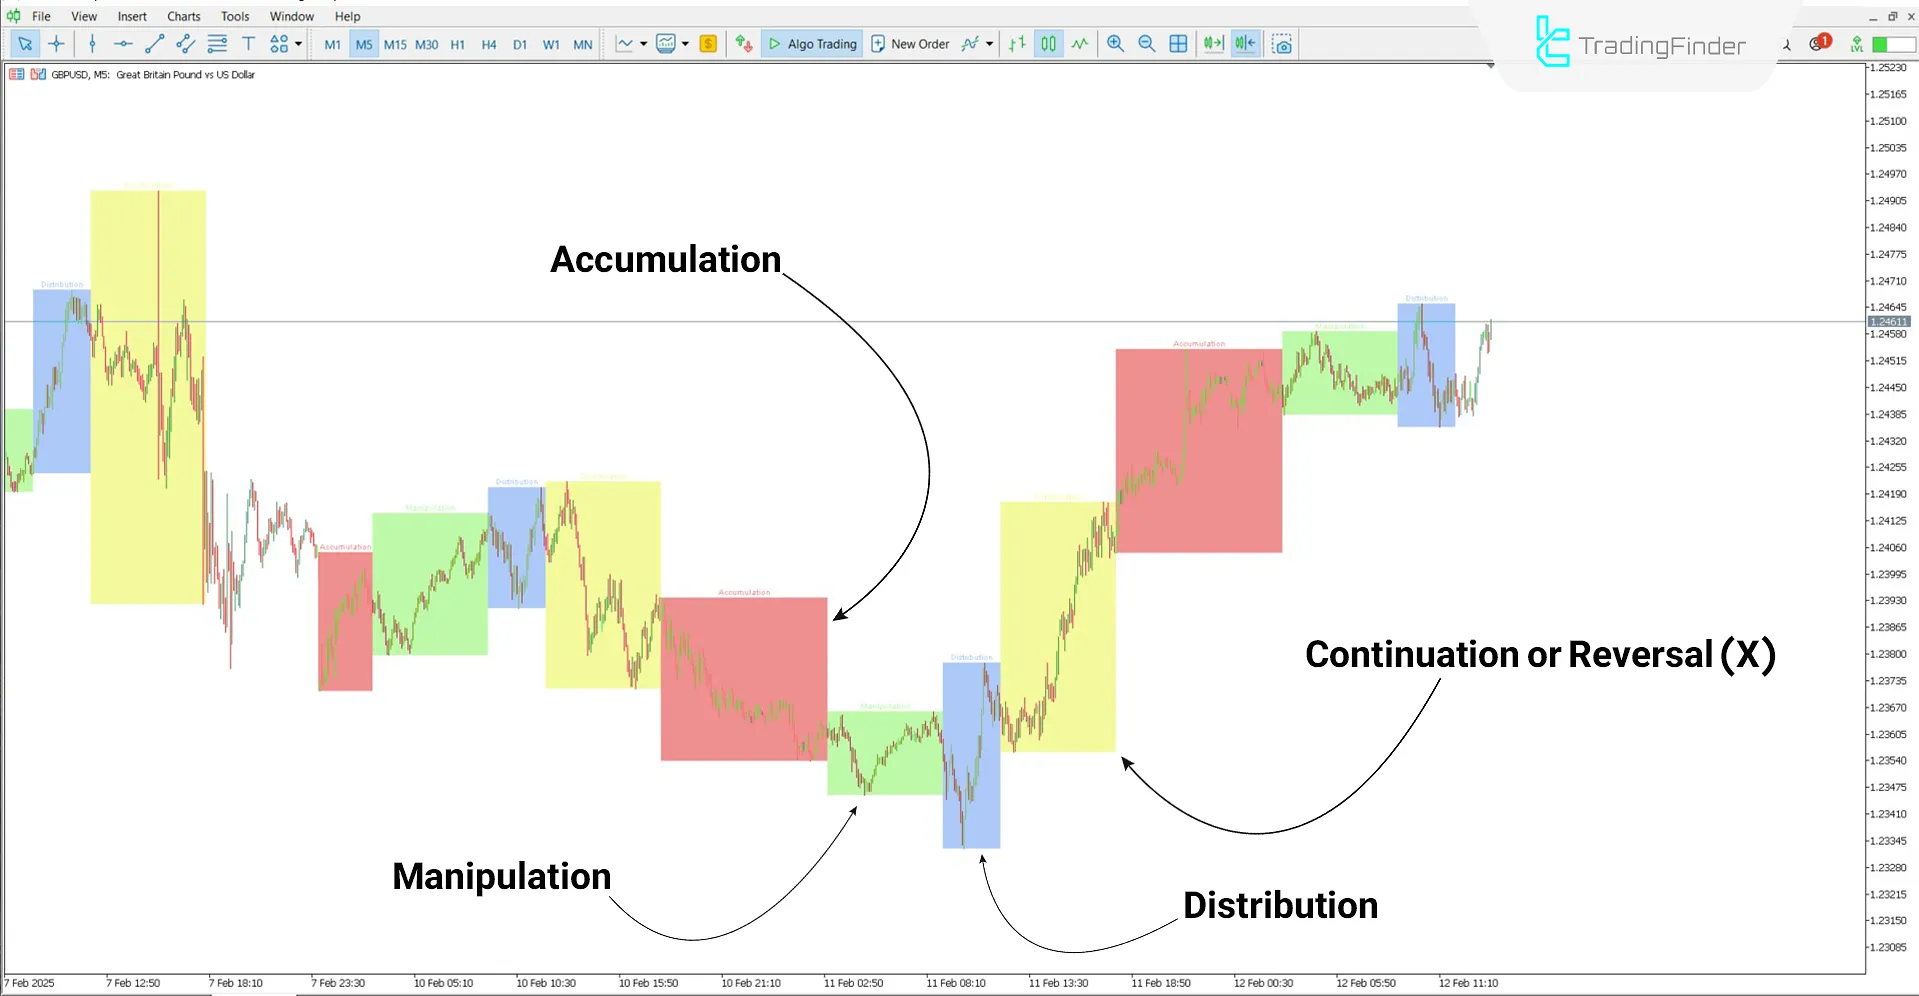
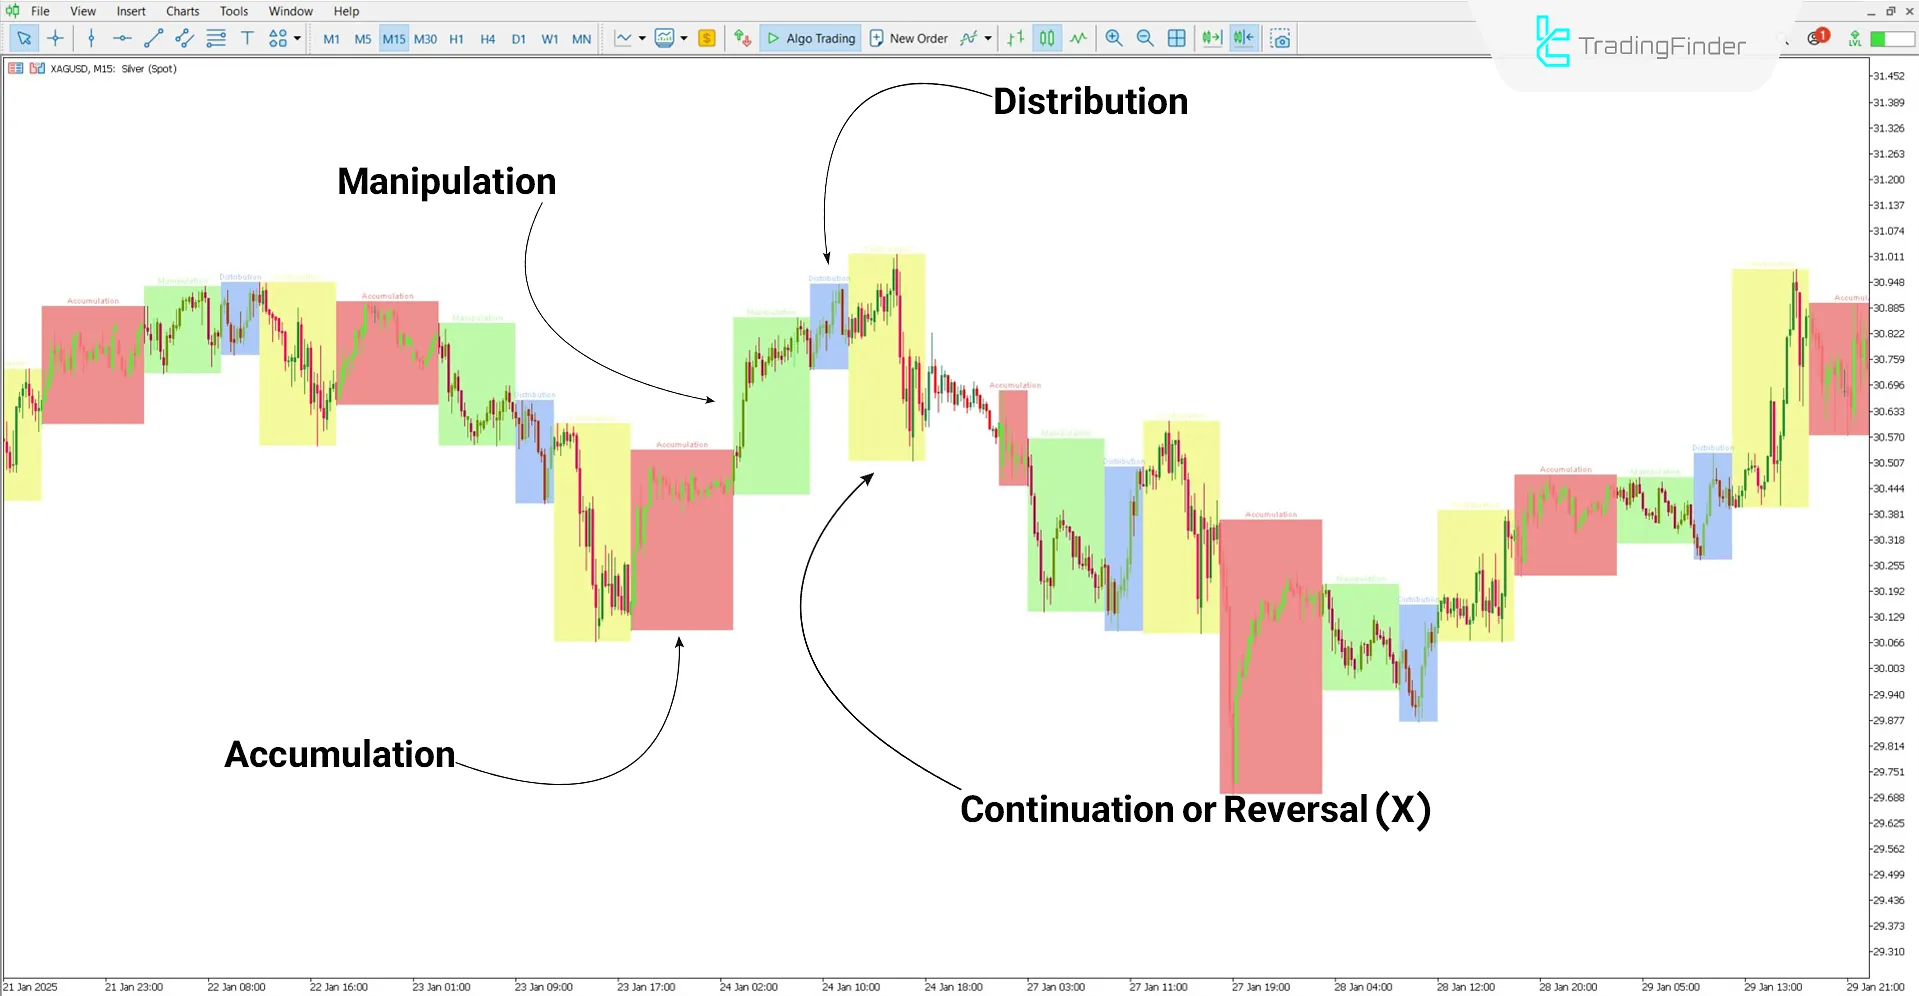
This liquidity indicator developed based on the power of three Strategy, this indicator uses colored boxes to categorize price movements into three phases Accumulation, Manipulation, and Distribution.
In addition to the three mentioned phases, there is a fourth phase called Continuation or Reversal (X), which distinguishes the AMDX/XAMD Cycle Indicator from the AMD ICT Indicator in MetaTrader 5 Platform.
AMDX/XAMD Indicator Specifications Table
The table below outlines the specifications of the AMDX/XAMD Cycle Indicator.
Indicator Categories: | Smart Money MT5 Indicators Liquidity Indicators MT5 Indicators ICT MT5 Indicators |
Platforms: | MetaTrader 5 Indicators |
Trading Skills: | Advanced |
Indicator Types: | Reversal MT5 Indicators |
Timeframe: | Multi-Timeframe MT5 Indicators |
Trading Style: | Swing Trading MT5 Indicators Intraday MT5 Indicators Scalper MT5 Indicators Day Trading MT5 Indicators |
Trading Instruments: | Forex MT5 Indicators Crypto MT5 Indicators Stock MT5 Indicators Commodity MT5 Indicators |
Indicator at a Glance
The XAMD/AMDX Time Cycle Indicator uses a yellow box to display the Continuation or Reversal (X) phase. This zone can form at the start or end of cycles and, depending on market trends, can act as either a continuation or reversal area. Price movement conditions determine the impact of this phase on trading decisions.
Uptrend
In the 5-minute GBP/USD chart analysis, the trend in the Accumulation and Manipulation phases tends to decline towards lower price levels.
The Distribution phase causes price growth, and the X phase continues the price movement. In the example below, the X phase forms at the end of other phases, showing the AMDX structure.

Downtrend
The 15-minute XAG/USD chart shows that the price tends to rise during the Manipulation (green box) and Distribution (blue box) phases. In the example below, the X phase effectively acts as a reversal zone.

XAMD/AMDX Cycles Indicator Settings
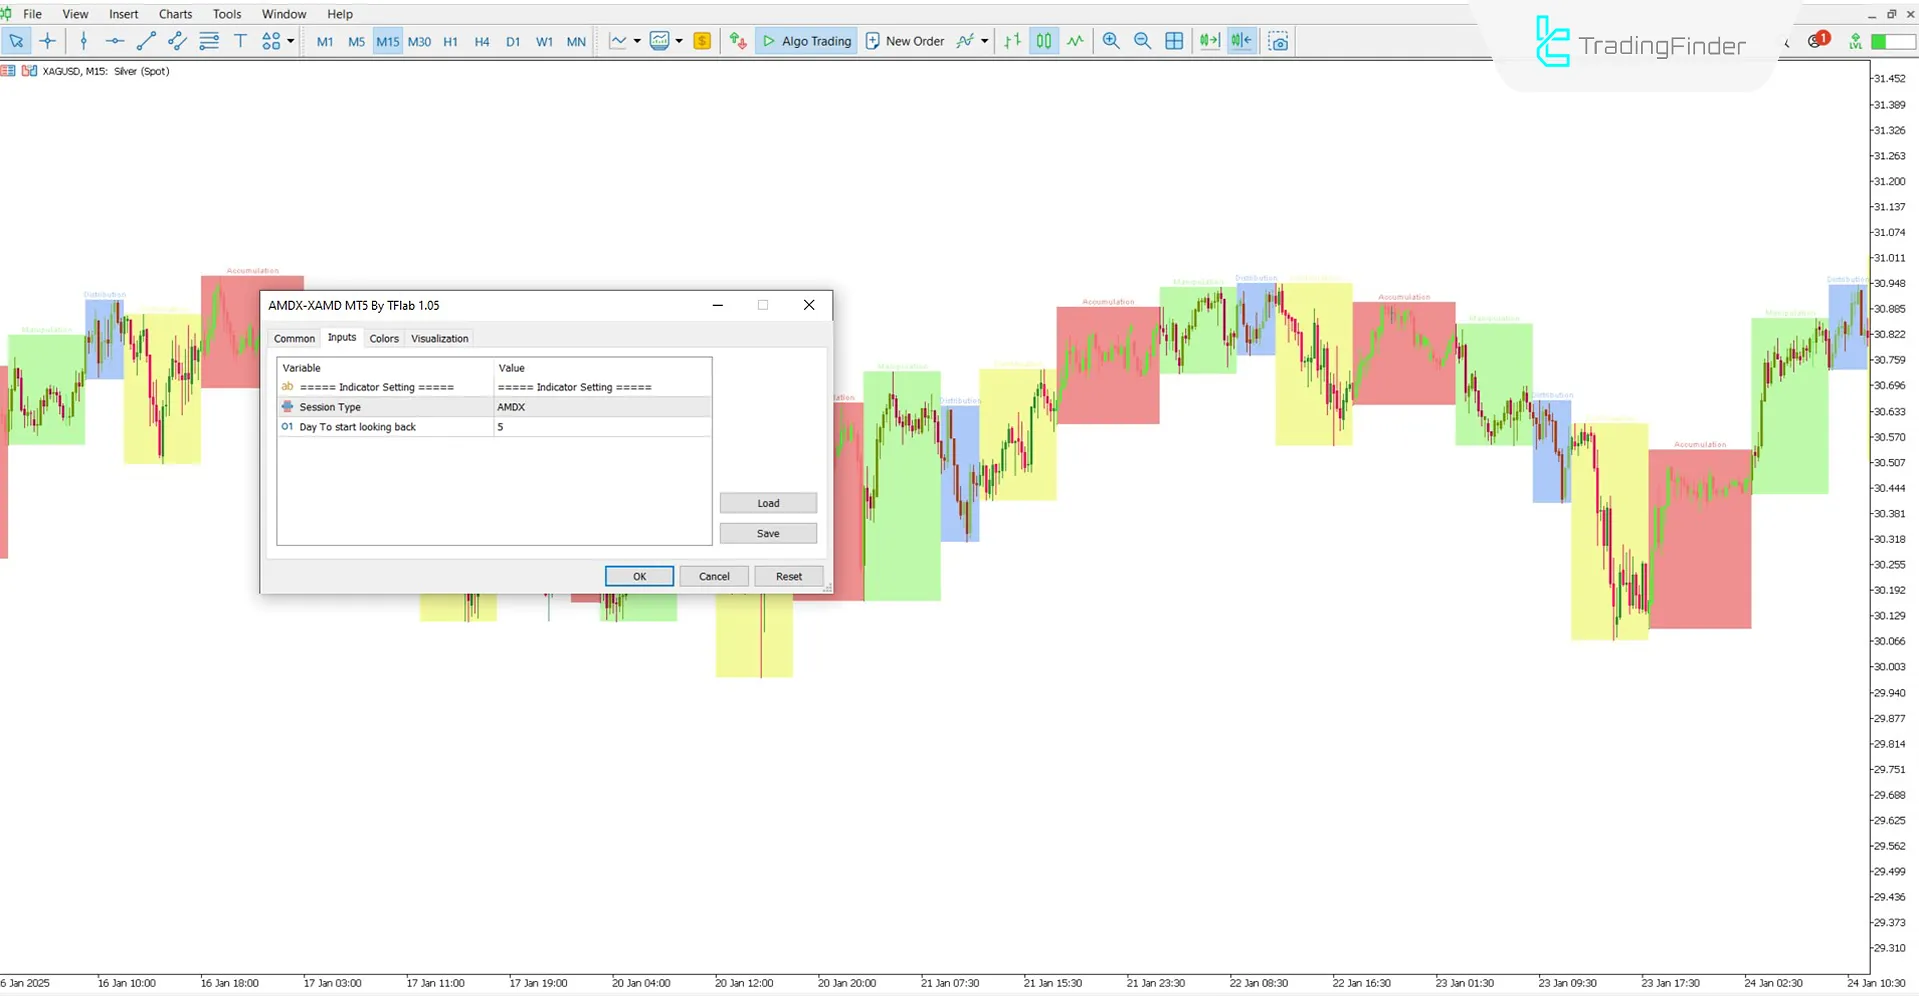
The settings of the XAMD/AMDX Indicator are divided into two main categories:

- Session Type: Choose between "AMDX" and "XAMD" options
- Day to start looking back: Set the number of days for indicator calculations
Conclusion
The AMDX/XAMD Cycle Indicator is an ICT indicator that simplifies price behavior analysis and future market movement predictions by segmenting price trends using colored boxes.
This trading tool includes three phases Accumulation (Red Zone), Distribution (Blue Zone), and Manipulation (Green Zone). Compared to the AMD ICT Indicator, it also displays an additional phase called Continuation or Reversal (X).
AMDX/XAMD ICT MT5 PDF
AMDX/XAMD ICT MT5 PDF
Click to download AMDX/XAMD ICT MT5 PDFWhat is the difference between AMDX and AMD indicators?
The XAMD/AMDX Cycle Indicator segments trading sessions into Accumulation, Manipulation, and Distribution and displays the Continuation or Reversal (X) phase.
Is the AMDX Indicator applicable for crypto market analysis?
Yes, the AMDX/XAMD Time Cycle Indicator is suitable for all markets.


