


![Keltner Channels Indicator for MT5 – [TradingFinder] - Download](https://cdn.tradingfinder.com/image/460028/2-99-en-kletner-channels-mt5-1.webp)
![Keltner Channels Indicator for MT5 – [TradingFinder] - Download 1](https://cdn.tradingfinder.com/image/460021/2-99-en-kletner-channels-mt5-2.webp)
![Keltner Channels Indicator for MT5 – [TradingFinder] - Download 2](https://cdn.tradingfinder.com/image/460027/2-99-en-kletner-channels-mt5-3.webp)
![Keltner Channels Indicator for MT5 – [TradingFinder] - Download 3](https://cdn.tradingfinder.com/image/460022/2-99-en-kletner-channels-mt5-4.webp)
The Keltner Channels Trading Indicator is a technical analysis tool used for trend analysis, measuring market volatility, and identifying optimal entry and exit points.
It consists of three lines similar to Bollinger Bands, but it significantly differs in terms of calculation method, interpretation, and signal generation.
Keltner Channels Trading Indicator Table
The features of the Keltner Channels Trading Indicator are presented in the following table.
Indicator Categories: | Volatility MT5 Indicators Currency Strength MT5 Indicators Trading Assist MT5 Indicators |
Platforms: | MetaTrader 5 Indicators |
Trading Skills: | Intermediate |
Indicator Types: | Reversal MT5 Indicators |
Timeframe: | Multi-Timeframe MT5 Indicators |
Trading Style: | Intraday MT5 Indicators |
Trading Instruments: | Forex MT5 Indicators Crypto MT5 Indicators Stock MT5 Indicators |
Indicator Overview
TheKeltner Channels Trading Indicator is used to identify trends and measure market volatility. Its structure is based on a central Simple Moving Average (SMA) and two outer bands calculated using Average True Range (ATR).
This indicator uses the moving average to determine trend direction, while the ATR defines the channel width based on market volatility, such that:
- In highly volatile markets, the bands expand;
- In low-volatility periods, the channels appear more compressed.
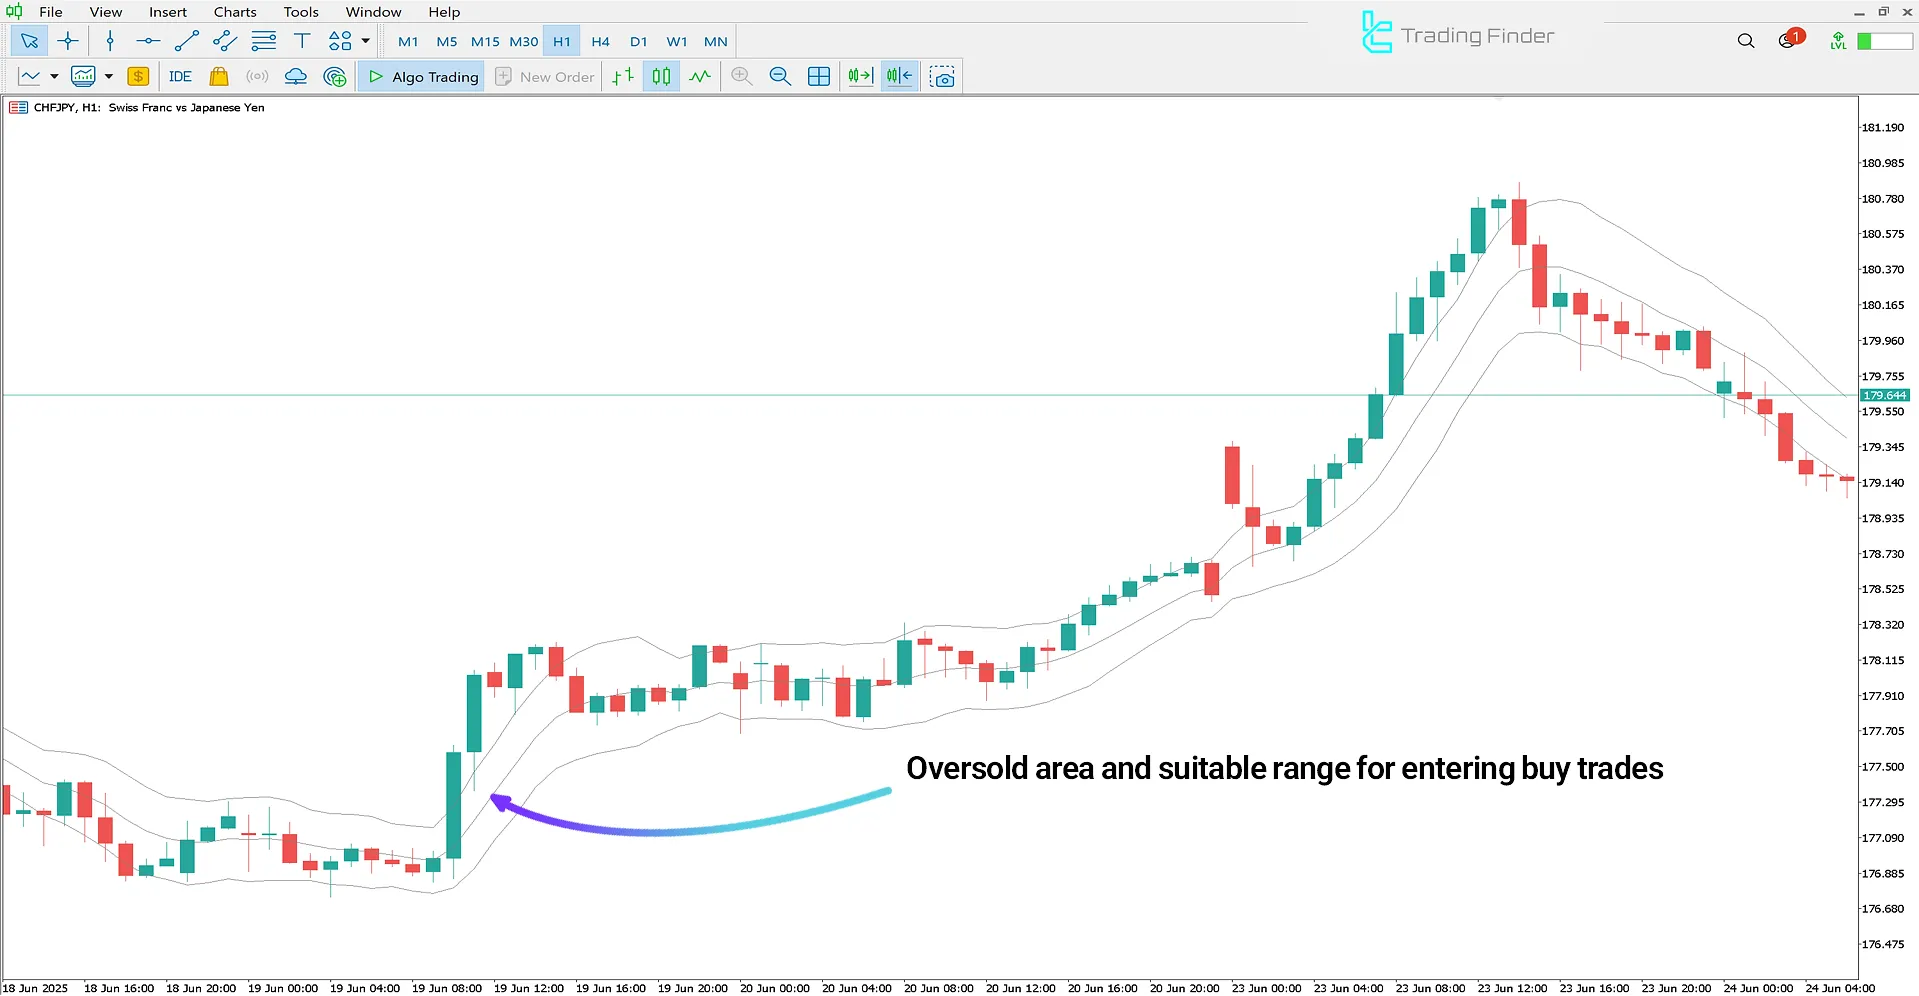
Indicator in an Uptrend
The image below shows the CHF/JPY currency pair on a 1-hour chart. A bullish reversal signal is triggered when the price drops below the lower band and then re-enter the channel structure.
If this return is also accompanied by the end of an oversold condition, a potential uptrend forms, providing a buy entry opportunity.
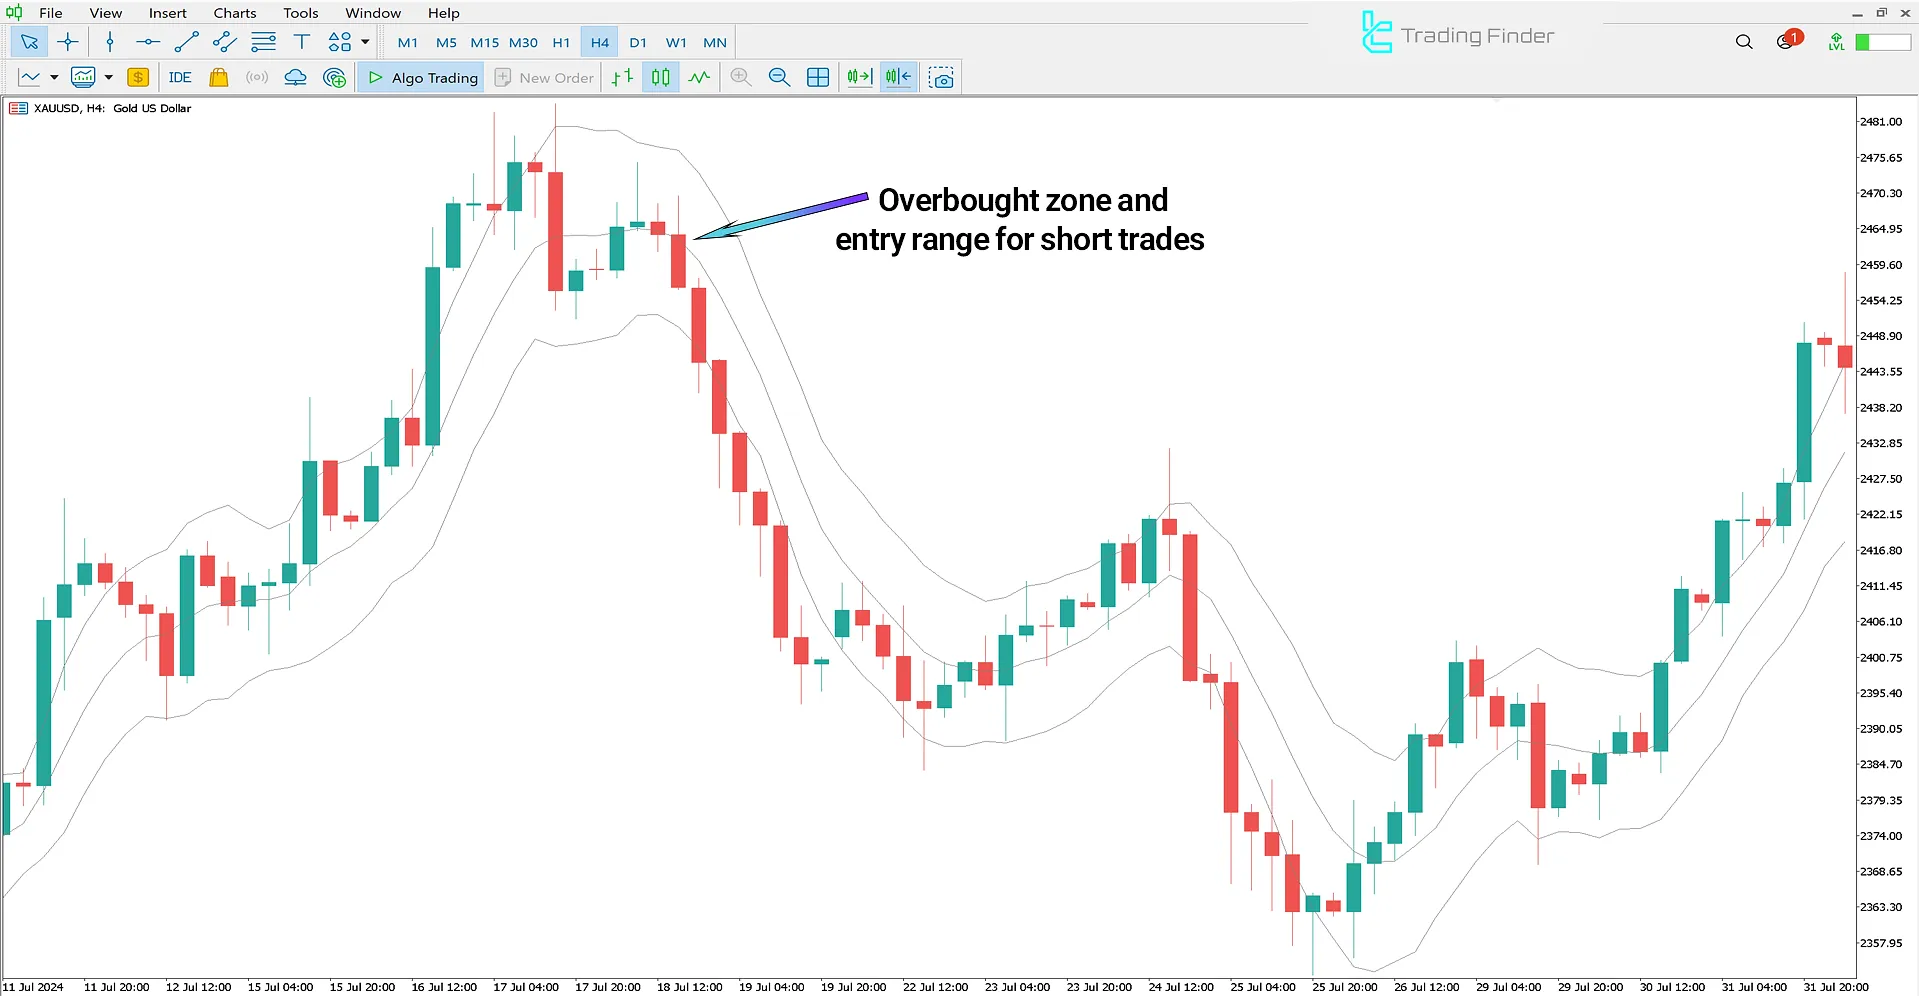
Indicator in a Downtrend
The chart below shows Gold (XAU/USD) in a 4-hour timeframe. When the price returns to the channel after breaching the upper band, it often indicates weakening bullish momentum and a potential trend reversal to the downside.
Such conditions create an opportunity for short positions.
Keltner Channels Trading Indicator Settings
The image below shows the settings panel for the Keltner Channels Trading Indicator:
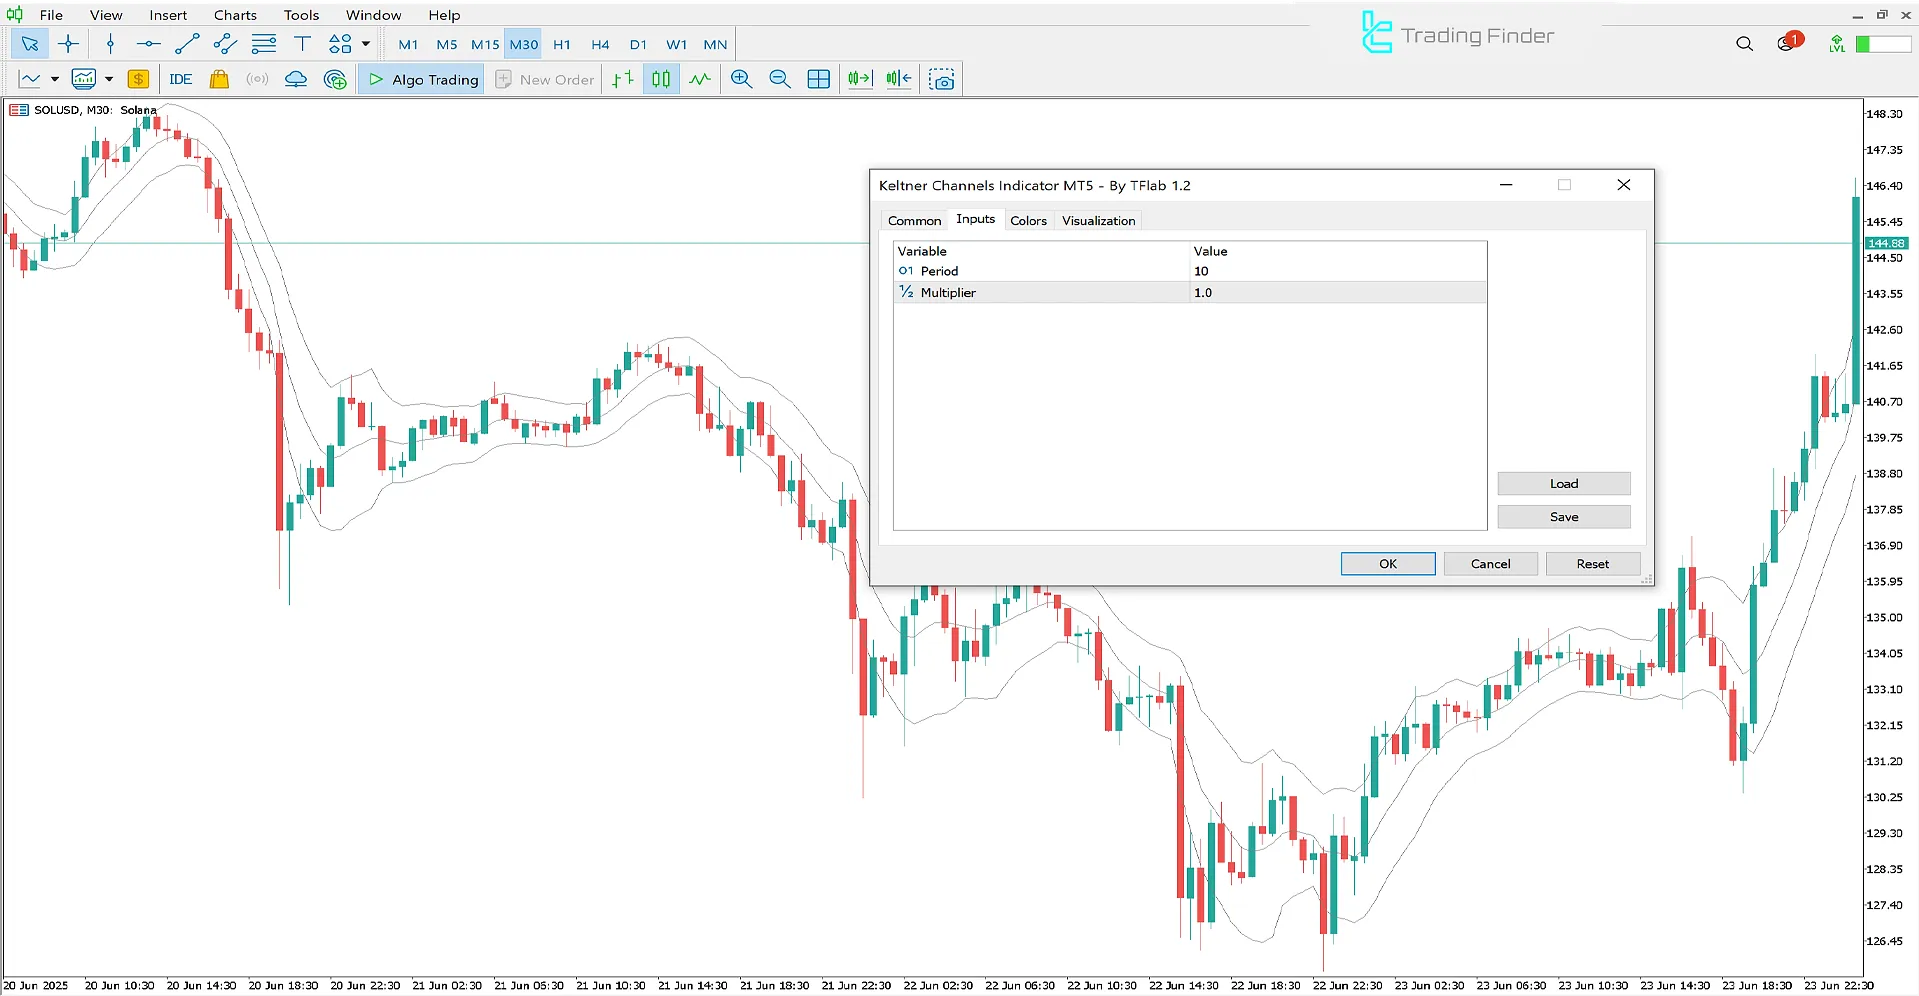
- Period: Calculation period;
- Multiplier: ATR multiplier.
Conclusion
A price returning to the inside of the Keltner Channel after breaching the upper or lower band is often interpreted as a potential market trend reversal.
- Near the upper band (overbought zones), these signals typically indicate selling opportunities;
- Around the lower band (oversold zones), they can be considered entry points.
Keltner Channels MT5 PDF
Keltner Channels MT5 PDF
Click to download Keltner Channels MT5 PDFWhat is the primary use of the Keltner Channels Indicator?
The primary purpose of this indicator is to detect price trends, assess market volatility, and identify overbought and oversold areas for precise entry and exit points.
How does the Keltner Channels Indicator reflect market volatility?
This trading tool reflects volatility through the width of its bands, which dynamically adapt to changes in market conditions.


