


TradingView
MetaTrader4
MetaTrader5
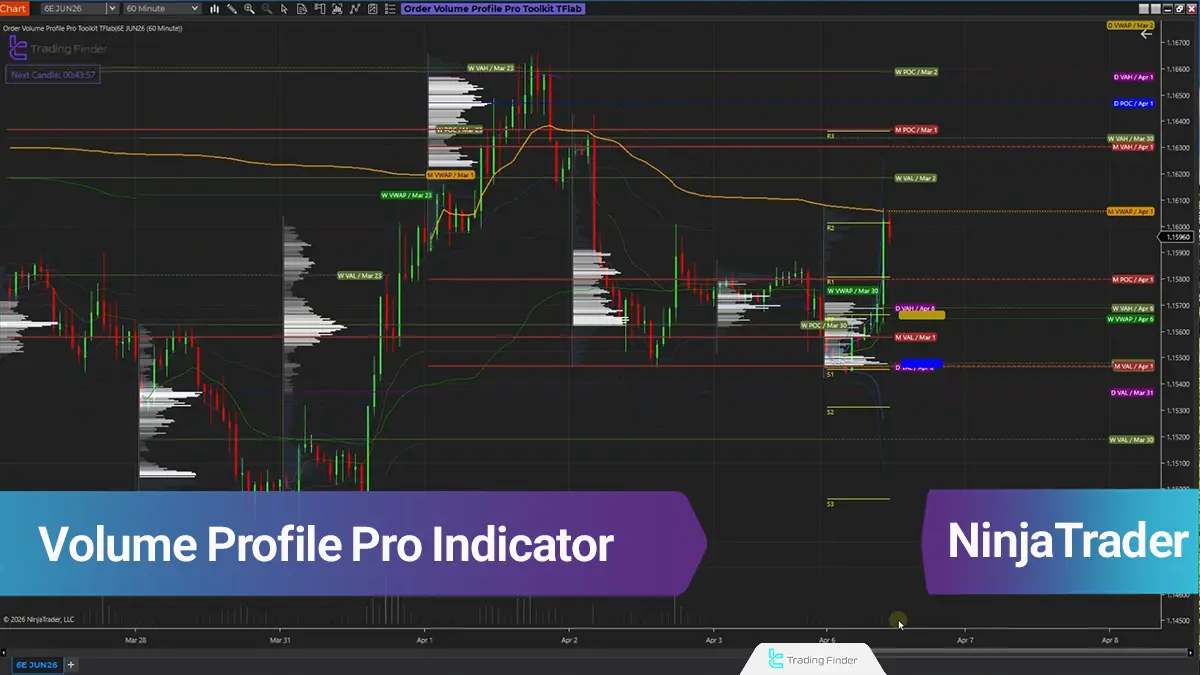
The TradingFinder Volume Profile Pro indicator for NinjaTrader provides an integrated set of analytical tools based on order flow, volume distribution, delta, VWAP, pivots, and market structure across different sessions directly on the chart.
This trading tool processes raw market data through multiple layers, allowing traders to identify high-volume zones, order balance and imbalance, value areas, and key price levels with greater precision.
Order Volume Profile Pro TradingFinder Indicator Table
The general specifications of the TradingFinder Order Volume Profile Pro indicator are presented in the table below:
Category | Order Flow - Volume - Market Profile - Trading Tool |
Platform | NinjaTrader 8 |
Skill Level | Advanced |
Indicator Type | Analytical - Structural - Volume-Based |
Timeframe | Multi Timeframe |
Trading Style | Intraday Trading - Scalping - Session Trading |
Trading Market | Forex, Indices, Metals, Commodities |
Volume Profile Pro TradingFinder Indicator at a Glance
The signals and structures of the TradingFinder Volume Profile Pro indicator are displayed on the chart through multiple layers.
These layers include intrabar volume display, Candle Delta, Volume Area, daily, weekly, and monthly volume profiles, VWAP lines, pivots across different timeframes, the Initial Balance range, and the order flow information panel.
With this tool, traders can access multiple layers of market data simultaneously without leaving the chart.
The combination of these components creates a structure that reveals not only the current price position, but also the quality of the market’s reaction to key levels.
This analytical structure provides the following capabilities to users:
- Displaying volume inside each candle and high-activity price levels;
- Filtering volume based on specific thresholds;
- Identifying Volume Area and POC on candle, daily, weekly, and monthly scales;
- Displaying daily, weekly, and monthly VWAP;
- Plotting daily, weekly, and monthly pivots;
- Detecting Initial Balance as an important session-opening area;
- Using the lower panel to view delta, volume, buying and selling activity, Commodity Delta, and the Fair Value Index.
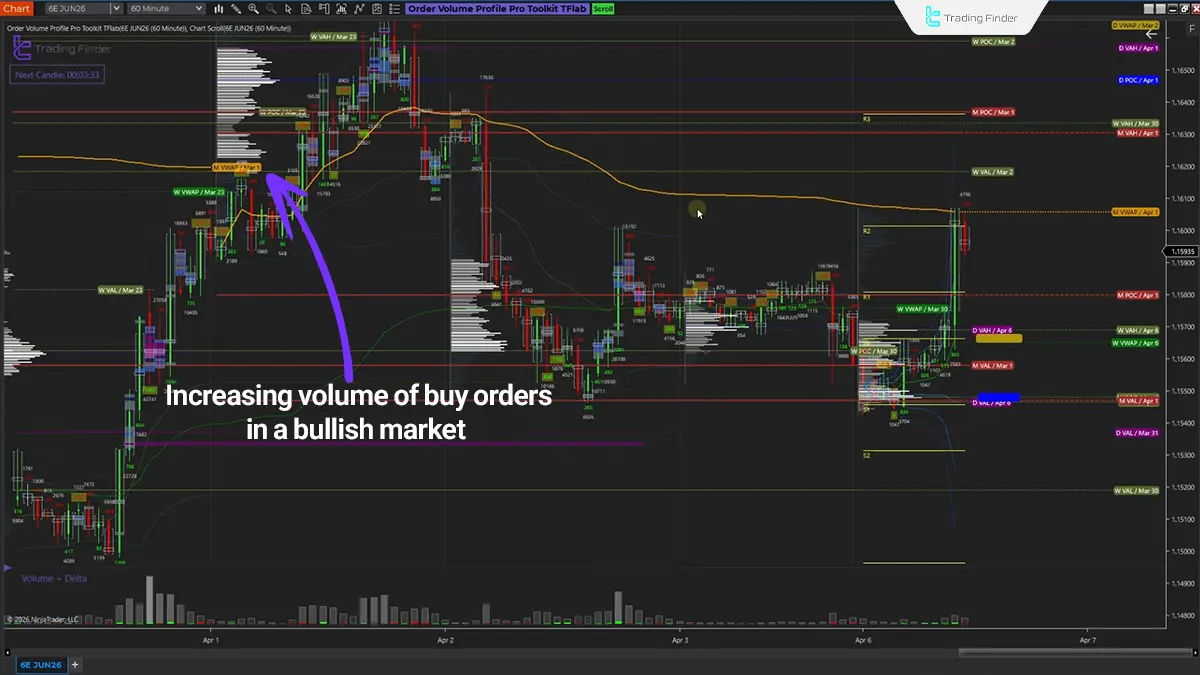
Indicator in a Bullish Trend
In an uptrend, this indicator allows traders to precisely evaluate the order volume recorded during the formation of each candle.
This feature improves the detection of thePoint of Control (POC) and the amount of orders recorded across price ranges, making it easier for traders to identify fair value, market maker activity, and market liquidity.
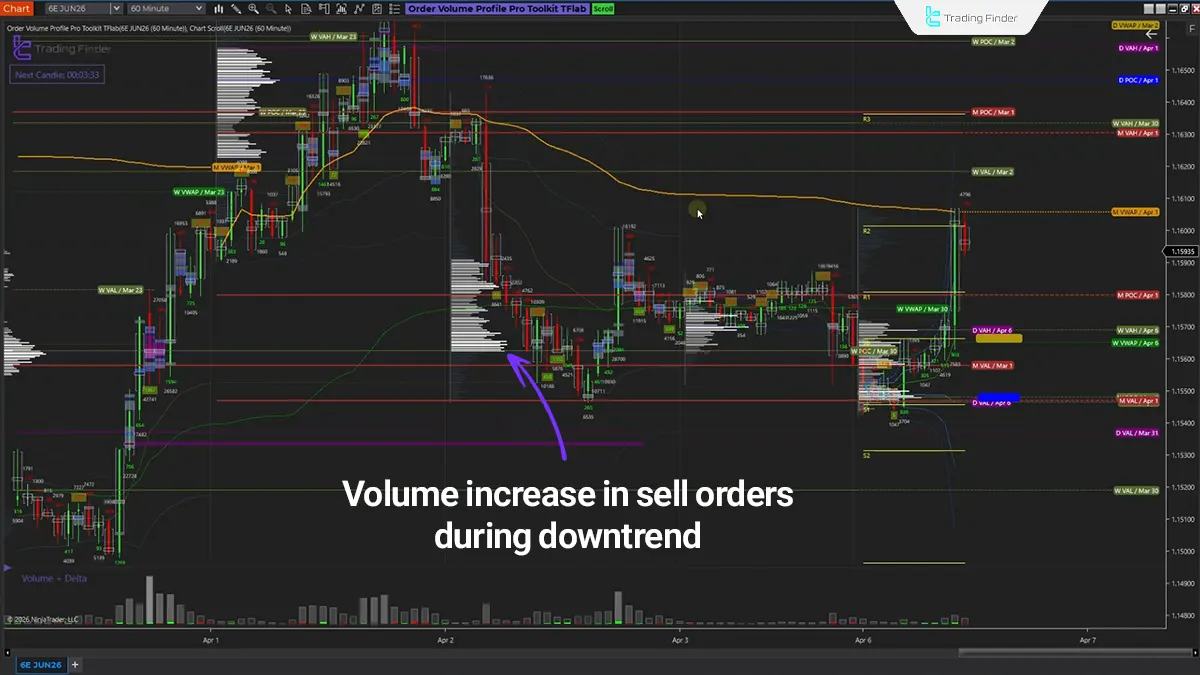
Indicator in a Bearish Trend
Unlike an uptrend, decreasing liquidity volume, noticeable order reduction, and smaller candle sizes across different levels make it possible for traders to analyze bearish scenarios and evaluate market momentum.
This indicator is also highly useful for identifying key support and resistance levels, evaluating pivot points and price reversals, as well as retesting personal trading strategies.
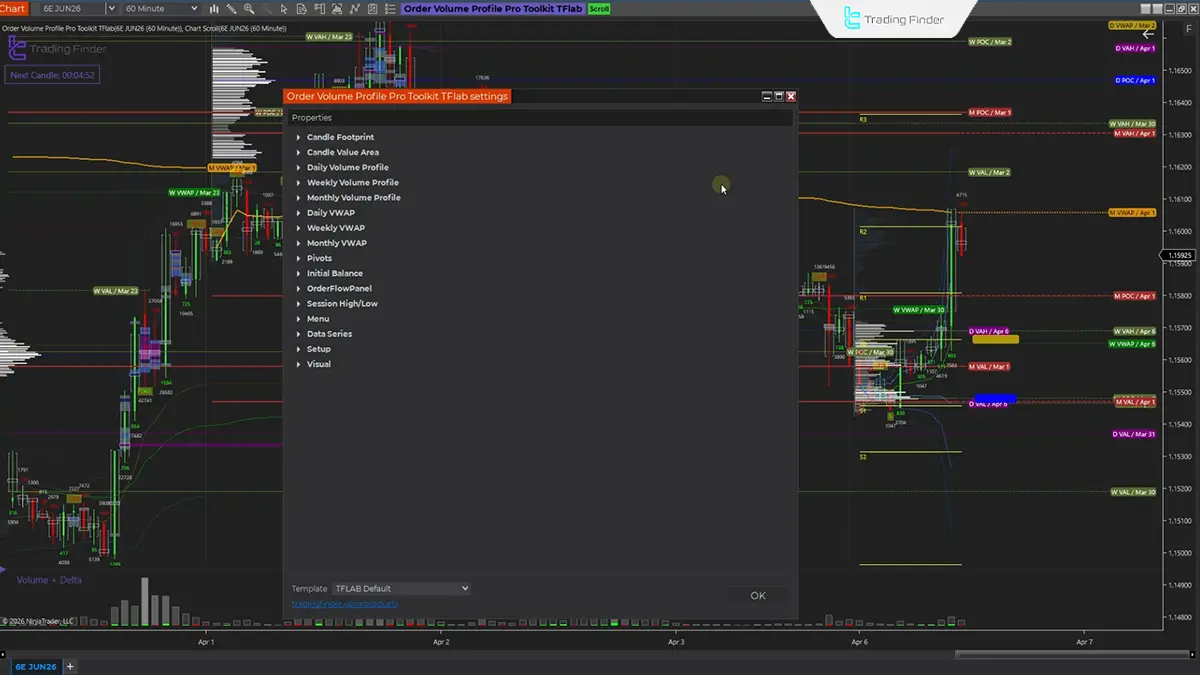
Volume Profile Pro Indicator Settings
The image below shows the settings panel of the TradingFinder Order Volume Profile Pro indicator on the NinjaTrader platform:
- Candle Footprint: Settings for the items displayed on each candle
- Candle Value Area: Modify POC settings, including appearance and candle review count
- Daily Volume Profile: Change the display of the daily volume profile
- Weekly Volume Profile: Modify the display method of the weekly volume profile
- Monthly Volume Profile: Modify the display method of the monthly volume profile
- Daily VWAP: Change daily volume-weighted average price information
- Weekly VWAP: Change weekly volume-weighted average price information
- Monthly VWAP: Change monthly volume-weighted average price information
- Pivot: Pivot settings
- Initial Balance: Important price points
- Session High/Low: Highest and lowest points of the session
Conclusion
The Volume Profile Pro TradingFinder indicator in NinjaTrader is a multi-layered tool for analyzing market structure, volume, delta, profile, VWAP, and key price levels.
This indicator reconstructs raw market data into interpretable chart structures, allowing analysts to study price behavior beyond the appearance of candles.
When this tool is used alongside market structure, sessions, liquidity zones, and Smart Money scenarios, the quality of price interpretation and trading decision-making accuracy improves significantly.
Volume Profile Pro Indicator in NinjaTrader 8 PDF
Volume Profile Pro Indicator in NinjaTrader 8 PDF
Click to download Volume Profile Pro Indicator in NinjaTrader 8 PDFWhat information does the Volume Profile Pro TradingFinder indicator add to the NinjaTrader chart?
This indicator displays multiple layers of market data simultaneously on the chart, including intrabar volume, Candle Delta, Value Area ranges, daily, weekly, and monthly volume profiles, VWAP lines, pivots, Initial Balance, and Session High/Low ranges.
This combination allows traders to analyze market structure beyond candle appearance alone by incorporating volume, liquidity, and key level data into the analysis.
Which trading style is the TradingFinder Order Volume Profile Pro indicator suitable for?
This tool is mainly suitable for intraday trading, scalping, and session analysis. Since much of its logic is based on order flow, volume distribution, and price reaction to important market areas, it provides greater precision in trading styles that depend on short-term price behavior, momentum, and liquidity.
What is the purpose of the Candle Footprint section in the Order Volume Profile Pro TradingFinder indicator?
The Candle Footprint section is used to evaluate volume details and order behavior inside each candle. This section helps determine how much trading volume occurred at each price level and where the main concentration of orders was located. As a result, analysts can assess price movement strength, order absorption zones, and highly active market areas more accurately.
como puedo contactar para la licencia?? cual es el numero para el whatssap??

Hello, please contact us through this WhatsApp number +971 58 102 2550
Hola. Solicita una licencia, ¿Cómo puedo conseguirla? Gracias de antemano. Saludos.
Para obtener una licencia gratuita, póngase en contacto con nosotros a través de Telegram o WhatsApp


