


TradingView
MetaTrader4
MetaTrader5
The ICT Liquidity Pool AI Signals Screener is designed based on advanced liquidity flow concepts and institutional participant behavior, with its core functionality built upon analyzing the interaction between order blocks and fair value gaps.
The logic of this tool is based on the assumption that the market does not move randomly; rather, it tends to gravitate toward areas where a high volume of orders has been accumulated.
These zones, which typically form around structural highs and lows or price imbalance ranges, display entry and exit signals in the form of green and red colored boxes.
To utilize advanced charting tools and technical analysis features, you can sign up and create an account on TradingView.
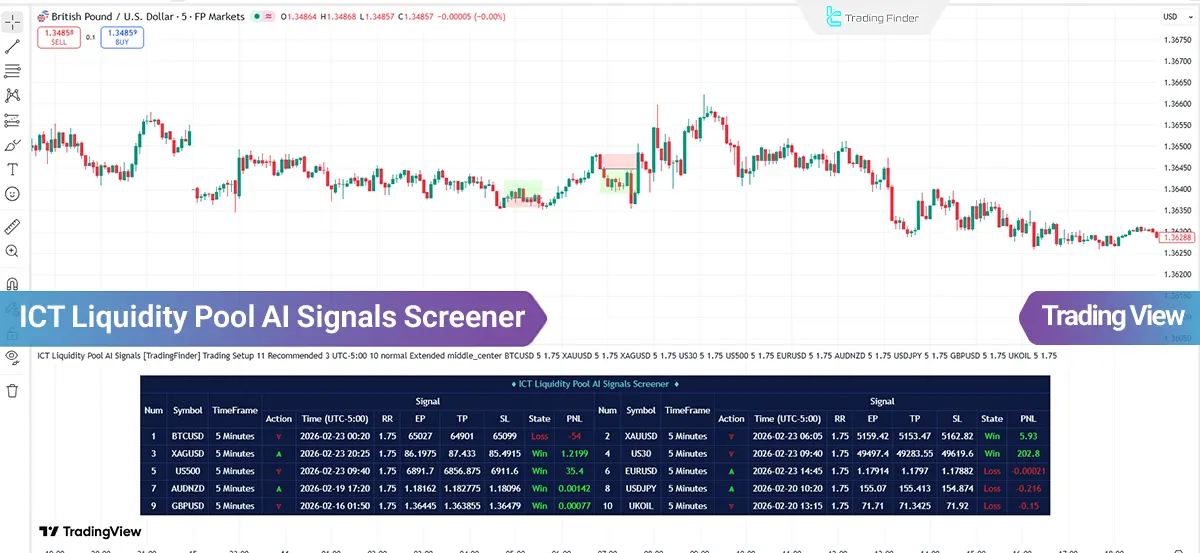
ICT Liquidity Pool AI Signals Specifications Table
The table below presents the features of the ICT Liquidity Pool AI Signals Screener:
Indicator Categories: | Price Action Tradingview Indicators Liquidity Tradingview Indicators Trading Assist Tradingview Indicators |
Platforms: | Trading View Indicators |
Trading Skills: | Advanced |
Indicator Types: | Reversal Tradingview Indicators Breakout Tradingview Indicators |
Timeframe: | Multi-Timeframe Tradingview Indicators |
Trading Style: | Intraday Tradingview Indicators |
Trading Instruments: | TradingView Indicators in the Forex Market Cryptocurrency Tradingview Indicators Stock Tradingview Indicators Commodity Tradingview Indicators Indices Tradingview Indicators Share Stocks Tradingview Indicators |
ICT Liquidity Pool AI Signals Screener at a Glance
The ICT Liquidity Pool AI Signals Screener operates by first identifying structural pivot points, namely key highs and lows, in order to determine liquidity accumulation zones.
When price approaches these areas and temporarily breaks key levels to trigger pending orders, a liquidity sweep process occurs. This break is typically followed by a rapid price reversal, indicating liquidity absorption and the entry of strong orders in the opposite direction of the initial move.
At this stage, the indicator looks for the overlap of this behavior with the presence of a valid order block or fair value gap within the same zone to confirm the structural validity of the area.
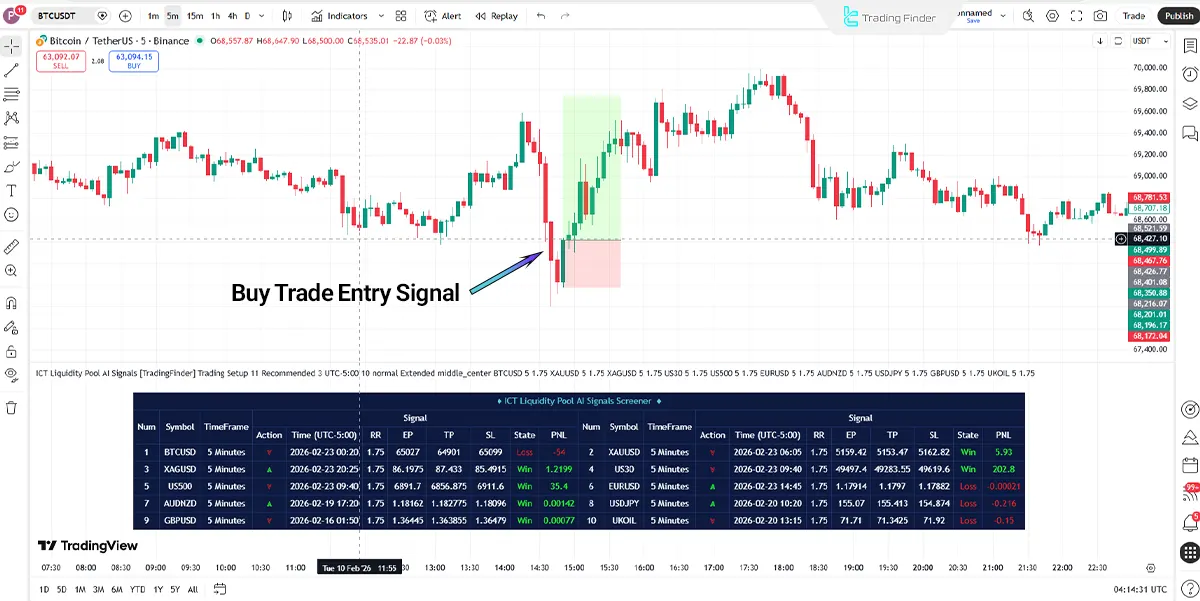
Screener Performance in an Uptrend
A buy signal is issued when, after a downward movement, price collects liquidity below previous lows and then forms a bullish confirmation candle, signaling a shift in order flow. The close of this candle is considered entry confirmation.
In binary mode, the focus is on the movement of the next candle and the market’s immediate reaction, while in trade setup mode, the take profit is usually placed at the nearest structural resistance or the next equilibrium zone, and the stop loss is set below the recent low or beneath the liquidity zone to control trade risk.
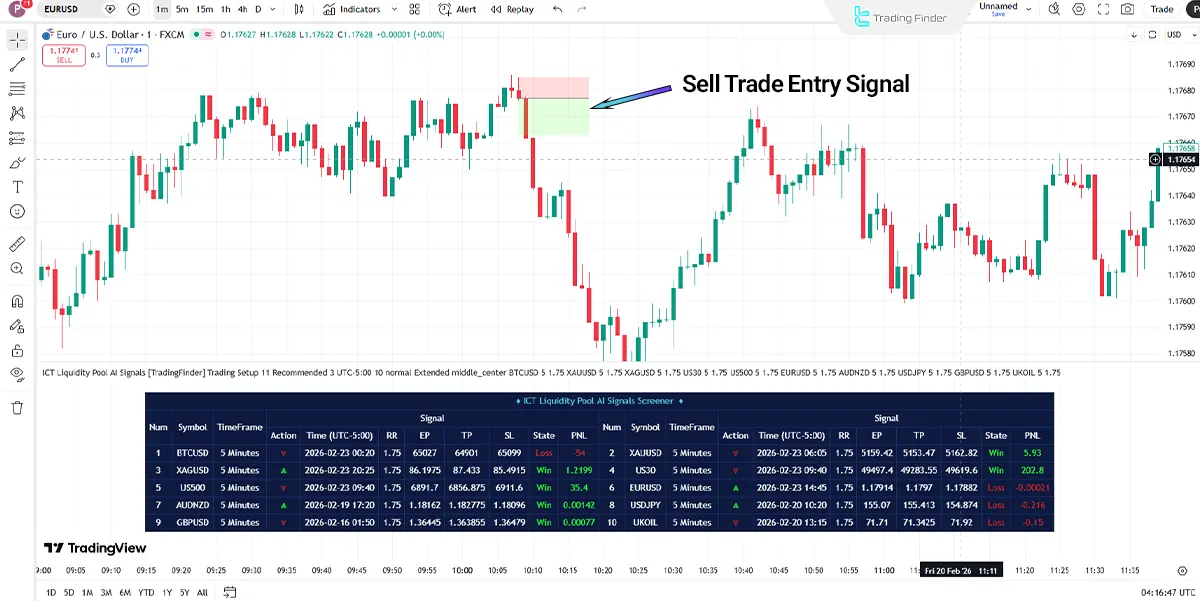
Screener Performance in a Downtrend
In a downtrend, when price, after an upward movement, absorbs liquidity above recent highs and then signs of weakness and a bearish reversal appear in the form of a confirmation candle, the indicator activates a sell entry.
Final confirmation occurs with the close of the reversal candle. In short-term trades, the objective is to capitalize on the rapid reaction following the sweep, while in more structural trades, the take profit is set at the nearest valid support and the stop loss is placed slightly above the recent high.
ICT Liquidity Pool AI Signals Screener Settings
The image below displays the settings details of the ICT Liquidity Pool AI Signals Screener:
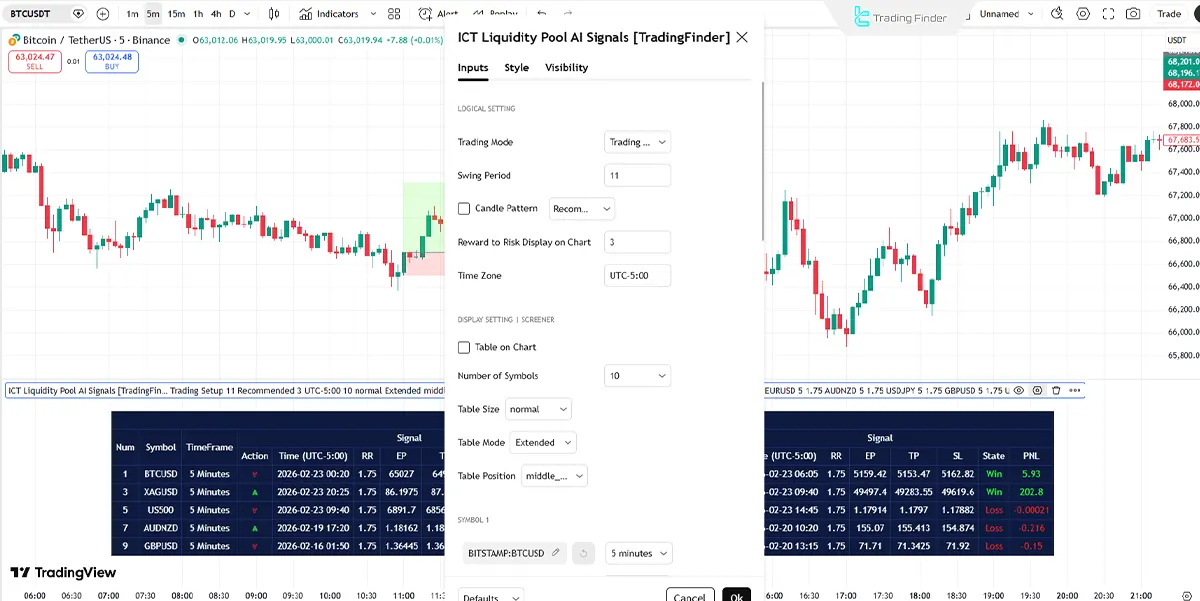
- Trading Mode: Show trading mode
- Swing Period: Structural pivot
- Candle Pattern: Candle confirmation
- Reward to Risk Display on Chart: Risk-reward display
- Time Zone: Show time zon
- Table on Chart: Screener table
- Number of Symbols: Show number of symbols
- Table Size: Table scale
- Table Mode: Table layout
- Table Position: Table position
- Symbol: Trading symbol
- Timeframe (5 minutes): Trading timeframe
Conclusion
The ICT Liquidity Pool AI Signals indicator is designed based on Smart Money concepts and liquidity flow analysis, identifying order accumulation zones to extract high-probability entry points.
By combining order blocks and fair value gaps, this tool filters out false breakouts and bases signal generation solely on valid structural reactions.
ICT Liquidity Pool AI Signals Screener PDF
ICT Liquidity Pool AI Signals Screener PDF
Click to download ICT Liquidity Pool AI Signals Screener PDFWhen is a buy signal issued in the ICT Liquidity Pool AI Signals Screener?
In this screener, when price absorbs liquidity below key lows, aligns with a bullish order block or FVG, and a valid reversal candle closes, a buy signal is activated.
Is it possible to use multiple symbols simultaneously in the ICT Liquidity Pool AI Signals Screener?
Yes; in this trading tool, through the screener table, multiple currency pairs or symbols can be monitored simultaneously, and their signal status can be viewed directly on the chart.


