


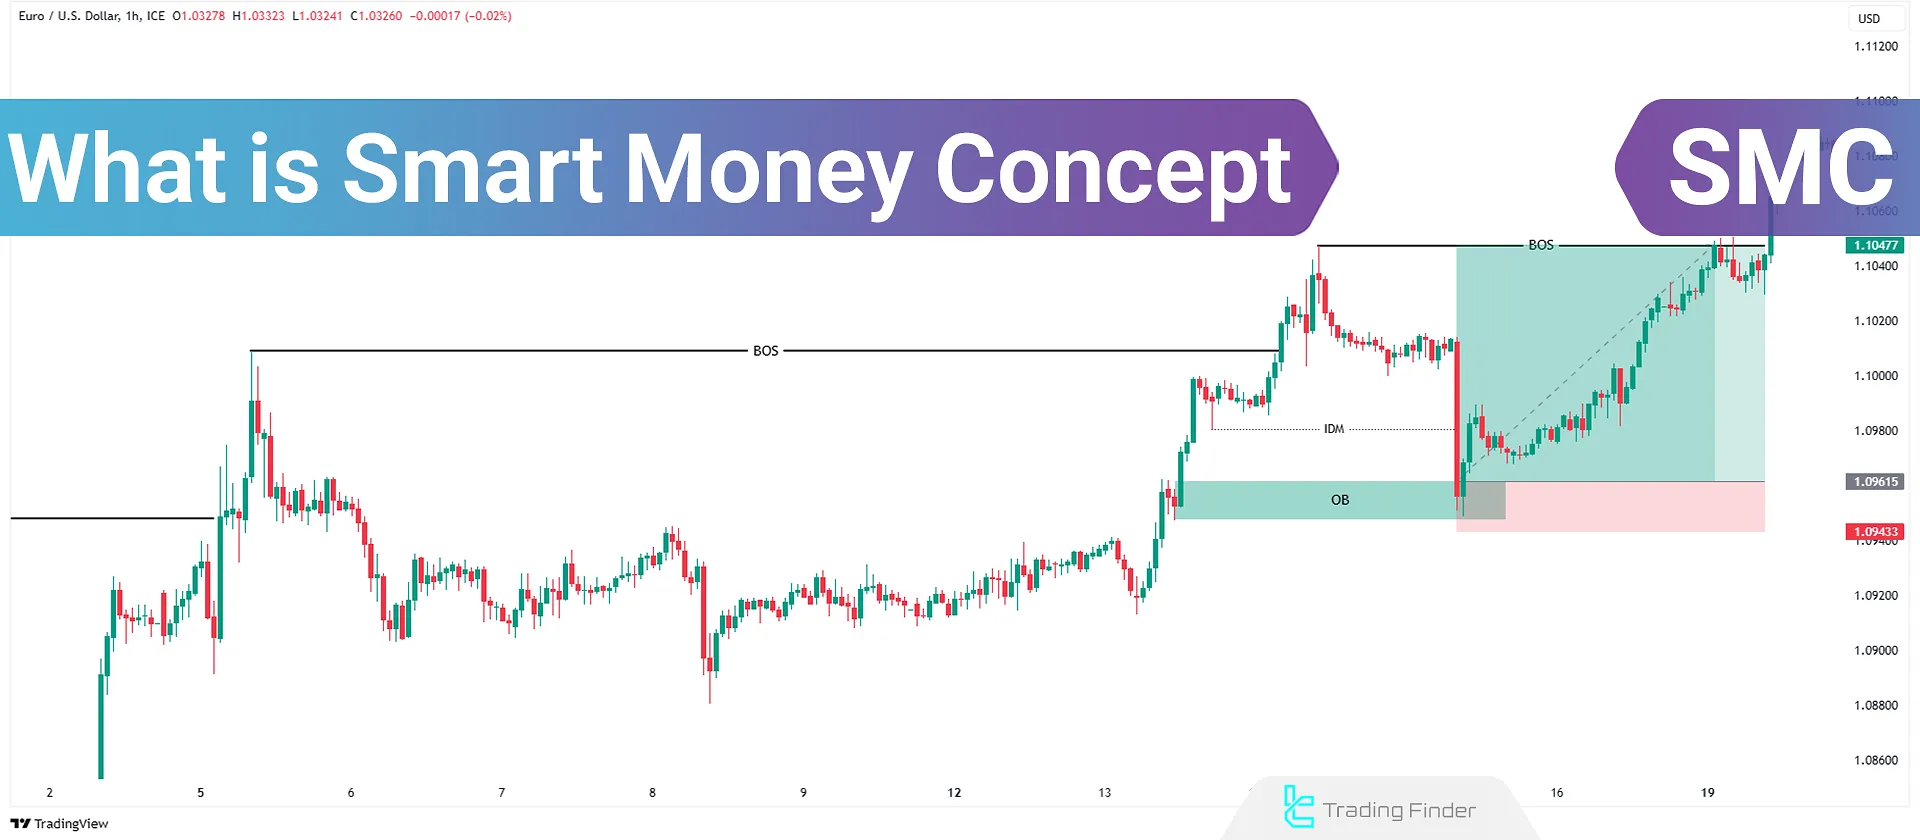
The Smart Money Concept (SMC) is an advanced method of market analysis that focuses on market structure, order flow and liquidity in Forex. Unlike traditional technical analysis, which relies on indicators, in this approach traders study the behavior of financial institutions, hedge funds, and central banks to identify trade opportunities.
In Smart Money Concepts, the primary focus is on identifying the footprint of smart money through structural breaks, liquidity shifts, and price reactions to key zones, so that trades are executed based on the internal logic of the market rather than merely on surface-level signals.
For this reason, the smart money style provides higher accuracy in defining low-risk entry points and optimal exits compared to classical methods.
What is Smart Money, and How Does It Work?
Smart Money refers to the capital controlled by banks, financial institutions, and large market participants. Due to their access to advanced data, large-scale orders, and high liquidity, these entities directly impact price movements.
As a result, the Smart Money Concept identifies the behavioral patterns of these institutions and aligns trading decisions with institutional liquidity. Financial institutions use order blocks (OBs) to enter trades on various Forex instruments.
They manipulate the market by liquidity grabs and market manipulation, forcing retail traders out of profitable positions before entering optimal points.
Advantages and Disadvantages of the Smart Money Concept
Like any trading methodology, SMC has its own set of advantages and disadvantages:
Advantages | Disadvantages |
Accurately identifies institutional entry points through order blocks (OBs) and Break of Structure (BOS) | Requires deep understanding of institutional movements and market-making models |
Allows entries with tight stop-losses and logical targets based on Fair Value Gaps (FVGs) and Change of Character (CHoCH) | High risk of misinterpretation if liquidity mechanics are not well understood |
Detects liquidity grabs by market makers | No definitive evidence of institutional price manipulation |
Analyzes price structure without relying on traditional indicators | Complex learning curve for beginners |
Can be applied in both short-term and long-term timeframes | - |
Key Components of the SMC
To effectively understand and use the smart money style in Forex, identifying the key components of this approach is essential.
By combining these tools, more precise entry and exit scenarios can be designed, and the likelihood of being caught in deceptive moves and price traps can be significantly reduced.
he most important concepts related to smart money include:
- Market structure
- Break of structure (BOS)
- Change of Character (CHoCH)
- Order Blocks (OB)
- Breaker blocks (BB)
- Fair Value Gaps (FVG)
- Liquidity Sweep & Liquidity Run
Market Structure
Market structure refers to how price moves create trends in the market. Smart Money traders first analyze the overall market structure to identify significant entry and exit levels.
Within this framework, correct identification of market phases-including uptrend, downtrend, and range-is performed based on the sequence of HH, HL, LH, and LL, and the validity of movements is assessed by examining impulsive and corrective candles.
This analysis allows the trader to filter points that are aligned with the flow of smart orders and to receive entry confirmation only after a structure reclaim or a valid breakout.
How to Use Market Structure
Evaluating uptrends and downtrends, highs & lows, and price accumulation zones helps determine the market's probable direction.
In this analysis, the focus is on the correct sequence of HH and HL in an uptrend, and LH and LL in a downtrend, along with identifying consolidation zones.
This approach guides the trader toward a more accurate distinction of market phases and helps avoid entries in areas of uncertainty or at the end of momentum.
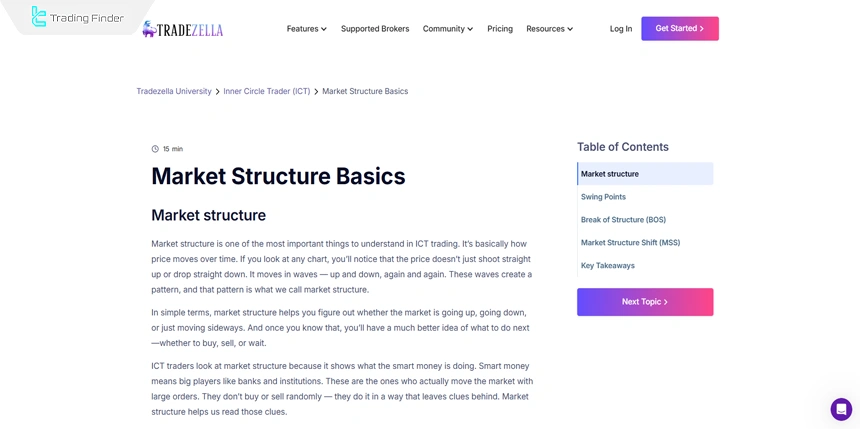
The market structure training article on the tradezella.com website provides more comprehensive explanations about the details of market structure, which interested readers can use to gain a better understanding of the market.
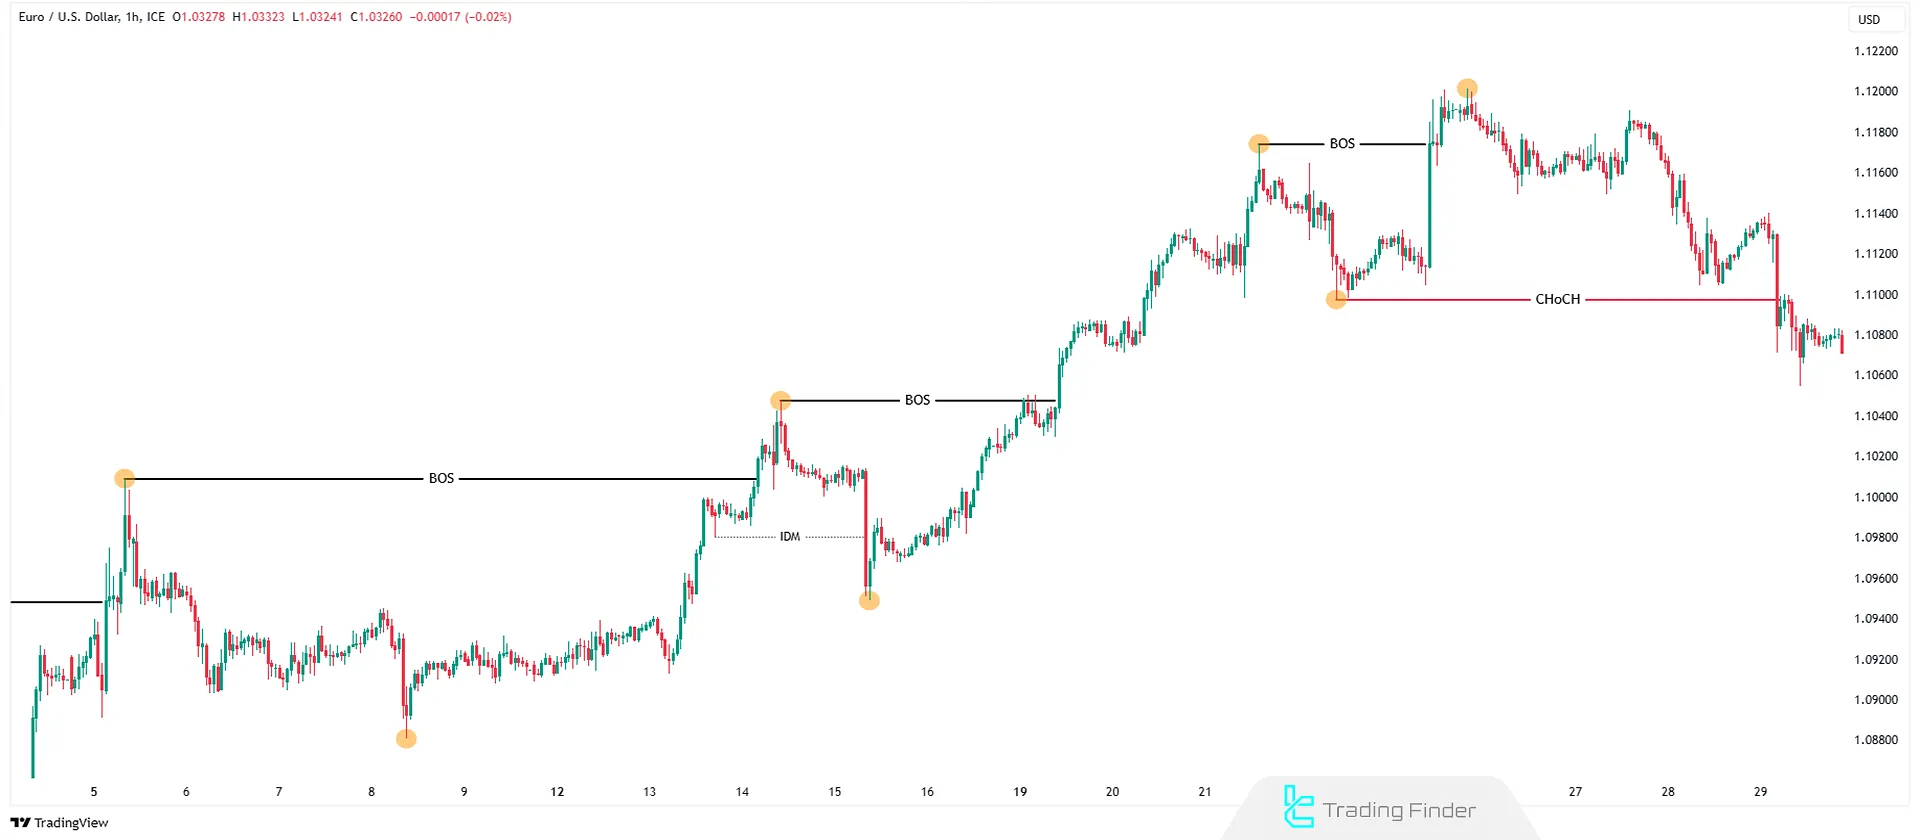
Break of Structure (BOS)
A Break of Structure (BOS) occurs when the price breaks a significant high or low and establishes a new direction. This indicates a continuation of the trend.
In a valid BOS, merely touching a high or low level is not sufficient; a candle close above the previous resistance or below the previous support is required for confirmation.
This breakout is often accompanied by increased volume or momentum and is considered a sign of new liquidity entering in the direction of the trend, which can serve as a basis for continuing trades in line with the dominant market flow.
How to Use BOS
Smart Money traders use BOS to confirm trend continuation and enter positions in alignment with the market trend.
After identifying a BOS, entries are usually taken on a pullback to the breakout zone or the aligned order block in order to optimize the risk-to-reward ratio.
Combining BOS with confirmations such as liquidity absorption, momentum divergence, or reactions to supply and demand zones increases trade accuracy and helps prevent deceptive entries during false breakouts.
Change of Character (CHoCH)
Change of Character (CHoCH) is the first sign of a potential trend reversal and is often associated with liquidity shifts and institutional entries.
A change in market character is confirmed when, after a sustained trend, the structure of highs and lows is violated for the first time; for example, in an uptrend, a higher low (HL) is broken.
This event often occurs alongside liquidity collection on one side of the market and serves as an early warning of the weakening of the previous trend and the potential start of a distribution or accumulation phase in a new direction.
How to Use CHoCH
CHOCH helps traders identify reversal zones and potential trend shifts. Traders usually wait for price to retrace to key zones such as an order block or an imbalance area after a CHoCH, rather than entering immediately, in order to receive a lower-risk entry confirmation.
Combining CHoCH with liquidity absorption at highs or lows significantly increases the probability of accurately identifying the end of the previous trend and the start of a new price move.
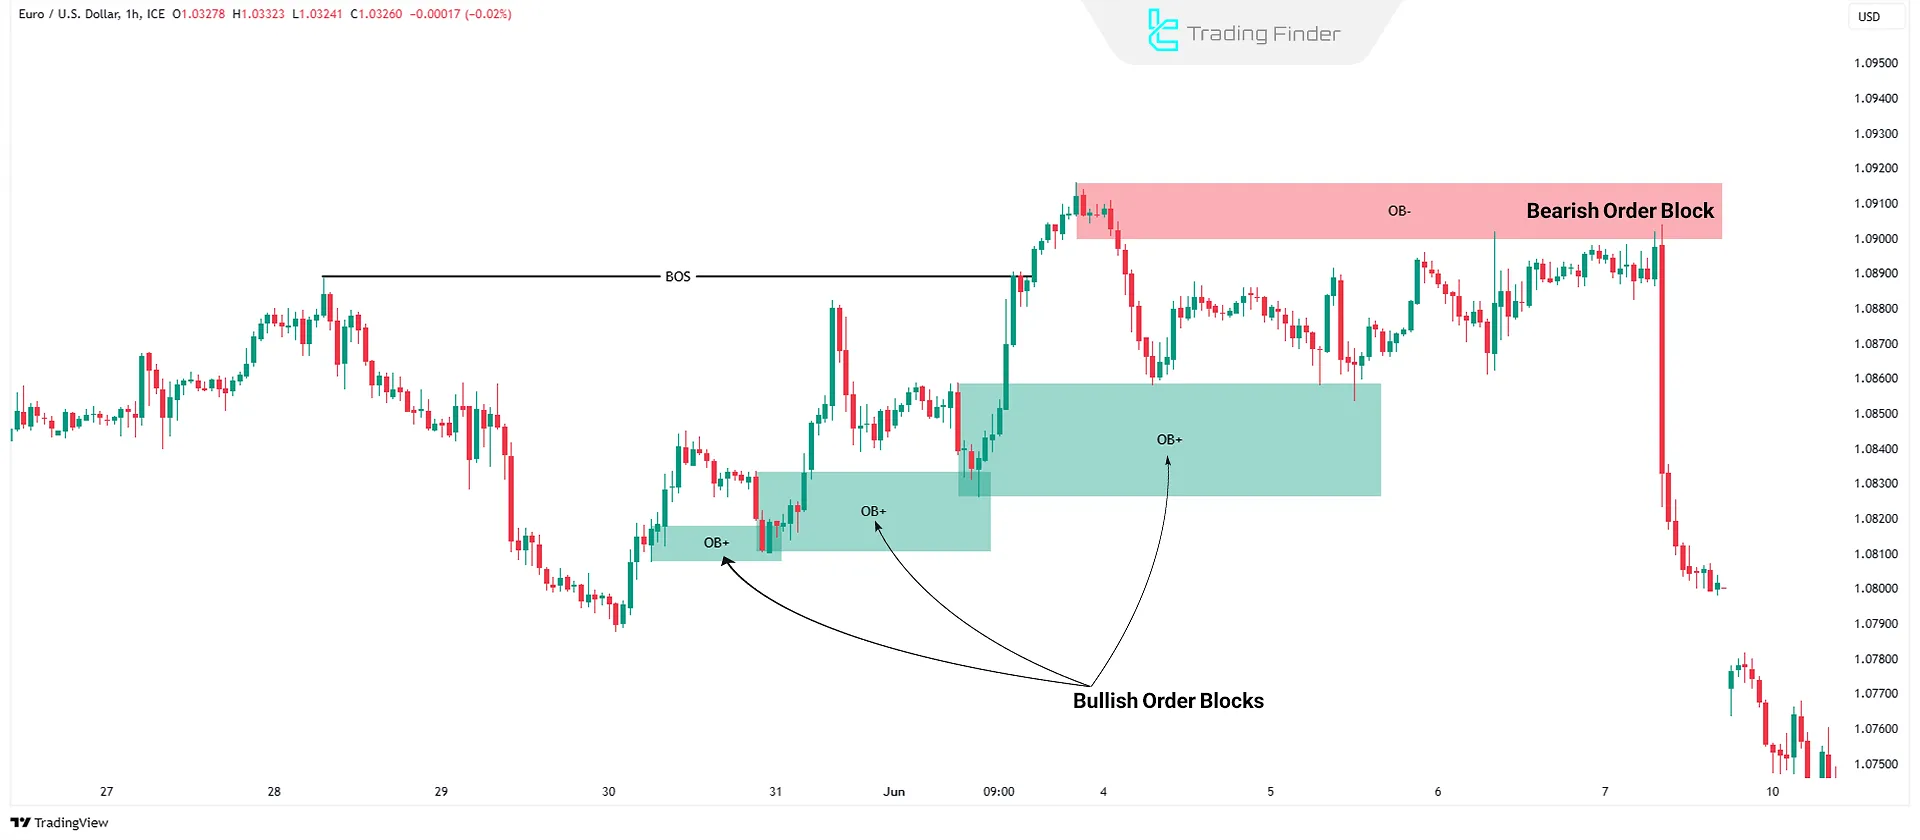
Order Blocks (OBs)
Order Blocks (OBs) are areas where financial institutions place significant buy or sell orders. These zones often act as key entry points in Smart Money trading.
Order blocks are typically the last opposing candle before a strong impulsive move, indicating the accumulation or distribution of large orders.
A subsequent price reaction to these zones is often accompanied by respect for market structure and the creation of low-risk entry opportunities, especially when aligned with BOS or CHoCH.
How to Use Order Blocks
Traders enter in the direction of institutional order flow from these high-probability areas. In practice, accurately selecting a valid order block requires examining the strong impulse that follows it, ensuring there is no deep price penetration into the block, and confirming alignment with market structure or BOS.
The higher the timeframe on which the order block is formed and the more it overlaps with opposing-side liquidity, the greater its validity for low-risk entries aligned with the flow of smart money.
Breaker Blocks
Breaker blocks form when a price breaks through an order block and establishes itself in a new direction, acting as new support and resistance levels.
In this case, the previously broken order block changes its role from supply to demand, or vice versa, and becomes a strong reaction zone.
A price return to the breaker block is usually accompanied by reduced momentum and liquidity absorption, and if it aligns with BOS or CHoCH, it can provide a precise entry point with a defined stop loss and controlled risk.
How to Use Breaker Blocks
Traders use breaker blocks to identify price reversals after structural shifts. In practical application, entries are usually taken after price returns to the breaker zone and signs of weakening in the previous move or confirmation on lower timeframes are observed.
The overlap of the breaker block with collected liquidity zones and the new market structure significantly increases the validity of this area for low-risk, reversal entries.
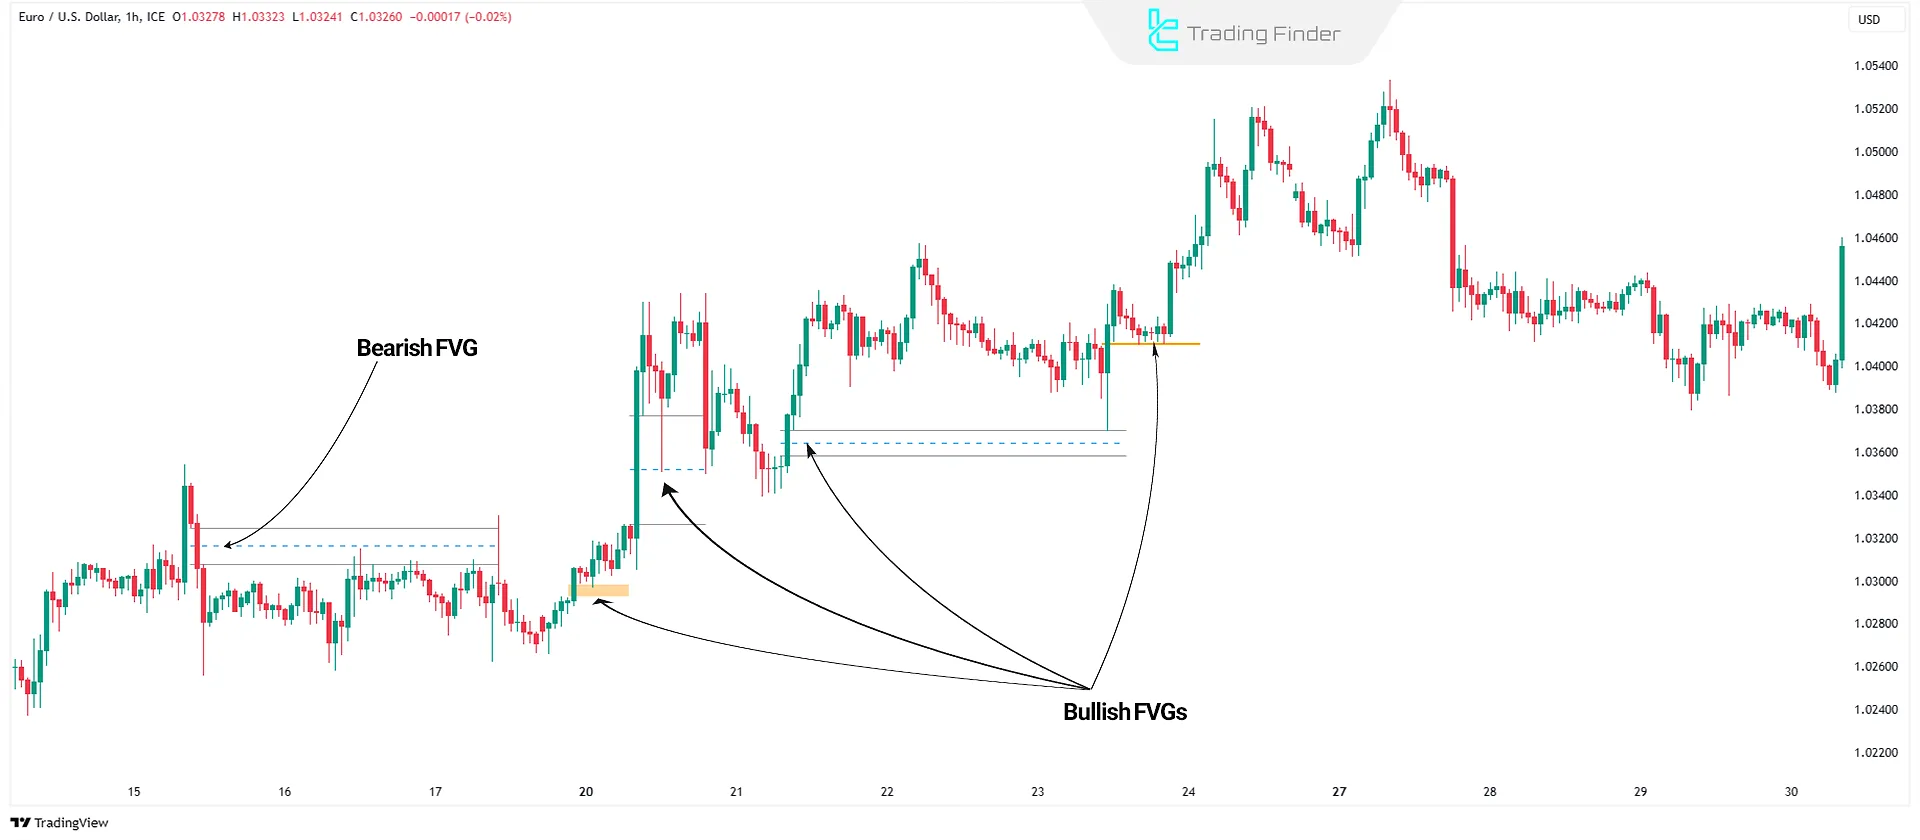
Fair Value Gaps (FVGs)
An Fair Value Gaps (FVG) occurs when the price moves rapidly from one level to another, leaving an unfilled price gap caused by large institutional orders.
These zones represent an imbalance between buying and selling pressure, and the market usually tends to return to them in the future to fill the price inefficiency.
Alignment of an FVG with an order block or market structure significantly increases its validity as a potential entry zone or trend continuation area.
How to Use FVGs
Smart Money traders use FVGs to identify areas where prices may return to fill the imbalance. In practical application, traders usually wait for price to retrace to the 50% level of the FVG gap and, if aligned with market structure, BOS, or an order block, they proceed with entry.
The higher the timeframe on which the FVG is formed and the stronger the accompanying momentum, the greater the probability of a valid price reaction and a more effective filling of the gap.
Liquidity Grabs
Institutions manipulate liquidity before entering trades by driving prices into areas where retail traders' stop-losses are located.
This process is usually carried out through deceptive breakouts at major highs and lows, or temporary penetration of key support and resistance levels, in order to collect pending orders and stop losses.
After liquidity is absorbed, a sudden shift in momentum and the formation of a CHOCH or BOS in the opposite direction confirms institutional entry, and the market enters its main, strong move.
How to Use Liquidity Grabs
Smart Money traders wait for liquidity to be absorbed before entering trades in alignment with institutional traders’ orders.
In practice, after a stop hunt above major highs or below significant lows is recorded, traders wait for reversal signals such as a CHOCH or a reaction to an order block so that their entry is based on confirmation of smart money behavior.
This approach helps avoid emotional entries before the liquidity absorption process is completed and allows trades to be executed with a higher probability of success and more controlled risk.
How Does Smart Money Control the Market?
Smart money in Forex is managed by banks, financial institutions, and investment funds, and these entities play a key role in manipulating and directing the market.
Due to their financial power, access to advanced data, and high liquidity, these large players are able to move price in a way that provides the liquidity they need. One of their primary methods for achieving this is liquidity inducement.
Inducement
Smart Money traps retail traders into entering positions in the wrong direction to activate their stop-losses, to ensure there is enough liquidity for institutions to enter trades.
Stop Hunts
Institutions push prices into stop-loss zones to absorb liquidity, forcing retail traders out of the market before executing their large orders with minimal slippage.
False Breakouts & Fake Support/Resistance Levels
Smart Money creates false breakouts to trick traders into entering positions, only to reverse prices in the opposite direction.
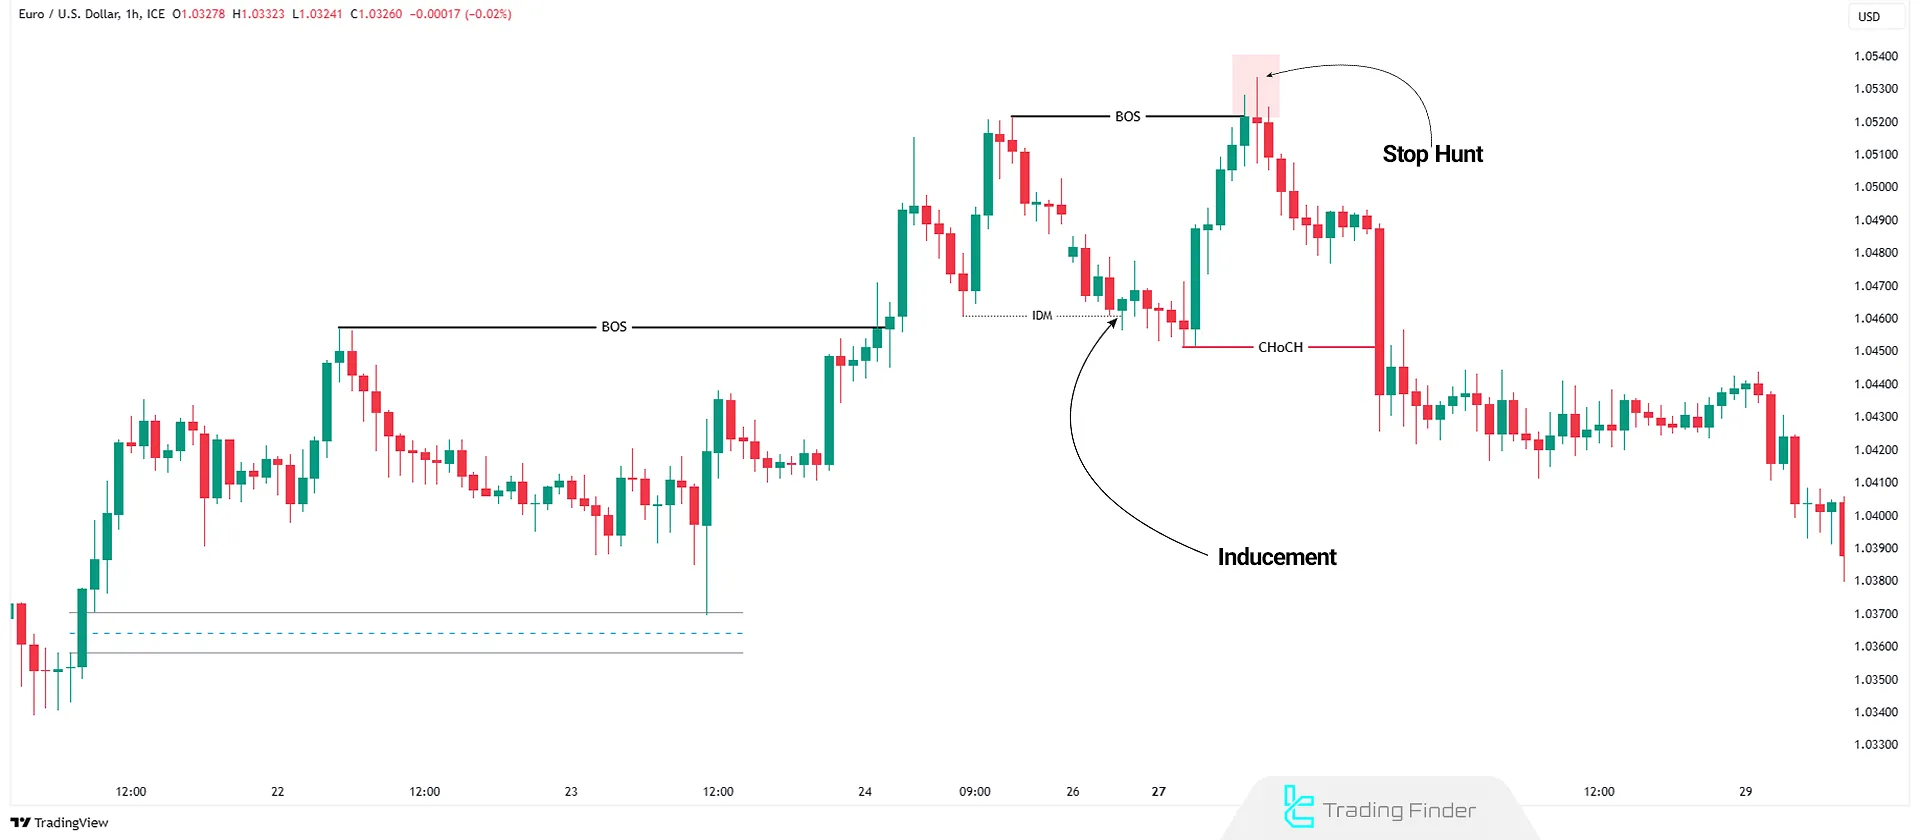
Example of Fake Breakouts at Support and Resistance Levels
On the EUR/USD currency pair chart, after an upside structure break and subsequent liquidity inducement, price moved toward the previous high and, with the activation of sellers’ stop losses or a stop hunt, began its bearish move.
Subsequently, with the formation of a change of character (CHOCH), the intensity of the price decline increased and seller dominance within the market structure was confirmed.
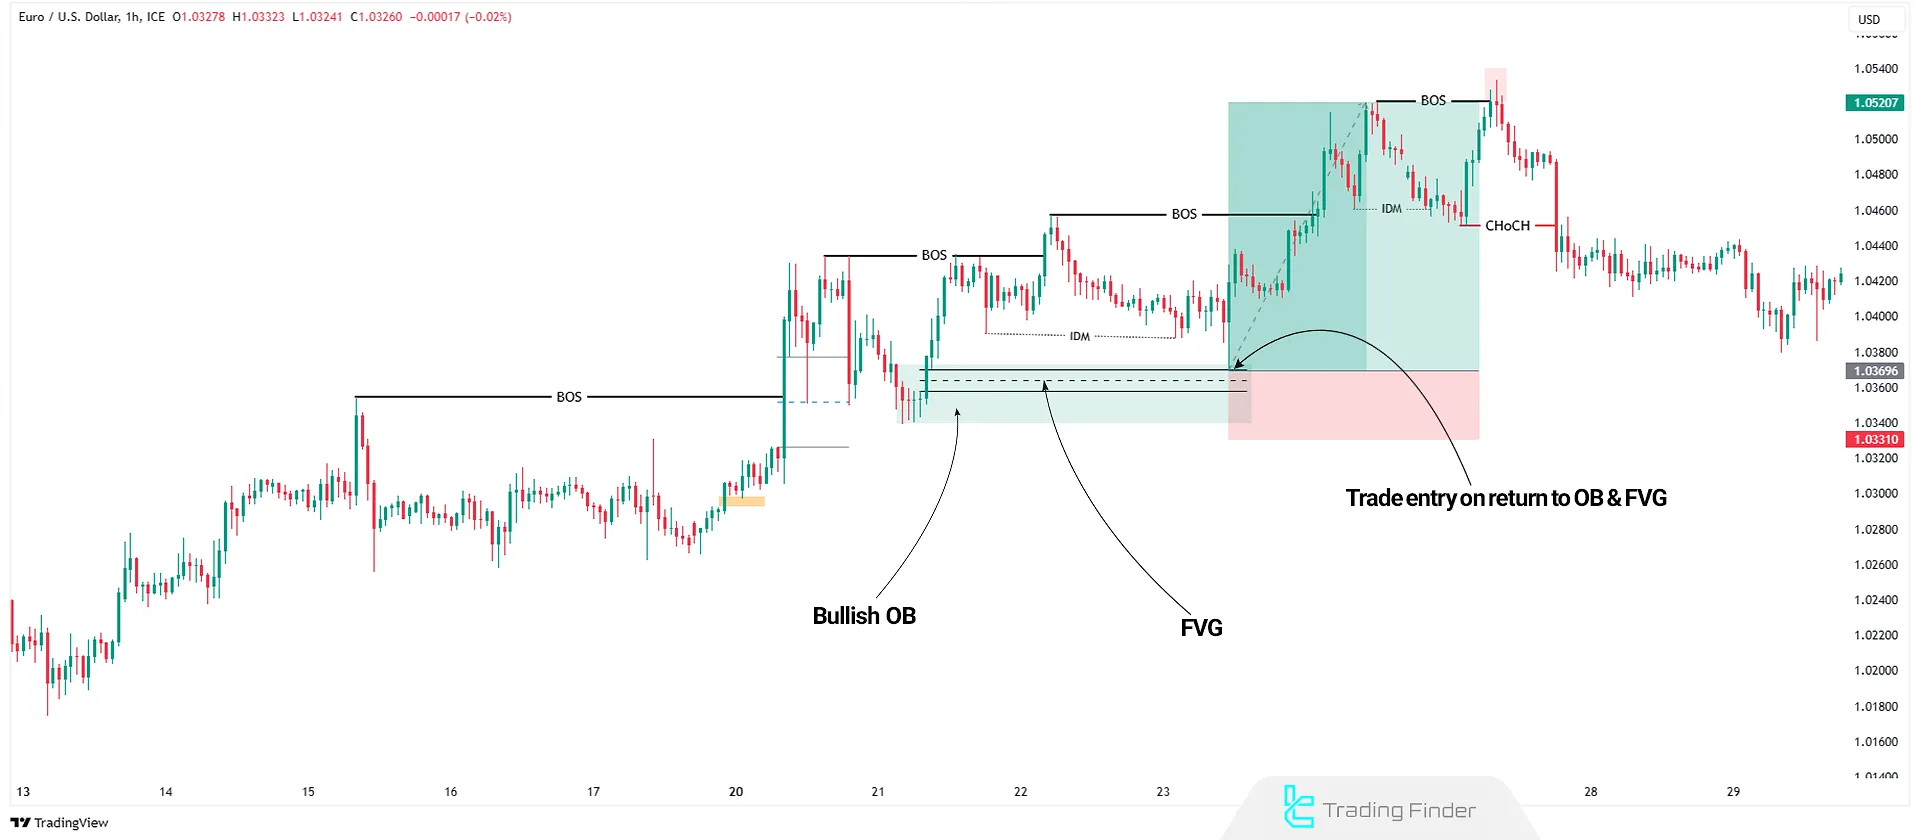
How to Trade Using the Smart Money Concept?
To trade with Smart Money trading concepts in Forex, traders should follow these steps:
- Determine Market Trend: Analyze the overall price structure in higher timeframes (H1, H4)
- Identify Structural Breaks (BOS & CHoCH): Watch for BOS to confirm trend continuation and CHoCH for potential reversals
- Find Order Blocks: Identify high-probability OBs aligned with the institutional trade flow
- Evaluate Fair Value Gaps: Spot price imbalances to anticipate possible retracements
- Analyze Liquidity Grabs: Look for areas with high stop-loss clusters and wait for liquidity to be taken
- Enter Trade: Once all conditions align, enter with a logical stop-loss and profit target, typically in lower timeframes (15M or less)
Differences Between Smart Money and ICT Trading
Both SMC and ICT (Inner Circle Trader) trading styles focus on liquidity and institutional order flow, but they differ in methodology:
Parameters | ICT Trading | SMC |
Approach | Timing, liquidity models, and market maker manipulation | Order Blocks (OBs), CHoCH, BOS |
Liquidity Analysis | Uses PD Arrays & Market Maker Models | Identifies price movement and liquidity grabs |
Sessions & Timing | Focuses on session liquidity shifts | Less emphasis on session timing |
Differences Between Smart Money & Classic Technical Analysis
To better understand the differences between the professional Smart Money trading style in Forex and classical technical analysis used by retail traders, it is essential to compare these two methods from a broader perspective.
This comparison should focus on their market analysis approach, the tools they use, and their entry and exit strategies.
Features | Traditional | Analysis |
Market Analysis | Liquidity flow and institutional orders | Classic indicators |
Entry/Exit Points | Order Blocks & BOS | Support & Resistance |
Data Used | Institutional order flow | Price data & indicators |
Market Impact | Drives major trends | Reactive to market moves |
Comparison of Smart Money with RTM Price Action and Supply and Demand
In the table below, a specialized comparison is presented between the three styles of Supply & Demand, RTM, and Smart Money (SMC) based on different criteria:
Comparison axis | Supply & Demand | RTM (Read The Market) | Smart Money (SMC) |
Analysis core | Price reaction to past zones | Price reversal patterns | Liquidity and institutional behavior |
Decision-making source | Historical price zones | Candlestick and price patterns | Smart order flow |
Market perspective | Price-based | Pattern-based | Structural – institutional |
Analytical focus | Price chart | Price chart | The hidden mechanics behind market movements |
Trade entry basis | Supply and demand zones | Reversal patterns | Liquidity grab + market structure |
Liquidity role | Secondary and indirect | Indirect | Core of the analysis |
View on price movement | Reaction to past levels | Pattern-following | Guided by smart money inflows |
Market structure | Limited importance | Moderate importance | Foundation of the analysis |
Conceptual level | Intermediate | Intermediate to advanced | Advanced |
Target audience | Classical trader | Pattern-based trader | Professional and institutional trader |
Key advantage | Simplicity and clear zones | Precision in reversals | Understanding the real cause of price movement |
Principles of Risk Management in Smart Money Trading
Consistent execution of Smart Money strategy principles controls the level of losses even under conditions of analytical error and, in the long term, directs overall trading results toward positive performance.
Risk managementand capital management in the Smart Money style do not play merely a protective role; rather, as a core part of the trading strategy, they reinforce market survival, the trader’s mental stability, and the sustainable growth of the trading account.
The principles of risk management in Smart Money include the following:
- Precise stop-loss placement behind the Order Block
- Avoiding trade entry before liquidity is taken
- Maintaining a minimum risk-to-reward ratio of 1:3
- Avoiding overtrading during low-volume sessions
- Adjusting position size to market volatility
The educational video on the Camelthorn FX YouTube channel presents complementary risk management tips for Smart Money trading in a concise and practical manner.
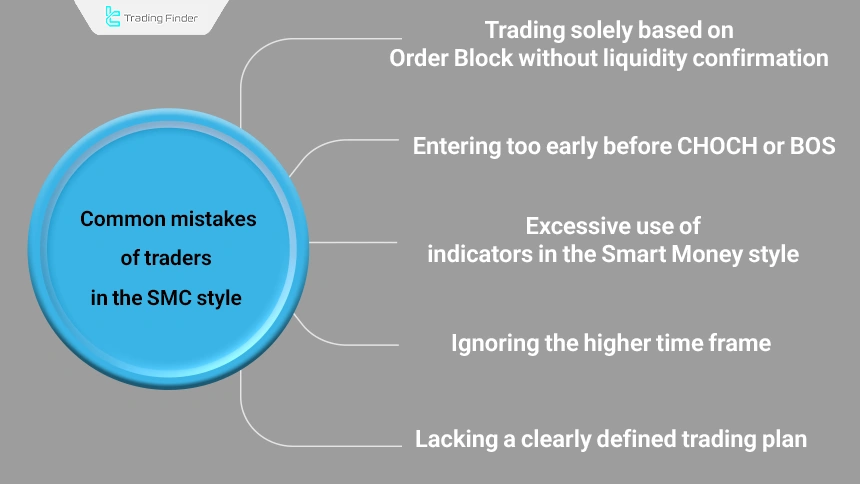
Common Mistakes of Traders in the Smart Money Style
Mistakes usually lead to reduced analytical accuracy, increased emotional trading, and a continuous decline in trader performance, whereas the nature of the Smart Money style is based on patience, multi-layer confirmation, and trading discipline.
Avoiding these errors plays a direct role in increasing the win rate and preserving capital in the long term.
Common mistakes of traders in the SMC style include the following:
- Trading solely based on an Order Block without liquidity confirmation
- Entering too early before CHOCH or BOS
- Excessive use of indicators in the Smart Money style
- Ignoring the higher time frame
- Lacking a clearly defined trading plan
Market Structure Inducements Indicator in MetaTrader
Market Structure Inducements indicator, as one of the specialized technical analysis tools, has been designed for the MetaTrader platform and is built upon advanced Smart Money and ICT concepts.
The analytical core of this tool is based on three key concepts: Change of Character (CHoCH), Break of Structure (BOS), and liquidity Inducements; concepts that play an important role in identifying trend change phases, continuation moves, and price traps.
- Market Structure Inducements indicator on TradingView
- Market Structure Inducements indicator on MT5
- Market Structure Inducements indicator on MT4
In this indicator, the Change of Character is marked with red lines on the chart, while valid structure breaks are displayed as blue lines. This visual separation allows the trader to identify key market points more quickly and make more precise trading decisions.
One of the most valuable features of this tool is the identification of IDM zones; areas in which retail traders are encouraged to enter, while price movement often has a deceptive nature and in many cases leads to a reversal or a change in direction.
These zones are especially more significant on higher time frames and play an important role in reversal strategies.
In bullish conditions, for a currency pair on the 15-minute time frame, the candle body breaking above the previous high is identified as a CHoCH signal, which usually indicates the start of a new bullish phase.
After that, the formation of BOS at higher levels can serve as suitable confirmation for trend continuation and entry into Long trades. Conversely, in a bearish trend of another currency pair on the one-hour time frame, breaking the previous low accompanied by a CHoCH formation creates conditions for entering Short trades.
This indicator falls into the category of reversal-based, multi-timeframe, and liquidity-focused tools and can be used for scalping, day trading, and swing trading styles.
It is also adaptable to Forex markets, cryptocurrencies, stocks, commodities, and the forward market, making it a powerful option for professional traders.
Overall, Market Structure Inducements, by combining market structure and liquidity behavior, provides a deeper view of real order flow and is a suitable tool for identifying low-risk entry points and potential trend reversal zones.Bottom of Form
Conclusion
The Smart Money Concept provides a powerful framework for understanding financial markets' institutional liquidity and order flow.
This method offers traders a unique perspective on price action by focusing on order blocks, BOS, CHoCH, and liquidity grabs.


