


On July 2, 2025, in version 2, alert/notification and signal functionality was added to this indicator
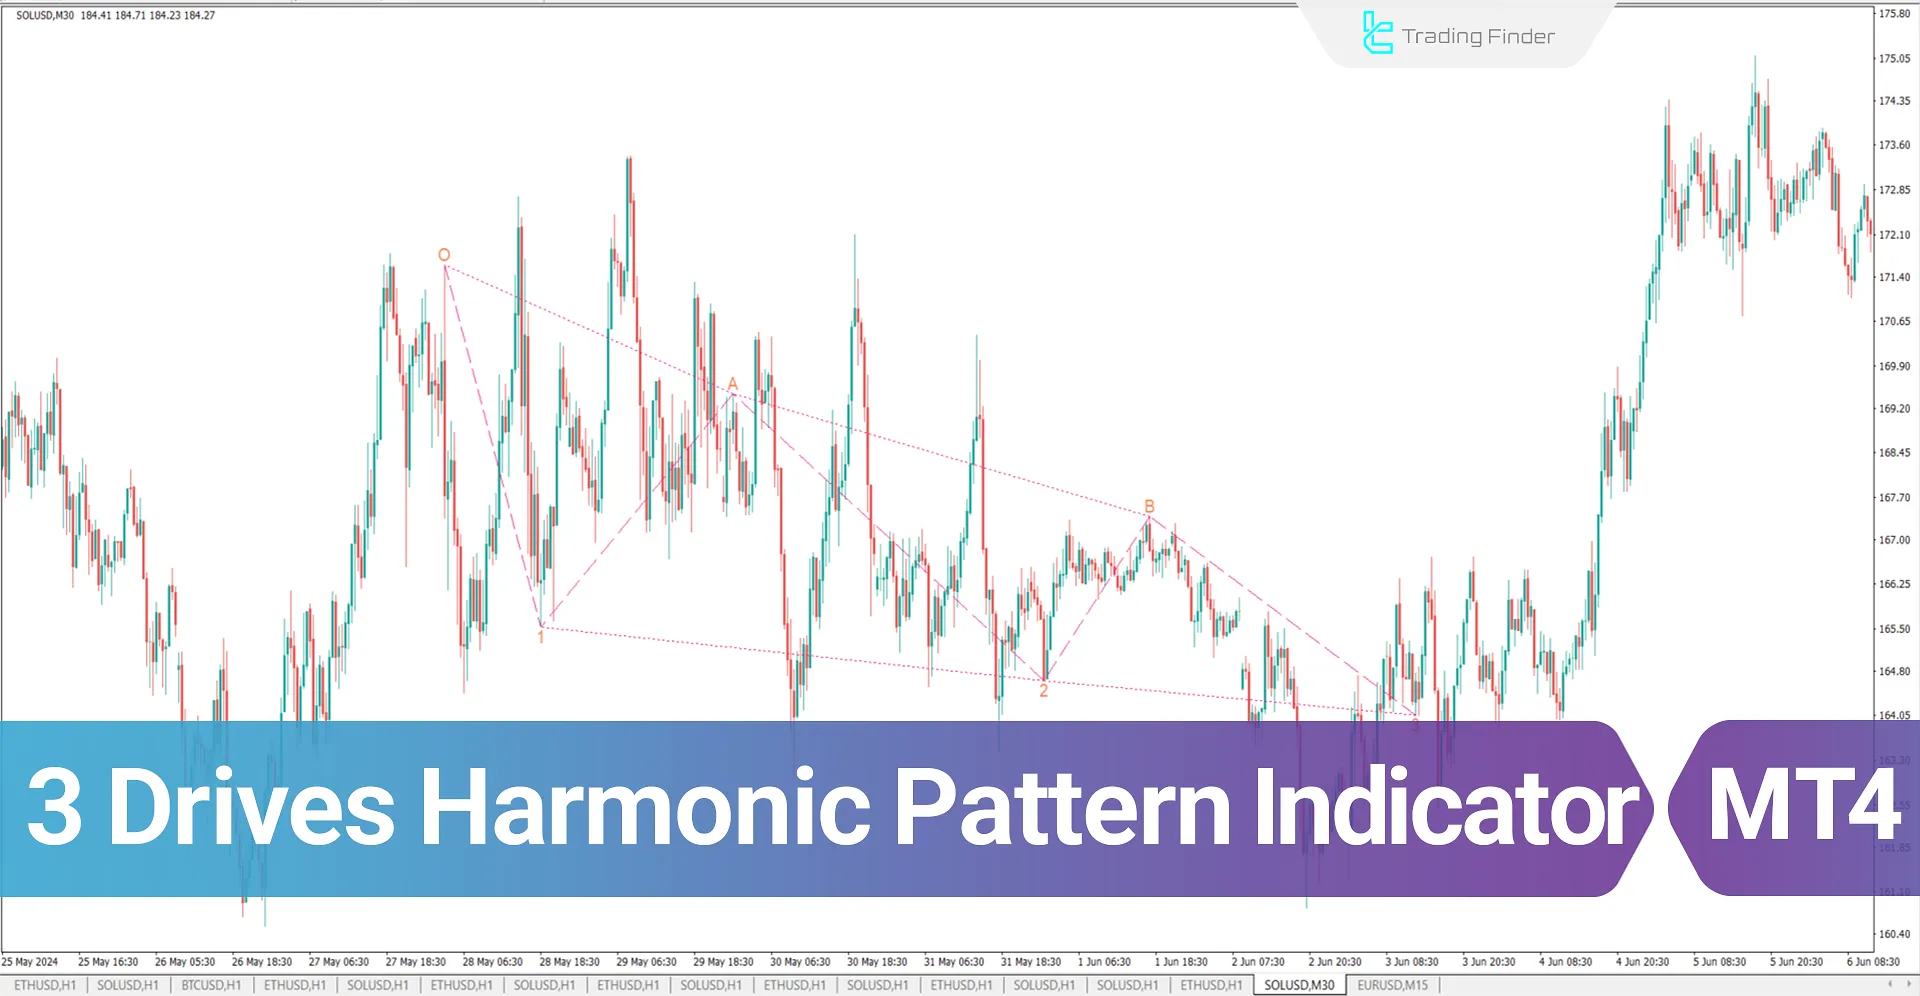
The Three Drives Harmonic Pattern Indicator shares similarities with the ABCD pattern and belongs to the classic chart pattern indicators. This trading tool designed to identify potential reversal zones (PRZ) and is considered a part of the MetaTrader 4 indicators.
This pattern can be formed in both bullish and bearish conditions:
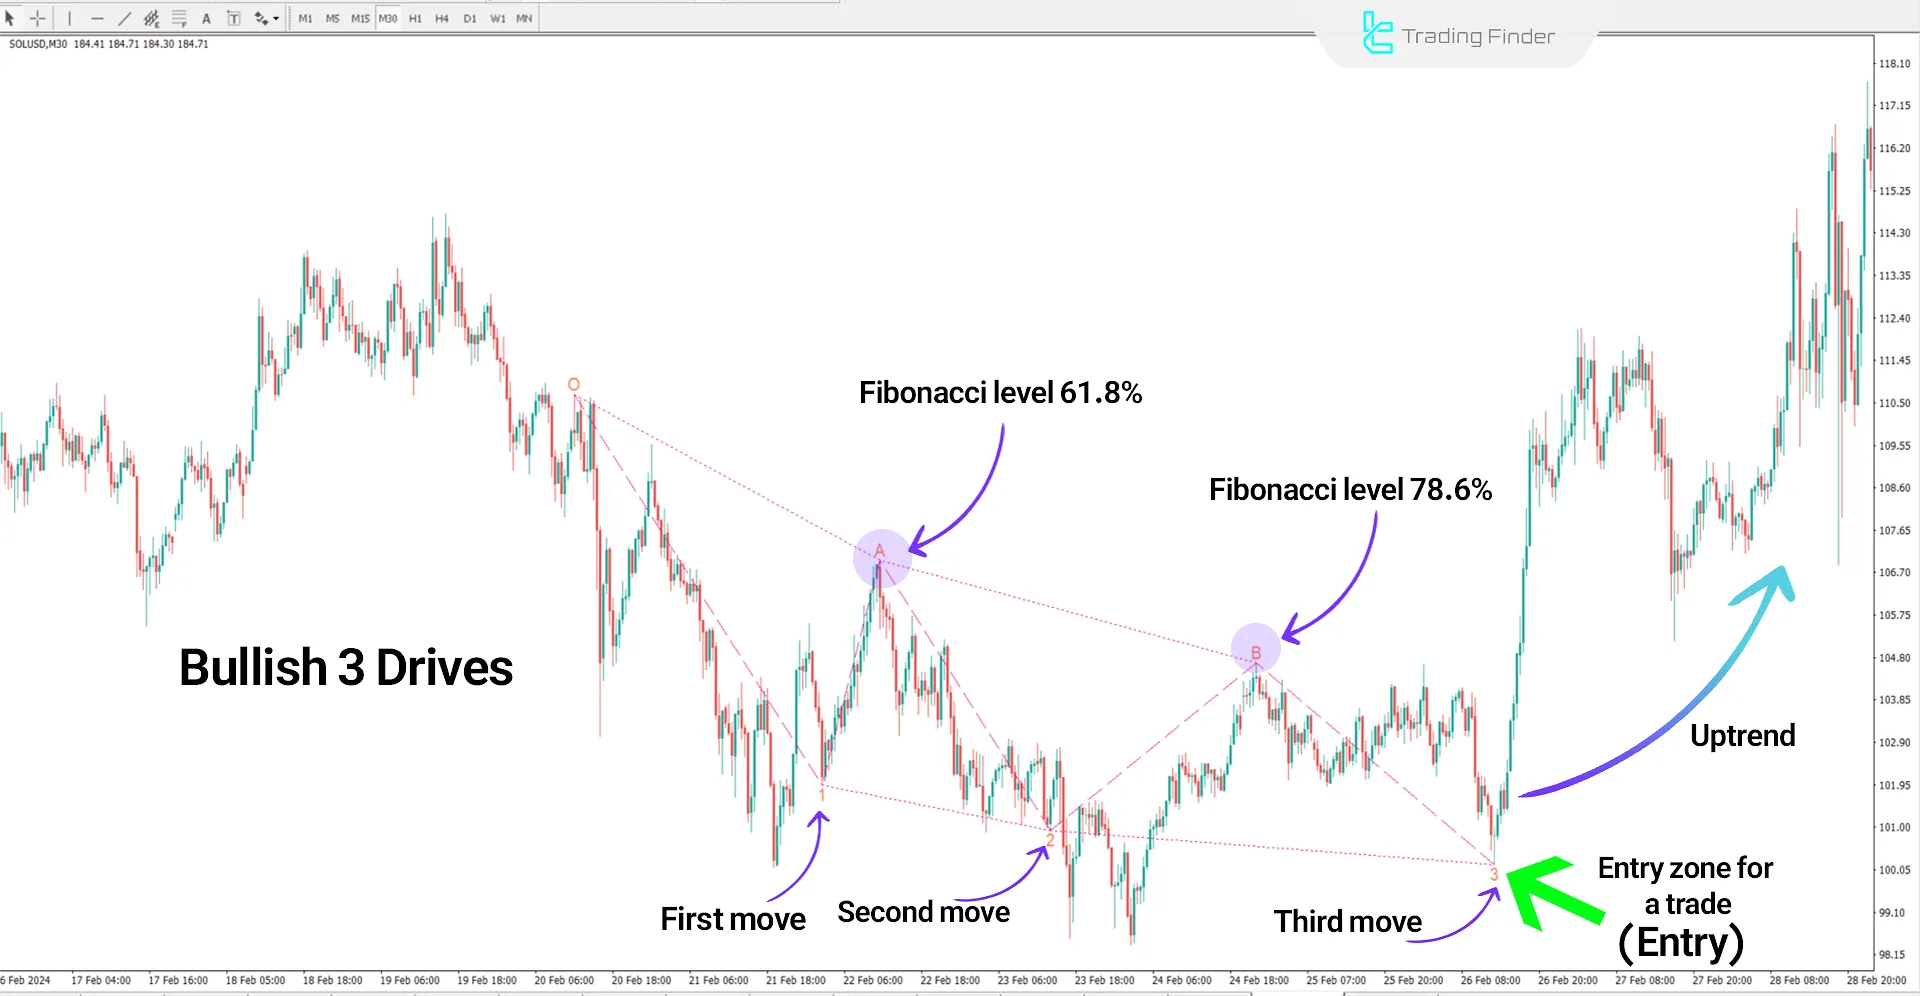
- In a bullish trend, the three main moves are downward, indicating a potential price reversal to the upside.
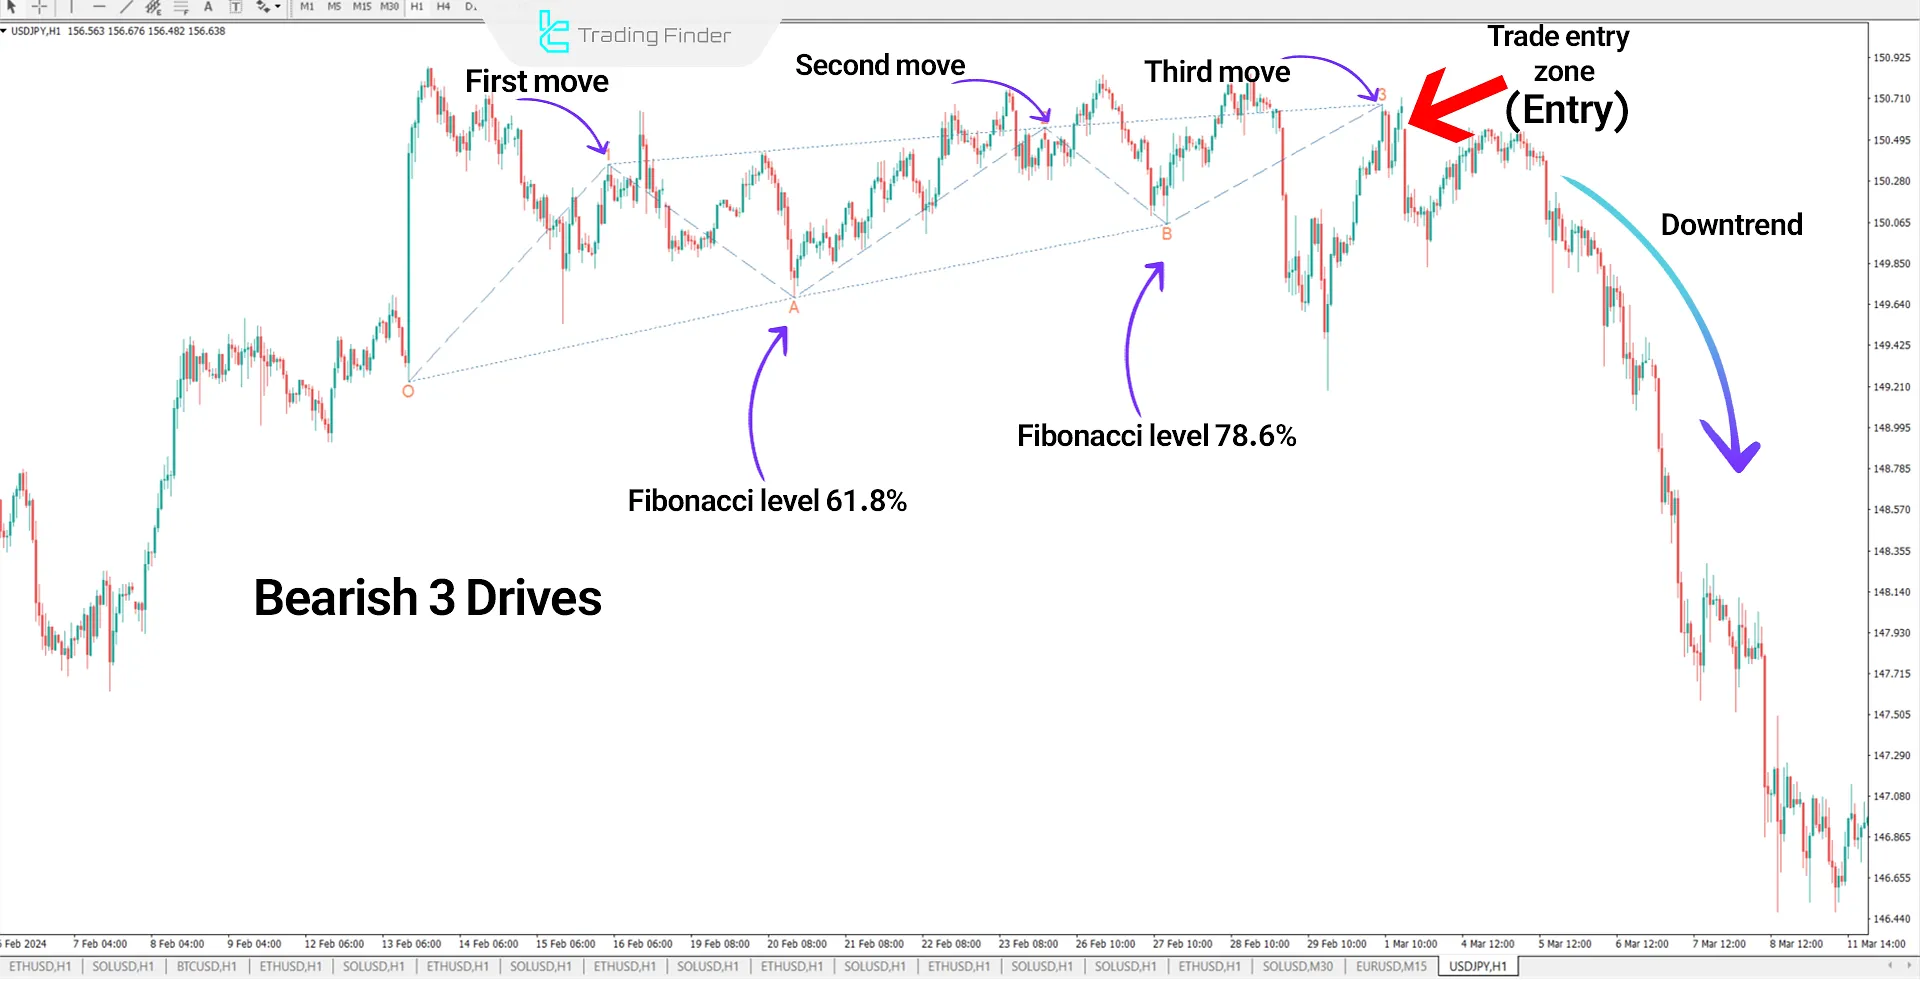
- In a bearish trend, the price forms three main upward moves, suggesting a potential price reversal downward.
Three Drives Harmonic Pattern Indicator Table
The table below provides details about the Three Drives Harmonic Pattern Indicator.
Indicator Categories: | Support & Resistance MT4 Indicators Chart & Classic MT4 Indicators Harmonic MT4 Indicators |
Platforms: | MetaTrader 4 Indicators |
Trading Skills: | Intermediate |
Indicator Types: | Reversal MT4 Indicators |
Timeframe: | Multi-Timeframe MT4 Indicators |
Trading Style: | Intraday MT4 Indicators |
Trading Instruments: | Share Stocks MT4 Indicators Forward Market MT4 Indicators Stock Market MT4 Indicators Cryptocurrency MT4 Indicators Forex MT4 Indicators |
Bullish Trend Analysis
In the Solana (SOL) cryptocurrency chart, the price initially moves downward, followed by an upward correction, reaching Point A at the Fibonacci 61.8% level of the first move.
This level acts as a resistance zone, causing the price to reverse downward. After completing the corrective move at Point B, the price extends to the 127.2% level of the B correction. This area is considered a strong reversal zone (PRZ).
Bearish Trend Analysis
In the analysis of the USD/JPY currency pair, the price initially moves upward, then corrects downward to Point A, retracing 61.8% of the initial move. Following this, the price increases and reaches Point B.
Finally, the price moves downward and falls to the 127.2% Fibonacci extension level of the B correction. Traders execute sell trades in this zone.
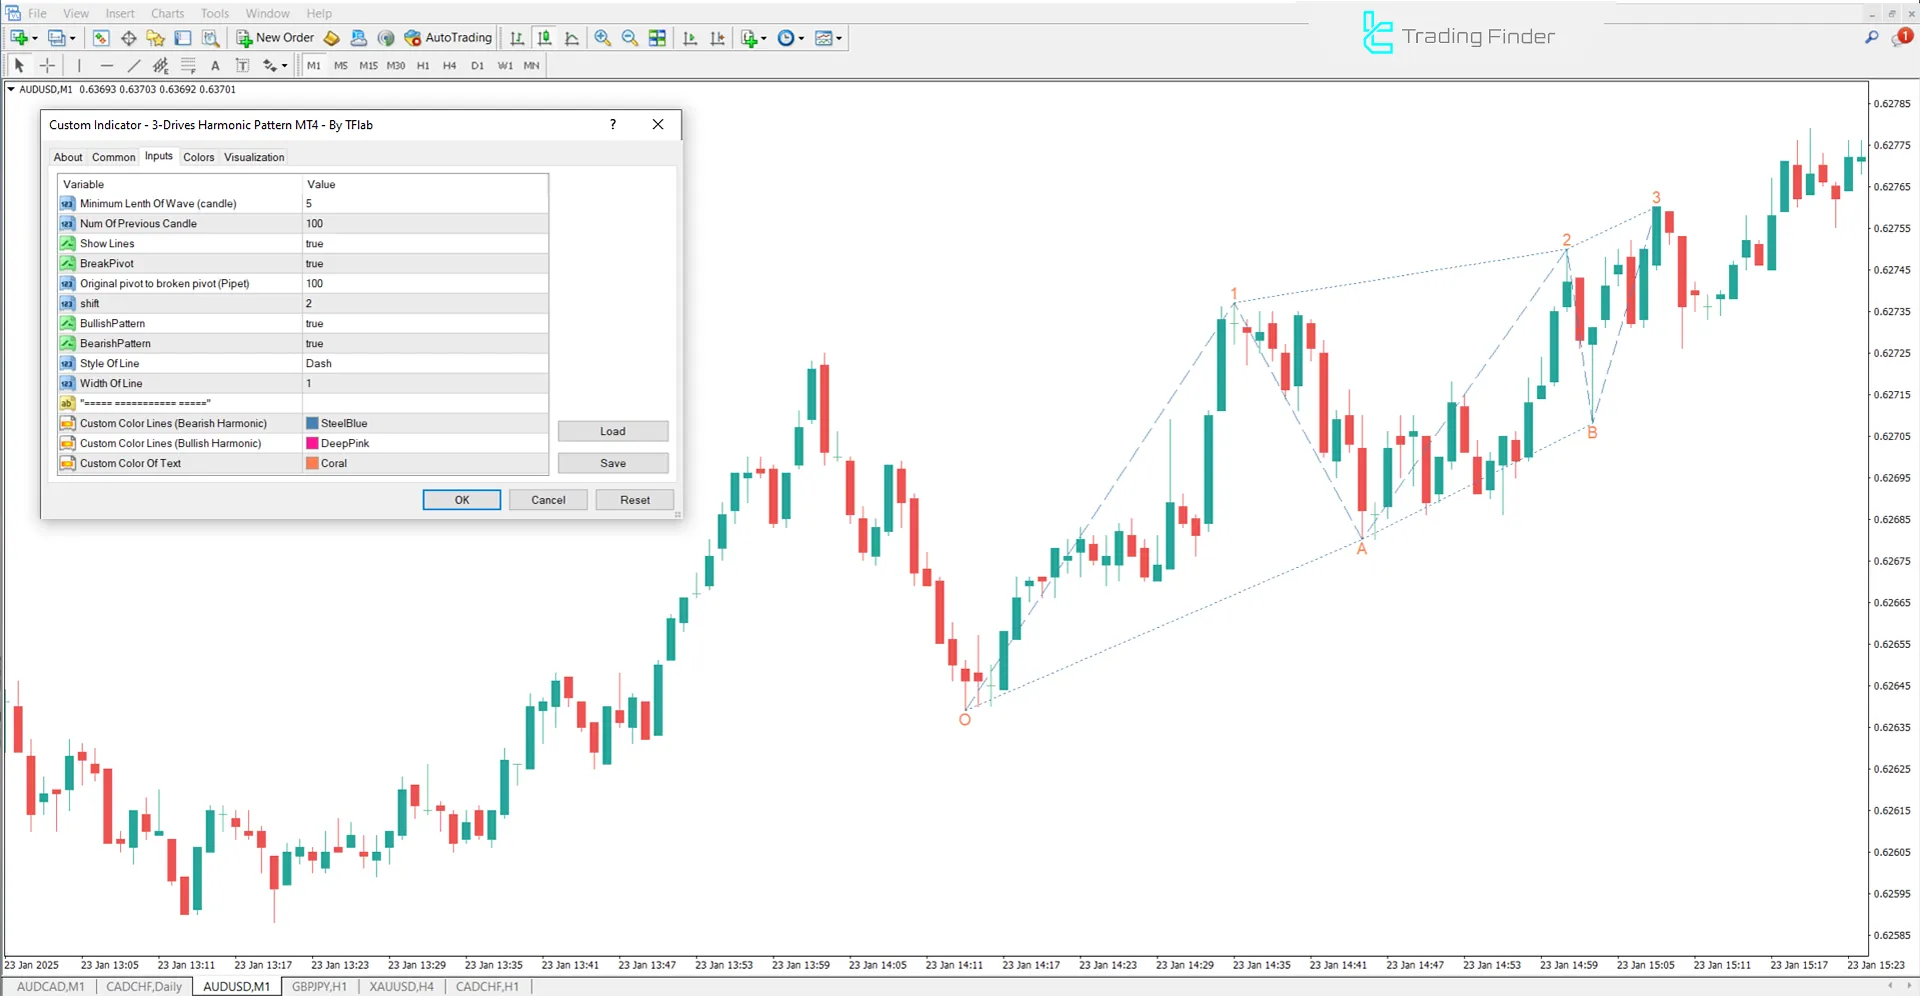
Indicator Settings
The indicator settings are displayed in the image below:
- Minimum Length of Wave (candle): Determines the number of candles required to form a wave
- Num of Previous Candles: Specifies the number of previous candles for analysis.
- Show Lines: Toggles the display of lines on or off
- Break Pivot: Displays the analysis of pivot breaks
- Original Pivot to Broken Pivot (Pipet): Sets the pivot break distance in pipettes
- Shift: Adjusts the displacement of lines on the chart
- Bullish Pattern: Enables the display of bullish patterns
- Bearish Pattern: Enables the display of bearish patterns
- Style of Line: Determines the style of lines
- Width of Line: Specifies the thickness of lines
- Custom Color Lines (Bearish Harmonic): Sets the color for bearish harmonic lines
- Custom Color Lines (Bullish Harmonic): Sets the color for bullish harmonic lines
- Custom Color of Text: Personalizes the text color
Conclusion
Harmonic patterns inspire the Three Drives Harmonic Pattern Indicator. It is a system based on price movements and Fibonacci retracement ratios, targeting the 61.8% and 127.2% levels.
The indicator allows for effective Technical analysis because it can display both bullish (uptrend) and bearish (downtrend) patterns. Key features include customizable line settings, price levels, and themes and colors.
Three Drives Harmonic Pattern MT4 PDF
Three Drives Harmonic Pattern MT4 PDF
Click to download Three Drives Harmonic Pattern MT4 PDFWhat is the Three Drives Harmonic Pattern Indicator?
It is a tool designed to identify potential reversal zones (PRZ) and belongs to the category of harmonic patterns.
How are Fibonacci ratios used in this indicator? The indicator utilizes 61.8% or 78.6% for corrections and 127.2% or 161.8% for subsequent moves to identify potential price reversal zones.


