![ABC Harmonic Pattern Indicator for MT4 - Download - [TradingFinder]](https://cdn.tradingfinder.com/image/360403/2-56-en-abc-harmonic-pattern-mt4-1.webp)
![ABC Harmonic Pattern Indicator for MT4 - Download - [TradingFinder] 0](https://cdn.tradingfinder.com/image/360403/2-56-en-abc-harmonic-pattern-mt4-1.webp)
![ABC Harmonic Pattern Indicator for MT4 - Download - [TradingFinder] 1](https://cdn.tradingfinder.com/image/360400/2-56-en-abc-harmonic-pattern-mt4-2.webp)
![ABC Harmonic Pattern Indicator for MT4 - Download - [TradingFinder] 2](https://cdn.tradingfinder.com/image/360401/2-56-en-abc-harmonic-pattern-mt4-3.webp)
![ABC Harmonic Pattern Indicator for MT4 - Download - [TradingFinder] 3](https://cdn.tradingfinder.com/image/360404/2-56-en-abc-harmonic-pattern-mt4-4.webp)
On July 1, 2025, in version 2, alert/notification and signal functionality was added to this indicator
The ABC Harmonic Pattern indicator is one of the most widely used tools in technical analysis, especially for identifying harmonic reversal patterns.
This tool detects symmetrical price structures and precise Fibonacci ratios to determine point D's potential price reversal area.
The indicator operates automatically, visually displaying the complete pattern structure on the chart with red lines.
ABC Harmonic Pattern Specifications Table
The features of the ABC Harmonic Pattern indicator are shown in the table below.
Indicator Categories: | Price Action MT4 Indicators Harmonic MT4 Indicators Candle Sticks MT4 Indicators |
Platforms: | MetaTrader 4 Indicators |
Trading Skills: | Intermediate |
Indicator Types: | Reversal MT4 Indicators |
Timeframe: | Multi-Timeframe MT4 Indicators |
Trading Style: | Day Trading MT4 Indicators |
Trading Instruments: | Forward Market MT4 Indicators Stock Market MT4 Indicators Cryptocurrency MT4 Indicators Forex MT4 Indicators |
Uptrend Conditions
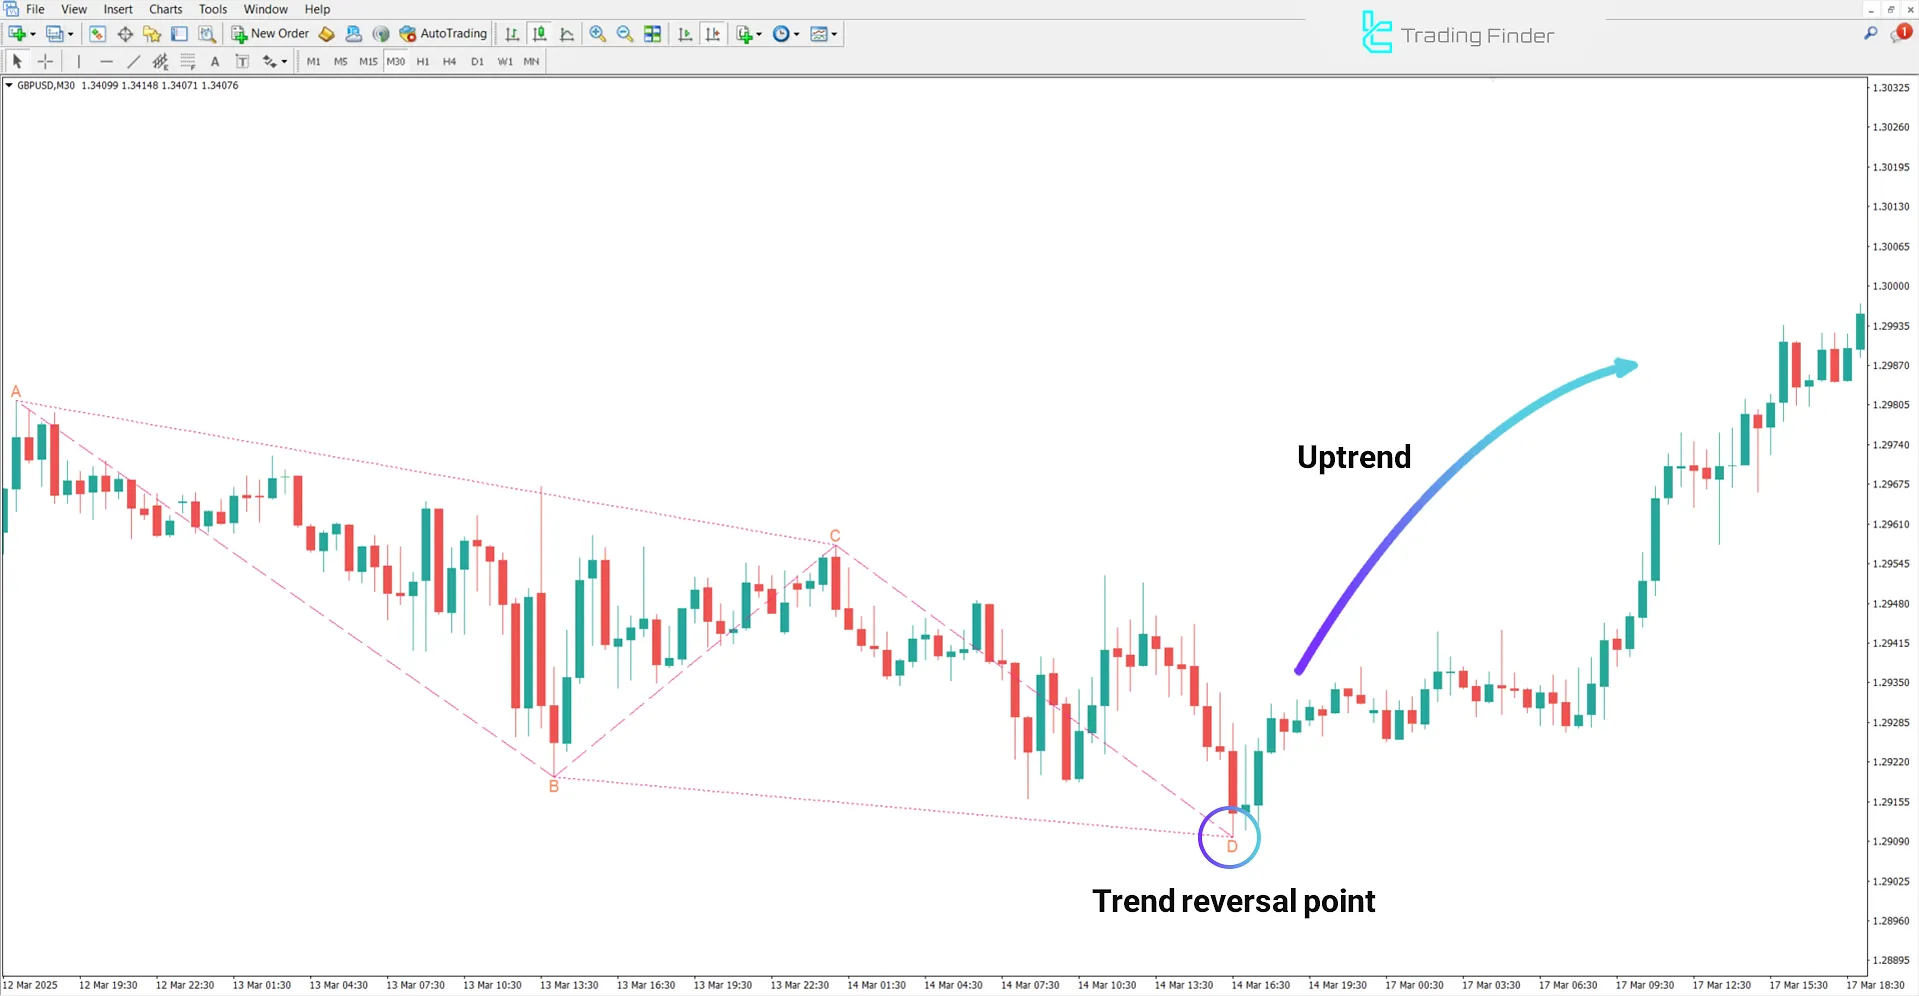
On the GBP/USD chart, the ABC Harmonic Pattern indicator identifies this pattern when the price first falls from point A to B, then retraces upward to point C and drops again to point D.
In this scenario, the price is expected to reverse from point D and form a bullish trend.

Downtrend Conditions
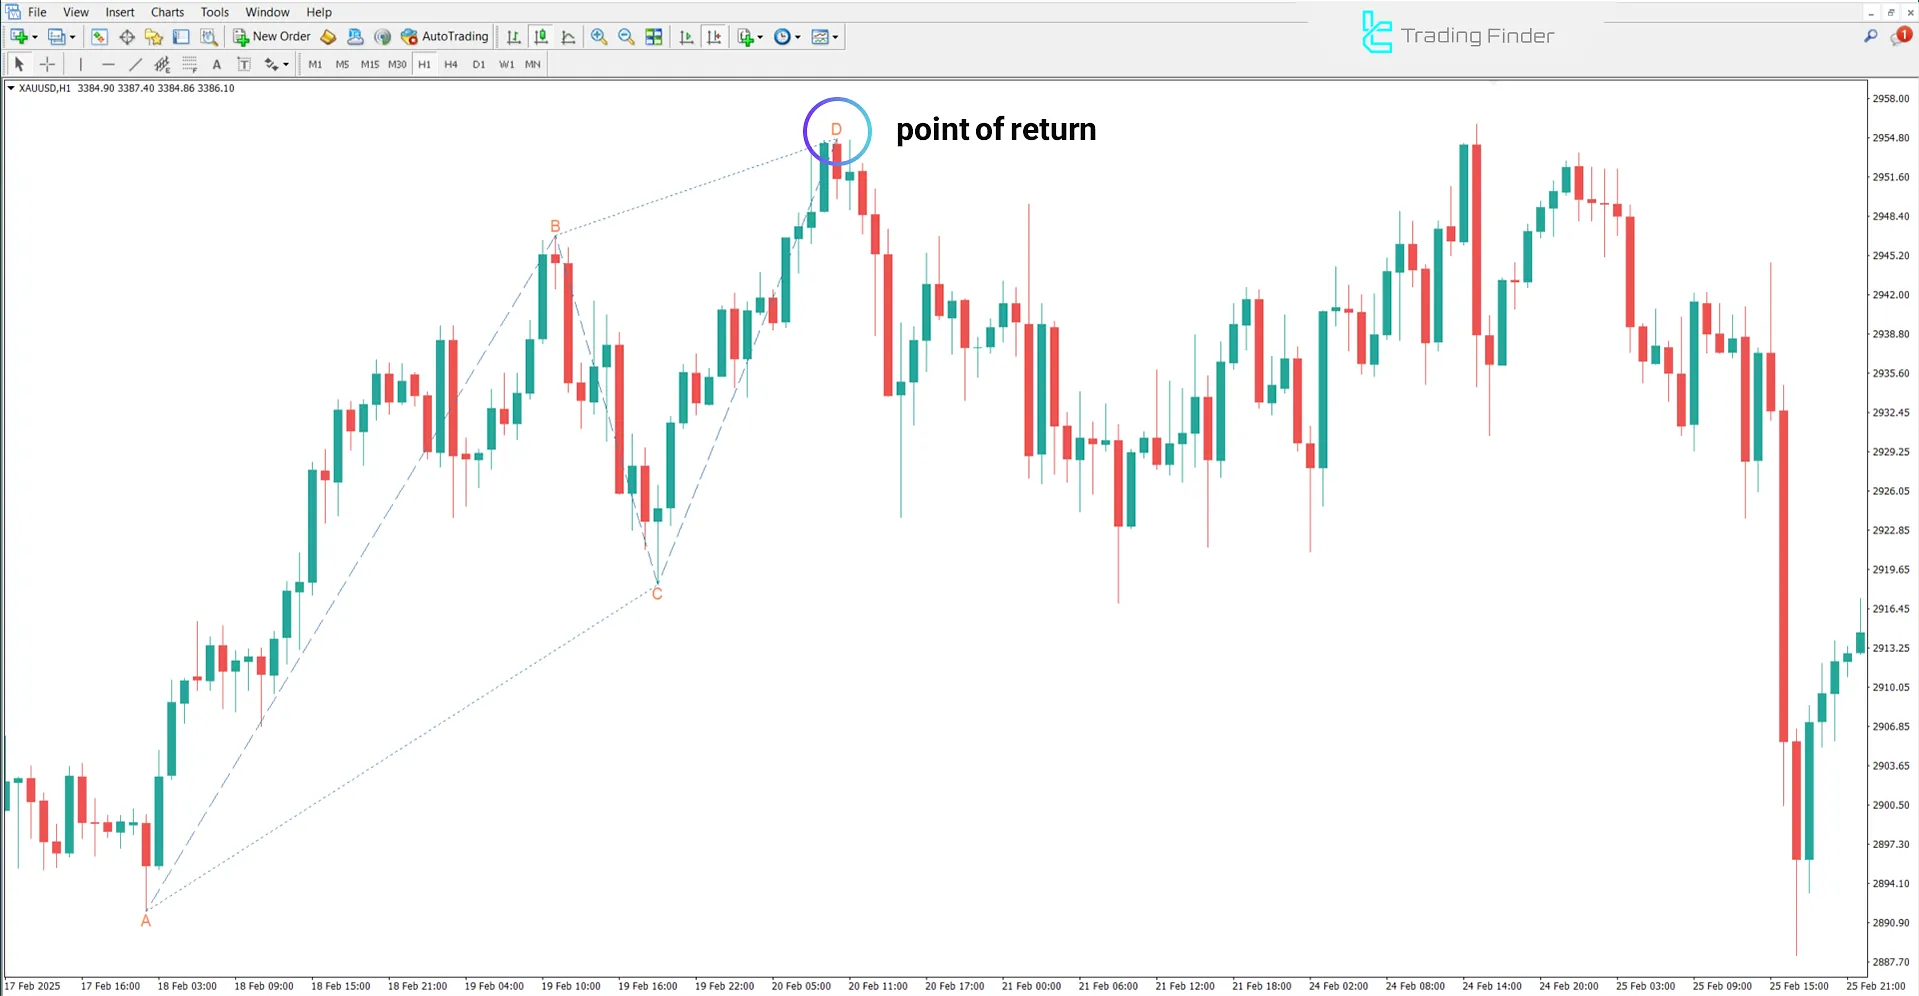
The following image shows a bearish trend on the XAU/USD (gold) price chart. Here, the price initially rises from point A to B, then retraces downward to point C; afterward, it increases again, reaching point D.
This price behavior indicates the formation of the bearish ABCD harmonic pattern. In such cases, the D zone is recognized as a potential reversal area, providing a good opportunity for entering a sell position.

Indicator Settings
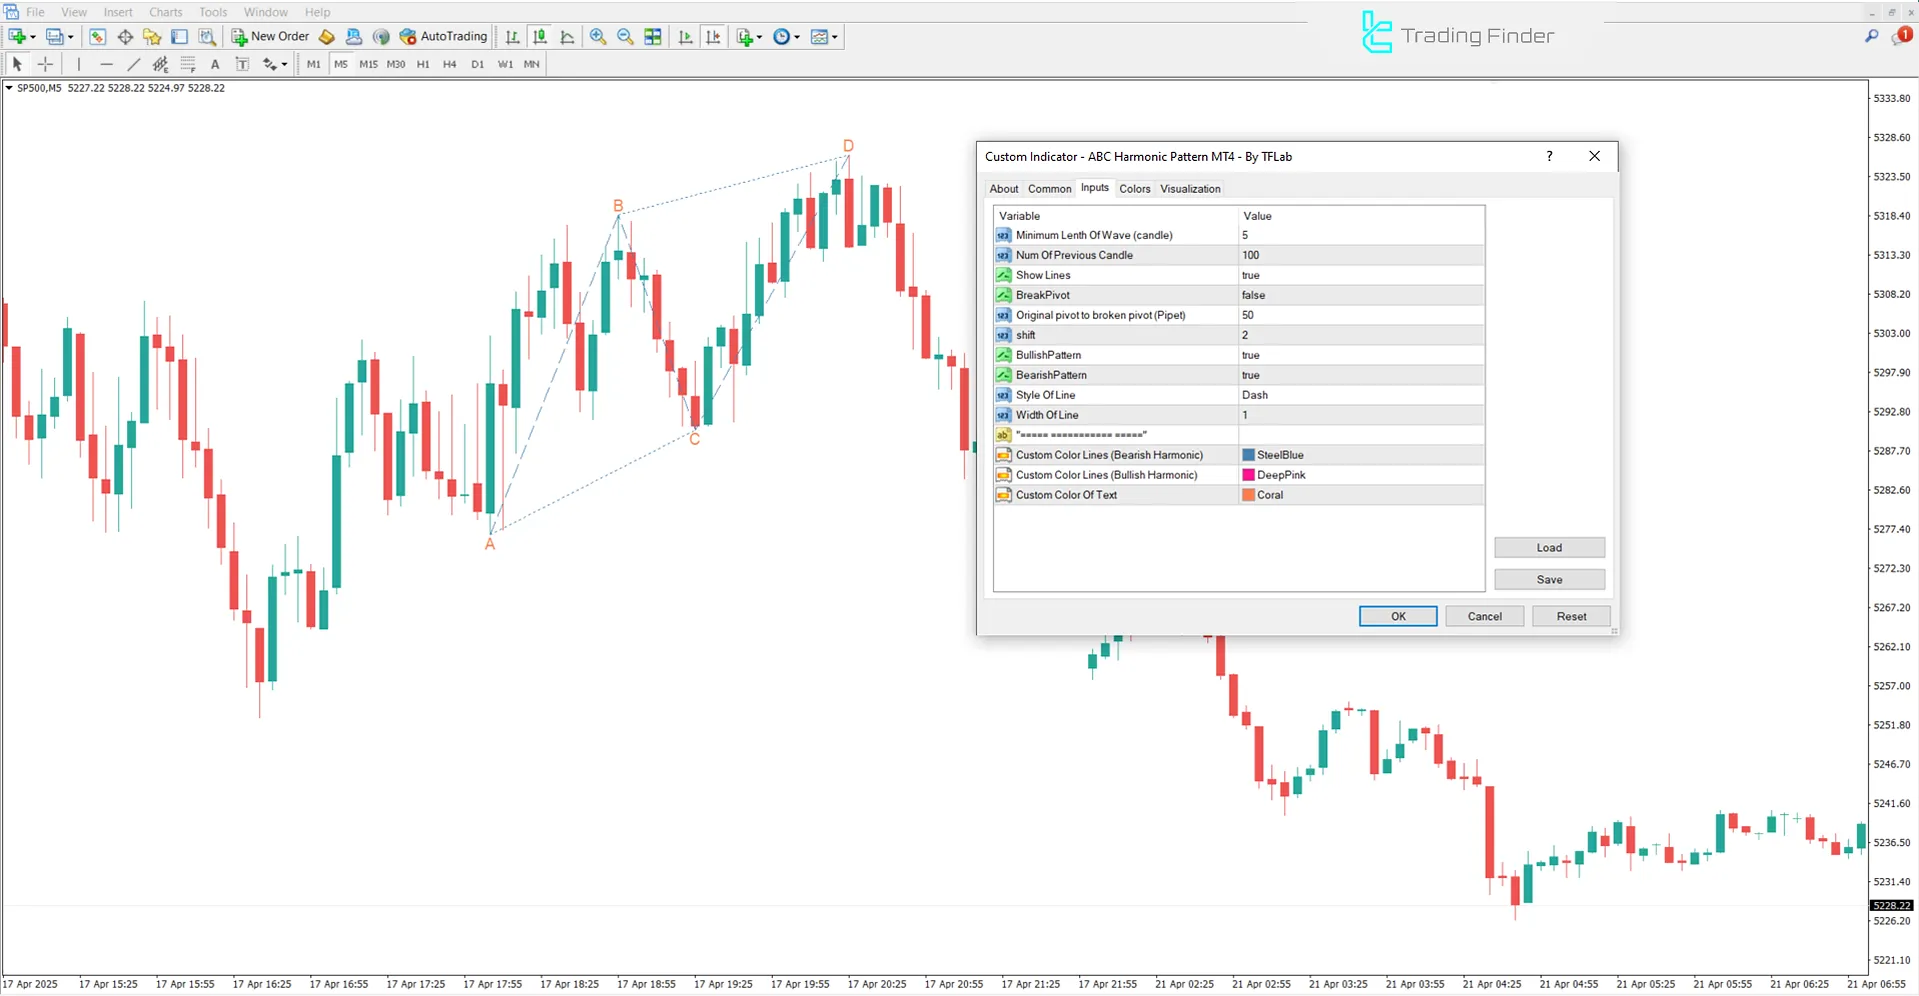
The settings for the "ABC Harmonic Pattern" indicator are shown in the image below:

- Minimum Length Of Wave (candle): Minimum wavelength (in candles)
- Num Of Previous Candle: Number of previous candles to analyze data
- Show Lines: Display pattern lines
- Break Pivot: Display Break pivot
- Original pivot to broken pivot (Pipet): Distance between original and broken pivot
- Shift: Horizontal shift
- Bullish Pattern: Enable detection of bullish patterns
- Bearish Pattern: Enable detection of bearish patterns
- Style Of Line: Style of pattern lines
- Width Of Line: Line thickness
- Custom Color Lines (Bearish Harmonic): Custom color for bearish harmonic pattern lines
- Custom Color Lines (Bullish Harmonic): Custom color for bullish harmonic pattern lines
- Custom Color Of Text: Custom color for displayed texts on the chart
Conclusion
The ABC Harmonic Pattern indicator is considered a specialized Trading Tools in technical analysis that automatically identifies potential price reversal zones using precise Fibonacci ratios and structural symmetry in price movements.
ABC Harmonic Pattern MT4 PDF
ABC Harmonic Pattern MT4 PDF
Click to download ABC Harmonic Pattern MT4 PDFWhat is the ABC Harmonic Pattern indicator?
This indicator is a specialized tool for automatically detecting the ABCD harmonic pattern in price charts.
In what types of markets does the ABCD pattern indicator perform best?
This trading tool performs more accurately in volatile markets or after the end of a strong trend.


