![Absolute Strength Histogram Indicator in MT4 – Free Download [TradingFinder]](https://cdn.tradingfinder.com/image/546289/2-143-en-absolute-strength-histogram-mt4-1.webp)
![Absolute Strength Histogram Indicator in MT4 – Free Download [TradingFinder] 0](https://cdn.tradingfinder.com/image/546289/2-143-en-absolute-strength-histogram-mt4-1.webp)
![Absolute Strength Histogram Indicator in MT4 – Free Download [TradingFinder] 1](https://cdn.tradingfinder.com/image/546286/2-143-en-absolute-strength-histogram-mt4-2.webp)
![Absolute Strength Histogram Indicator in MT4 – Free Download [TradingFinder] 2](https://cdn.tradingfinder.com/image/546287/2-143-en-absolute-strength-histogram-mt4-3.webp)
![Absolute Strength Histogram Indicator in MT4 – Free Download [TradingFinder] 3](https://cdn.tradingfinder.com/image/546288/2-143-en-absolute-strength-histogram-mt4-4.webp)
The Absolute Strength Histogram (ASH) oscillator is one of the widely used indicators in technical analysis, used to measure trend strength and generate buy and sell signals.
This tool is displayed in the form of a histogram in a separate window and, by changing the color of the bars, identifies the strength of buyers and sellers.
Additionally, the crossover of signal lines in this indicator indicates trend and momentum changes, providing a valid signal for entering or exiting trades.
Absolute Strength Histogram Indicator Table
The general feature of the Absolute Strength Histogram Indicator is presented in the table below:
Indicator Categories: | Oscillators MT4 Indicators Currency Strength MT4 Indicators Momentum Indicators in MT4 |
Platforms: | MetaTrader 4 Indicators |
Trading Skills: | Intermediate |
Indicator Types: | Reversal MT4 Indicators |
Timeframe: | Multi-Timeframe MT4 Indicators |
Trading Style: | Intraday MT4 Indicators |
Trading Instruments: | Share Stocks MT4 Indicators Indices Market MT4 Indicators Commodity Market MT4 Indicators Stock Market MT4 Indicators Cryptocurrency MT4 Indicators Forex MT4 Indicators |
Absolute Strength Histogram Indicator at a Glance
The Absolute Strength Histogram Indicator is a trading tool that measures market trend strength and momentum.
This indicator combines histograms and signal lines to display bullish and bearish trend strength as follows:
- Green histogram: When the bullish signal line is above the bearish line, it indicates buyer strength and continuation of the uptrend;
- Red histogram: When the bearish signal line is above the bullish line, it shows seller dominance and strengthening of the downtrend.
Indicator in Bullish Trend
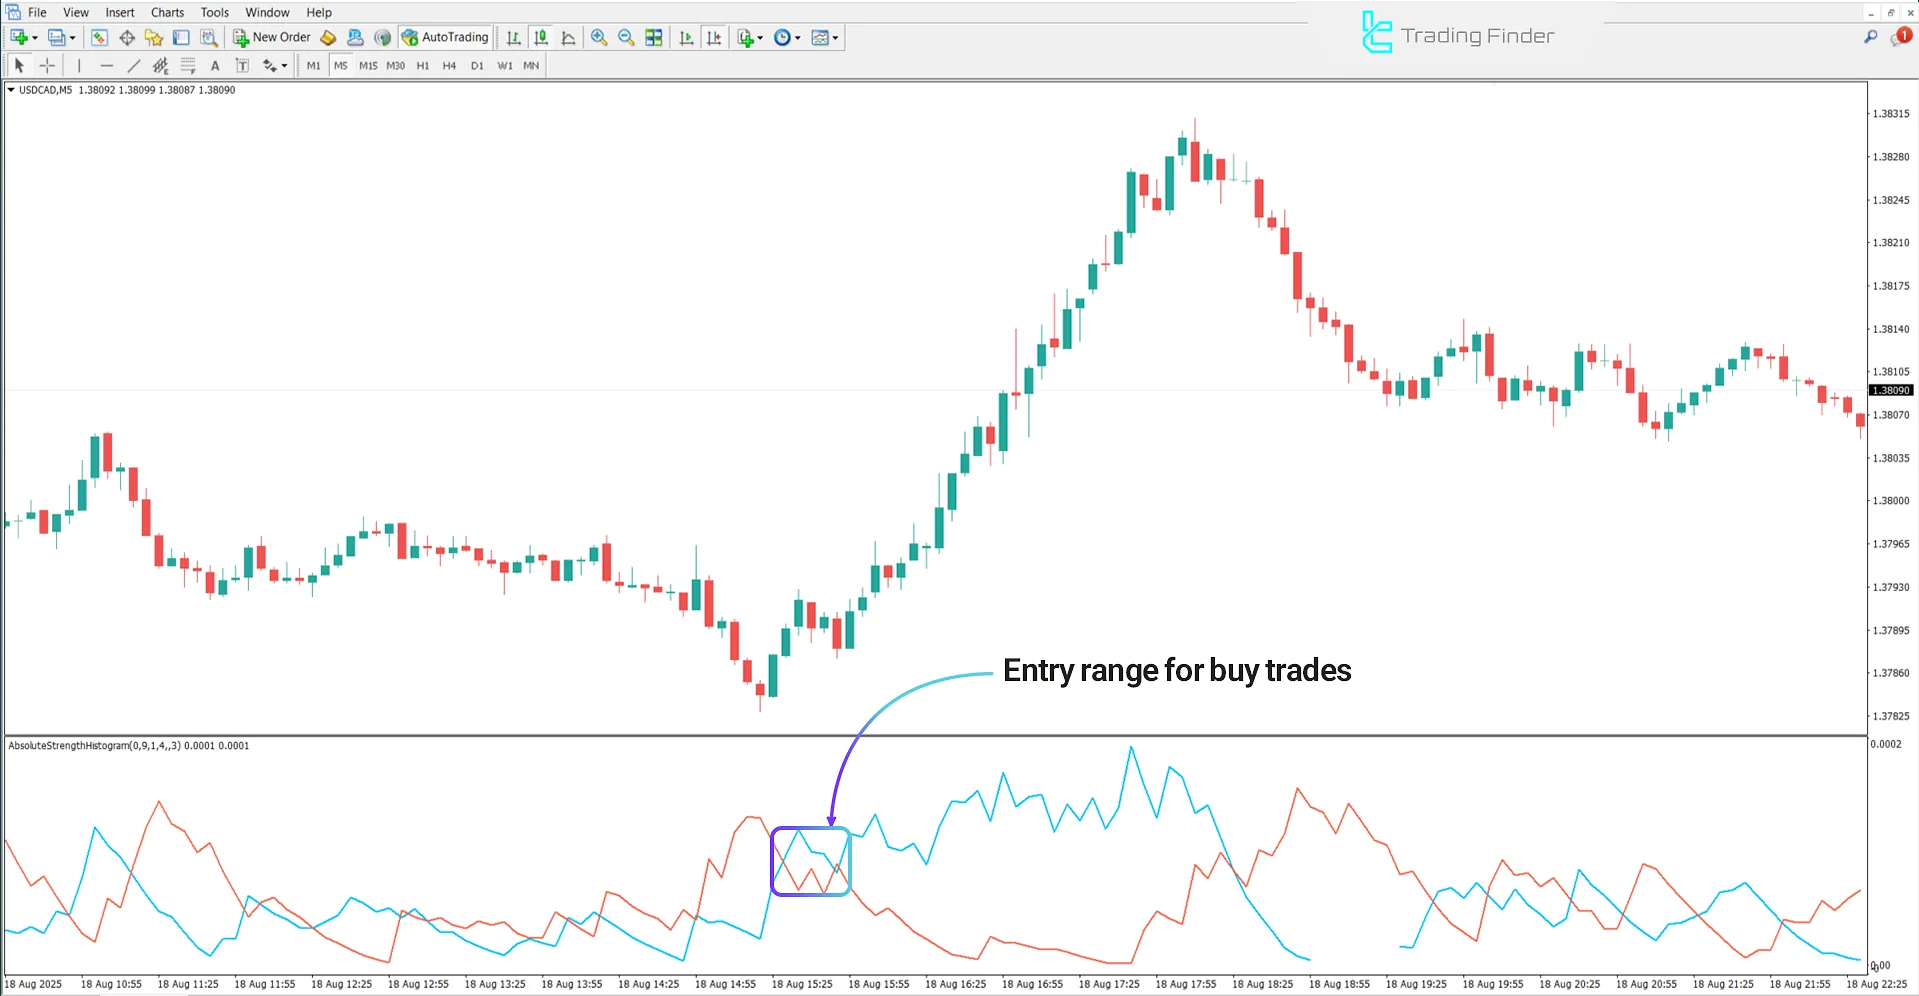
The price chart below shows the US Dollar against the Canadian Dollar pair with symbol (USD/CAD) on the 5-minute timeframe.
When the market enters the bullish phase, this trading tool provides the following signals:
- The histogram color changes to green, indicating buyer pressure;
- The blue signal line crosses the orange line from below and moves above it;
- The height of the blue bars increases, reflecting stronger buyer momentum.
In these conditions, a suitable zone for entering Buy trades is formed.

Indicator in Bearish Trend
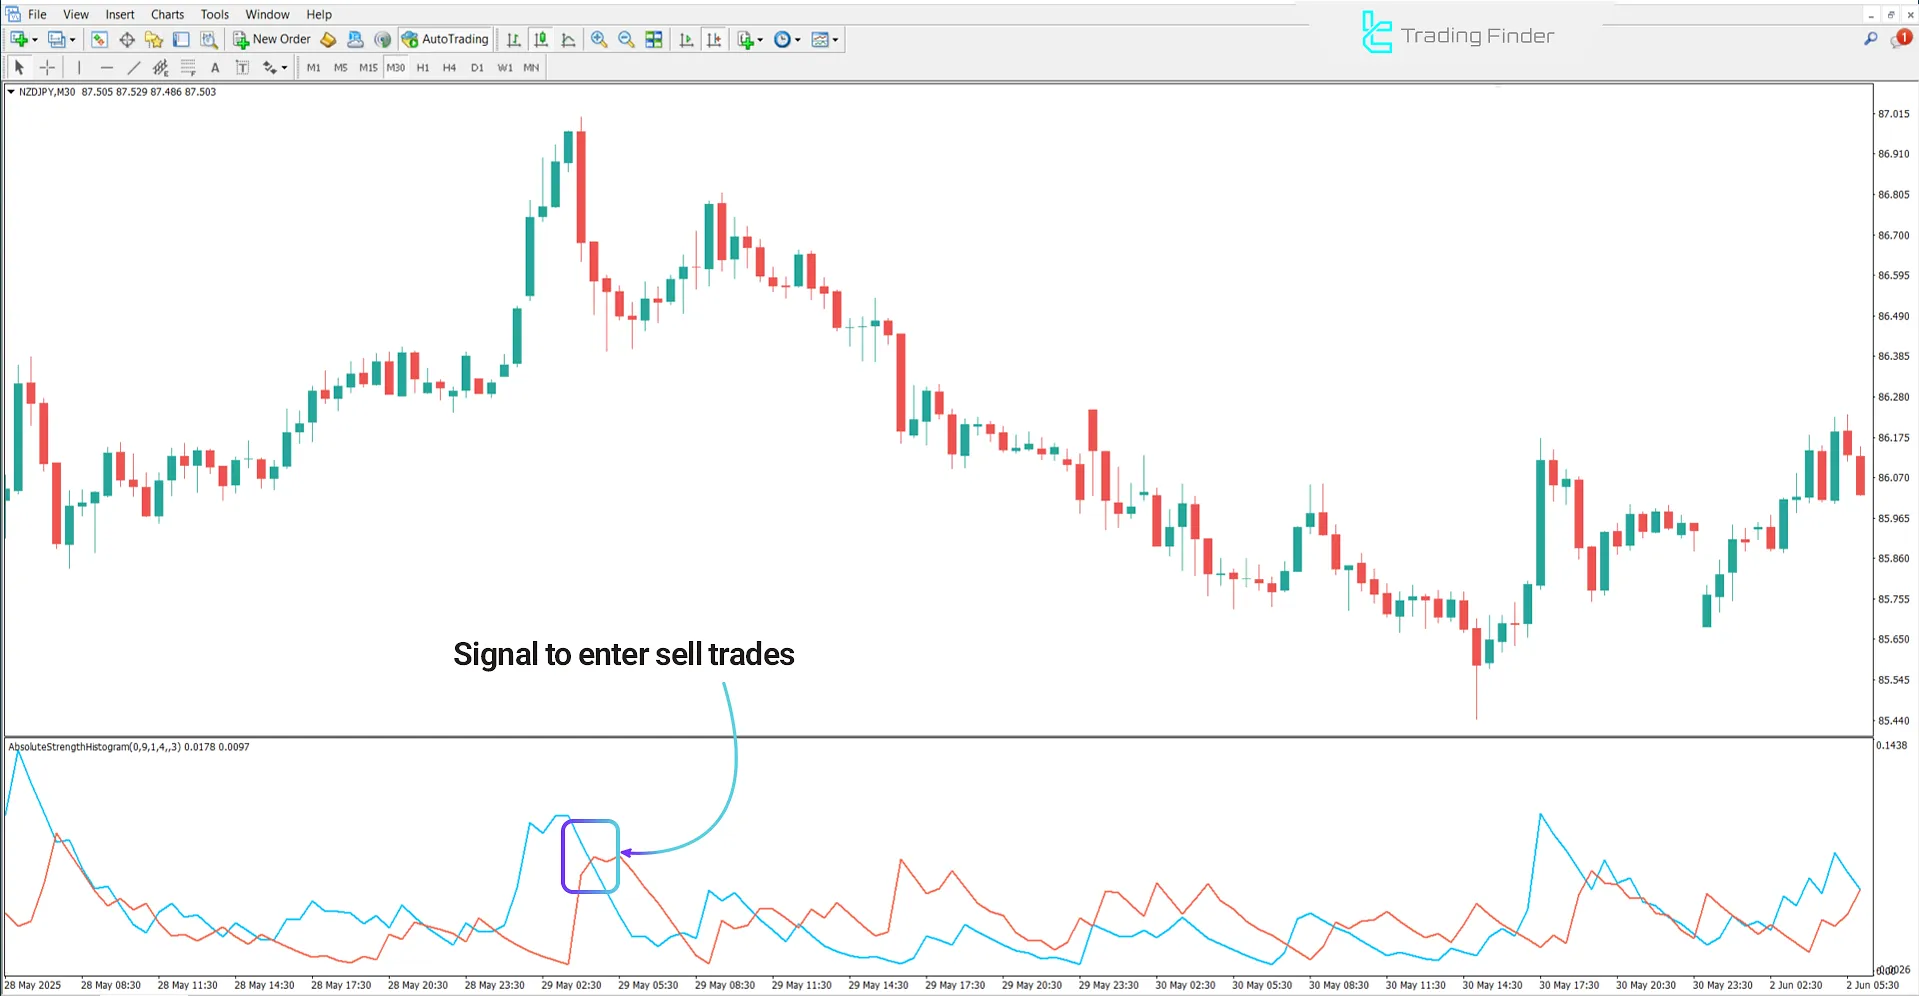
The price chart below shows the New Zealand Dollar against the Japanese Yen pair with symbol (NZD/JPY) on the 30-minute timeframe.
In the bearish trend, the Absolute Strength Histogram Indicator displays selling pressure and supply pressure with the histogram turning red.
At the same time, the red signal line being above the green line confirms stronger seller dominance and continuation of the market’s downward move. Under these
conditions, the higher the red bars rise, the stronger the selling pressure and the more powerful the downtrend will be.

Absolute Strength Histogram Settings
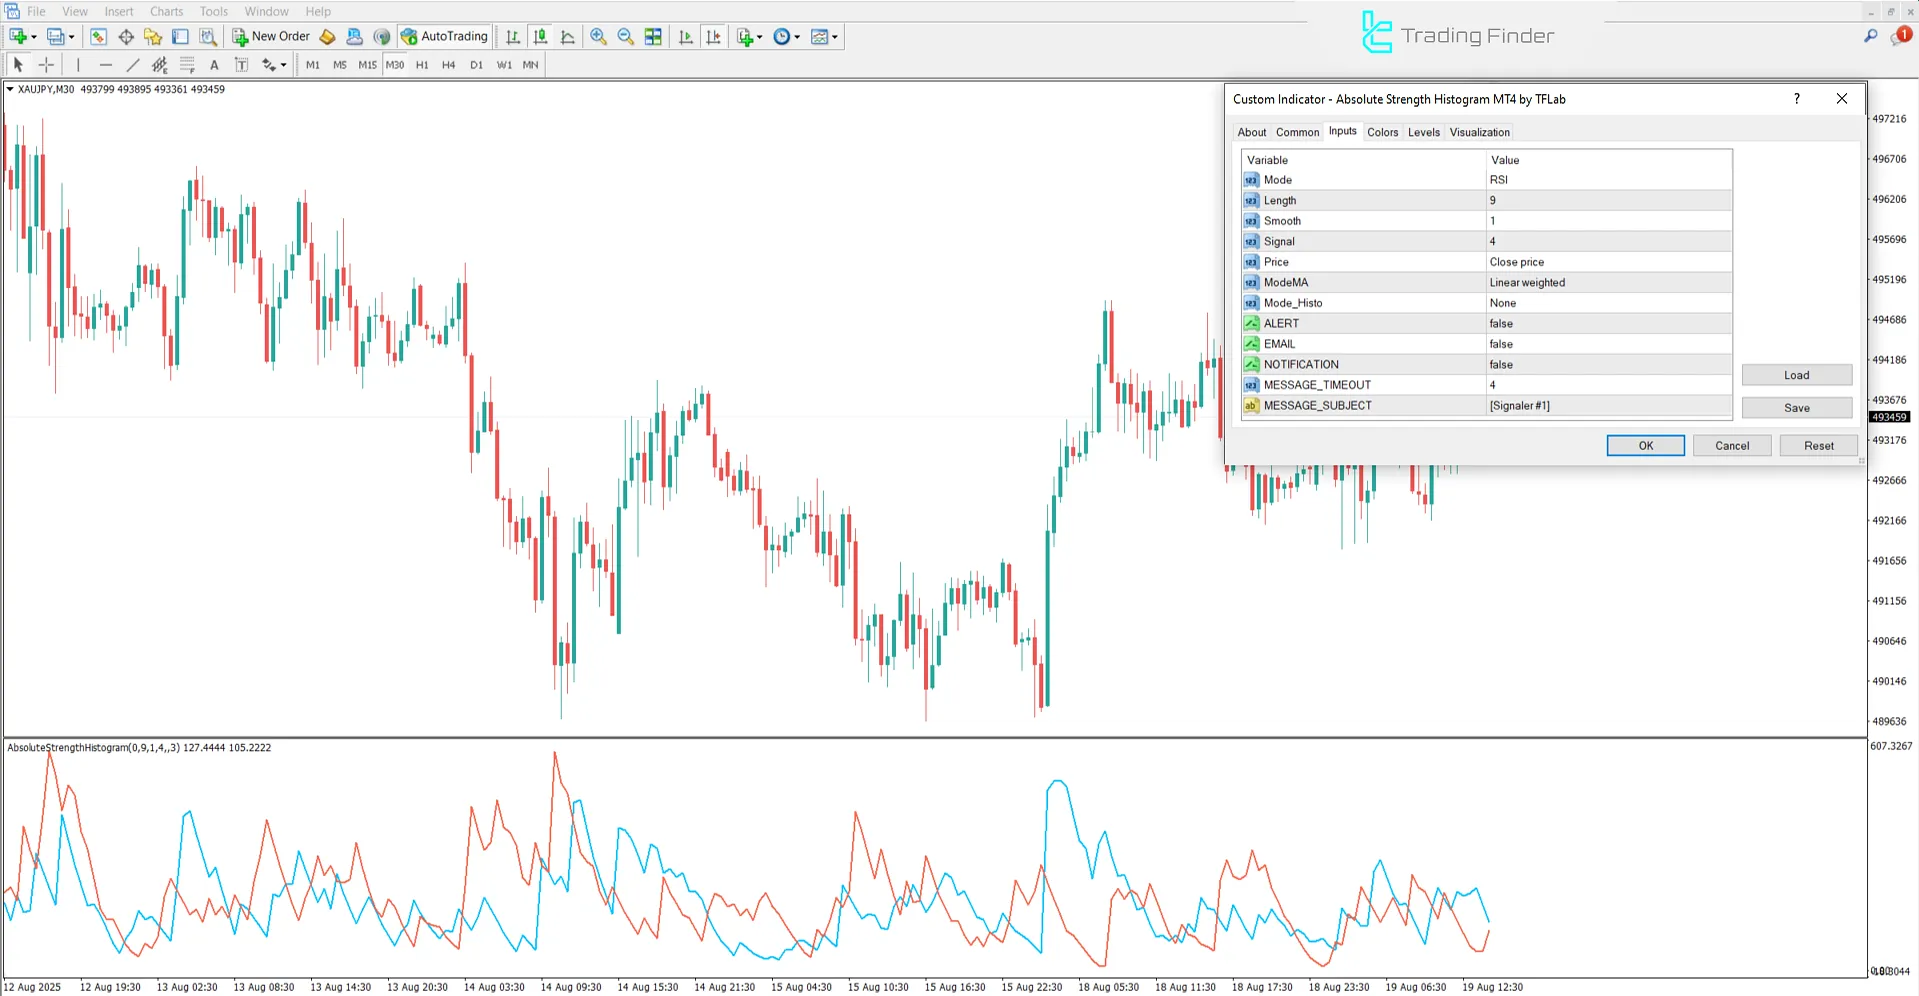
The image below shows the settings panel of the Absolute Strength Histogram Indicator in the MetaTrader 4 platform:

- Mode: Relative Strength Index calculation mode
- Length: Calculation period length
- Smooth: Smoothing coefficient
- Signal: Signal period length
- Price: Type of price used
- ModeMA: Type of moving average
- Mode_Histo: Histogram display mode
- ALERT: Provide alert
- EMAIL: Send signal to email
- NOTIFICATION: Send notification in the platform
- MESSAGE_TIMEOUT: Message timing
- MESSAGE_SUBJECT: Message subject
Conclusion
The Absolute Strength Histogram Indicator (ASH) is a suitable tool for measuring trend strength and direction, as well as identifying bullish or bearish market conditions, utilizing histograms and signal lines.
This indicator provides reliable entry and exit trade signals with color changes and line crossovers.
Absolute Strength Histogram Indicator in MT4 PDF
Absolute Strength Histogram Indicator in MT4 PDF
Click to download Absolute Strength Histogram Indicator in MT4 PDFWhat is the application of the Absolute Strength Histogram Indicator?
This indicator shows trend strength and identifies entry and exit trade points through histogram color changes and signal line crossovers.
Is the Absolute Strength Histogram Indicator suitable for all timeframes?
Yes, this indicator can be used across all timeframes, from short-term (M15, M30, H1) to long-term (daily, weekly, and monthly).


