![Adaptive RSI indicator for MetaTrader 4 Download - Free - [TradingFinder]](https://cdn.tradingfinder.com/image/140608/11-50-en-adaptive-rsi-mt4-01.webp)
![Adaptive RSI indicator for MetaTrader 4 Download - Free - [TradingFinder] 0](https://cdn.tradingfinder.com/image/140608/11-50-en-adaptive-rsi-mt4-01.webp)
![Adaptive RSI indicator for MetaTrader 4 Download - Free - [TradingFinder] 1](https://cdn.tradingfinder.com/image/140605/11-50-en-adaptive-rsi-mt4-02.webp)
![Adaptive RSI indicator for MetaTrader 4 Download - Free - [TradingFinder] 2](https://cdn.tradingfinder.com/image/140606/11-50-en-adaptive-rsi-mt4-03.webp)
![Adaptive RSI indicator for MetaTrader 4 Download - Free - [TradingFinder] 3](https://cdn.tradingfinder.com/image/140604/11-50-en-adaptive-rsi-mt4-04.webp)
The Adaptive RSI indicator is an advanced and practical tool designed for traders who use the RSI indicator to analyze charts and identify price trends. This MT4 indicator is an enhanced version of the RSI oscillator and is available.
Key features of this indicator include:
- Utilizing RSI with a unique algorithm to identify market trends;
- Providing more accurate market conditions and practical signals for traders;
- Optimizing analysis by adapting to rapid or gradual changes in market trends.
With the Adaptive RSI indicator, traders can enhance their analysis and make better trading decisions based on more precise and optimized signals. This indicator is especially suitable for identifying entry and exit points in the market and assessing overbought and oversold levels.
Indicator Table
Indicator Categories: | Oscillators MT4 Indicators Signal & Forecast MT4 Indicators Currency Strength MT4 Indicators Trading Assist MT4 Indicators RSI Indicators for MetaTrader 4 |
Platforms: | MetaTrader 4 Indicators |
Trading Skills: | Elementary |
Indicator Types: | Leading MT4 Indicators Entry and Exit MT4 Indicators |
Timeframe: | Multi-Timeframe MT4 Indicators |
Trading Style: | Day Trading MT4 Indicators Scalper MT4 Indicators |
Trading Instruments: | Indices Market MT4 Indicators Cryptocurrency MT4 Indicators Forex MT4 Indicators |
Indicator Overview
The Adaptive RSI indicator is an advanced and enhanced version of the Relative Strength Index (RSI) that increases RSI fluctuation accuracy using a unique algorithm.
This tool reduces unnecessary fluctuations and provides more accurate signals, enabling traders to perform better and more optimized analyses.
A standout feature of this indicator is its improved performance in identifying price trends, making it an ideal option for traders seeking reliable signals.
Users can use the Adaptive RSI to identify bullish and bearish trends with greater precision and make smarter decisions.
Advantages of the Adaptive RSI Indicator:
- More accurate analysis: Reducing errors caused by random fluctuations
- Optimized performance: Providing more reliable signals compared to the classic RSI
- Trend identification: Delivering precise information about market movements
This indicator is suitable for traders seeking advanced analytical tools and can help improve trading strategies.
Uptrend in Oscillator

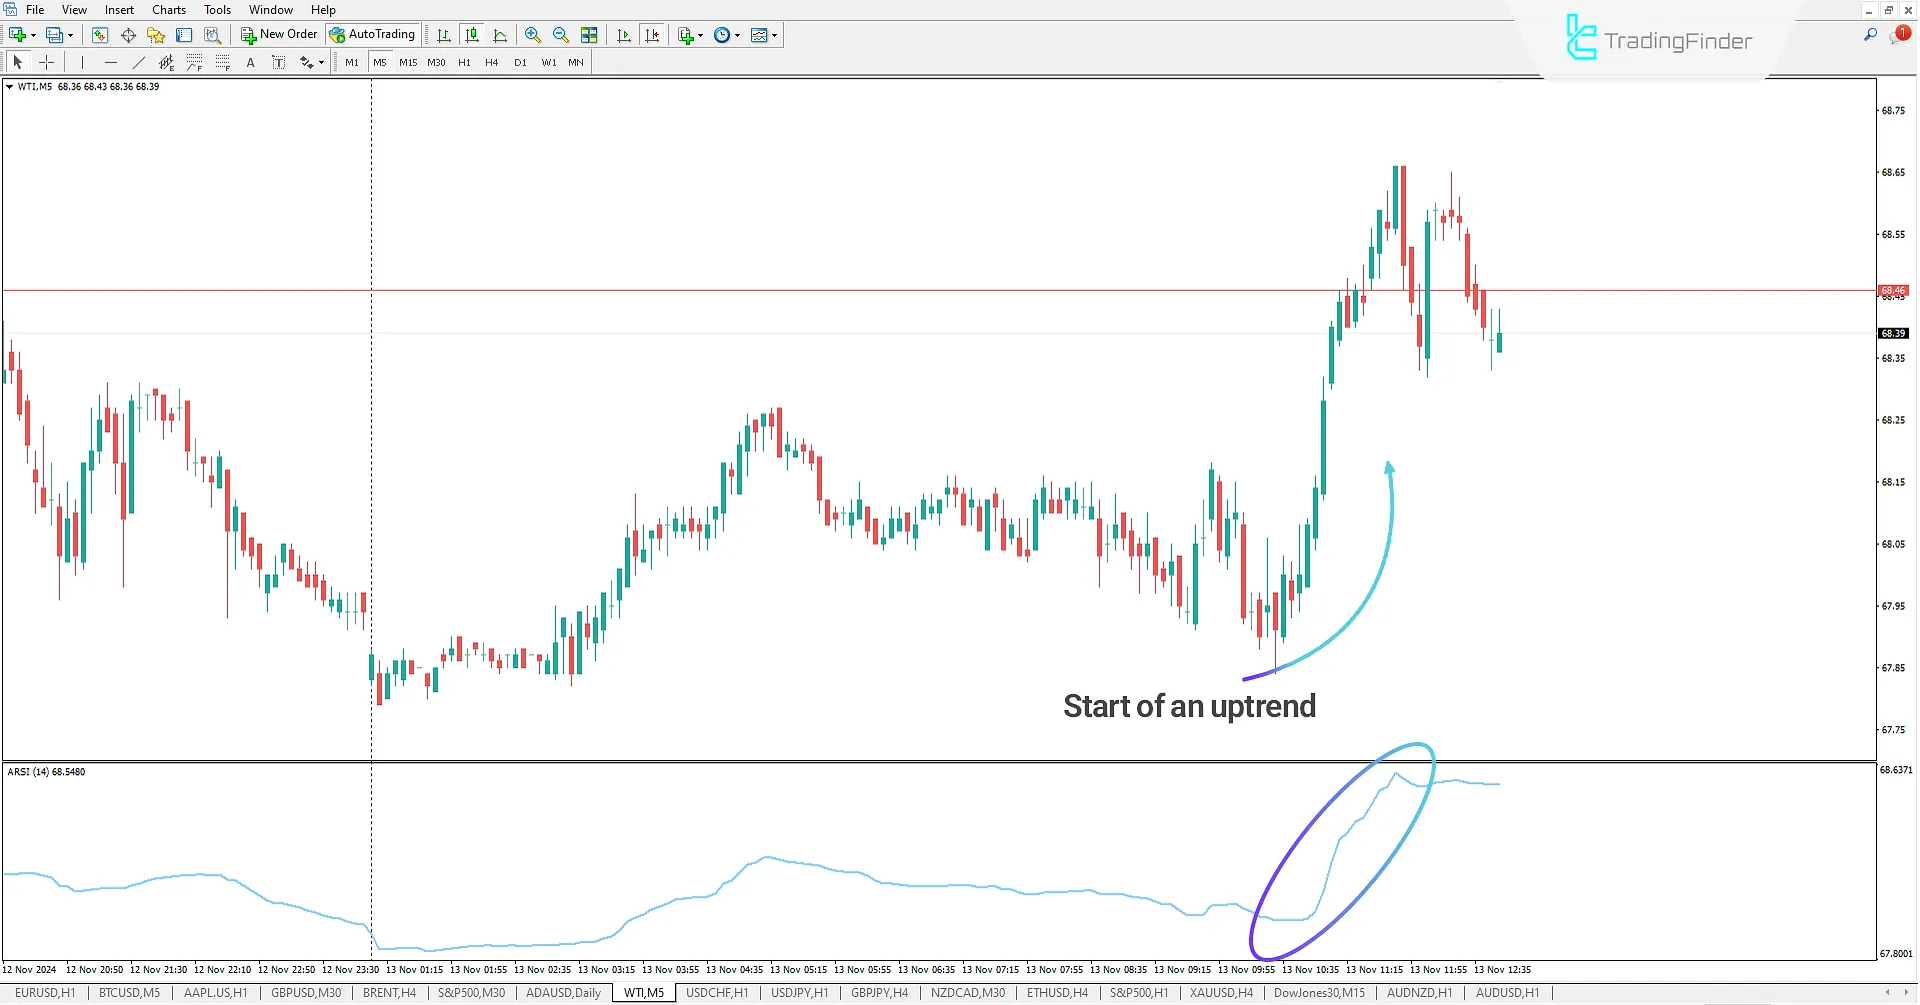
In the 5-minute WTI chart, the price enters an uptrend following a correction. The RSI indicator moves upward in this scenario, signaling price growth and confirming the market's bullish movement.
As the trend continues, the RSI enters the oversold zone. This condition typically warns traders of a potential price reversal or upward correction. The oversold zone indicates excessiveselling pressure in the market, which may lead to a price increase.
Downtrend in Indicator

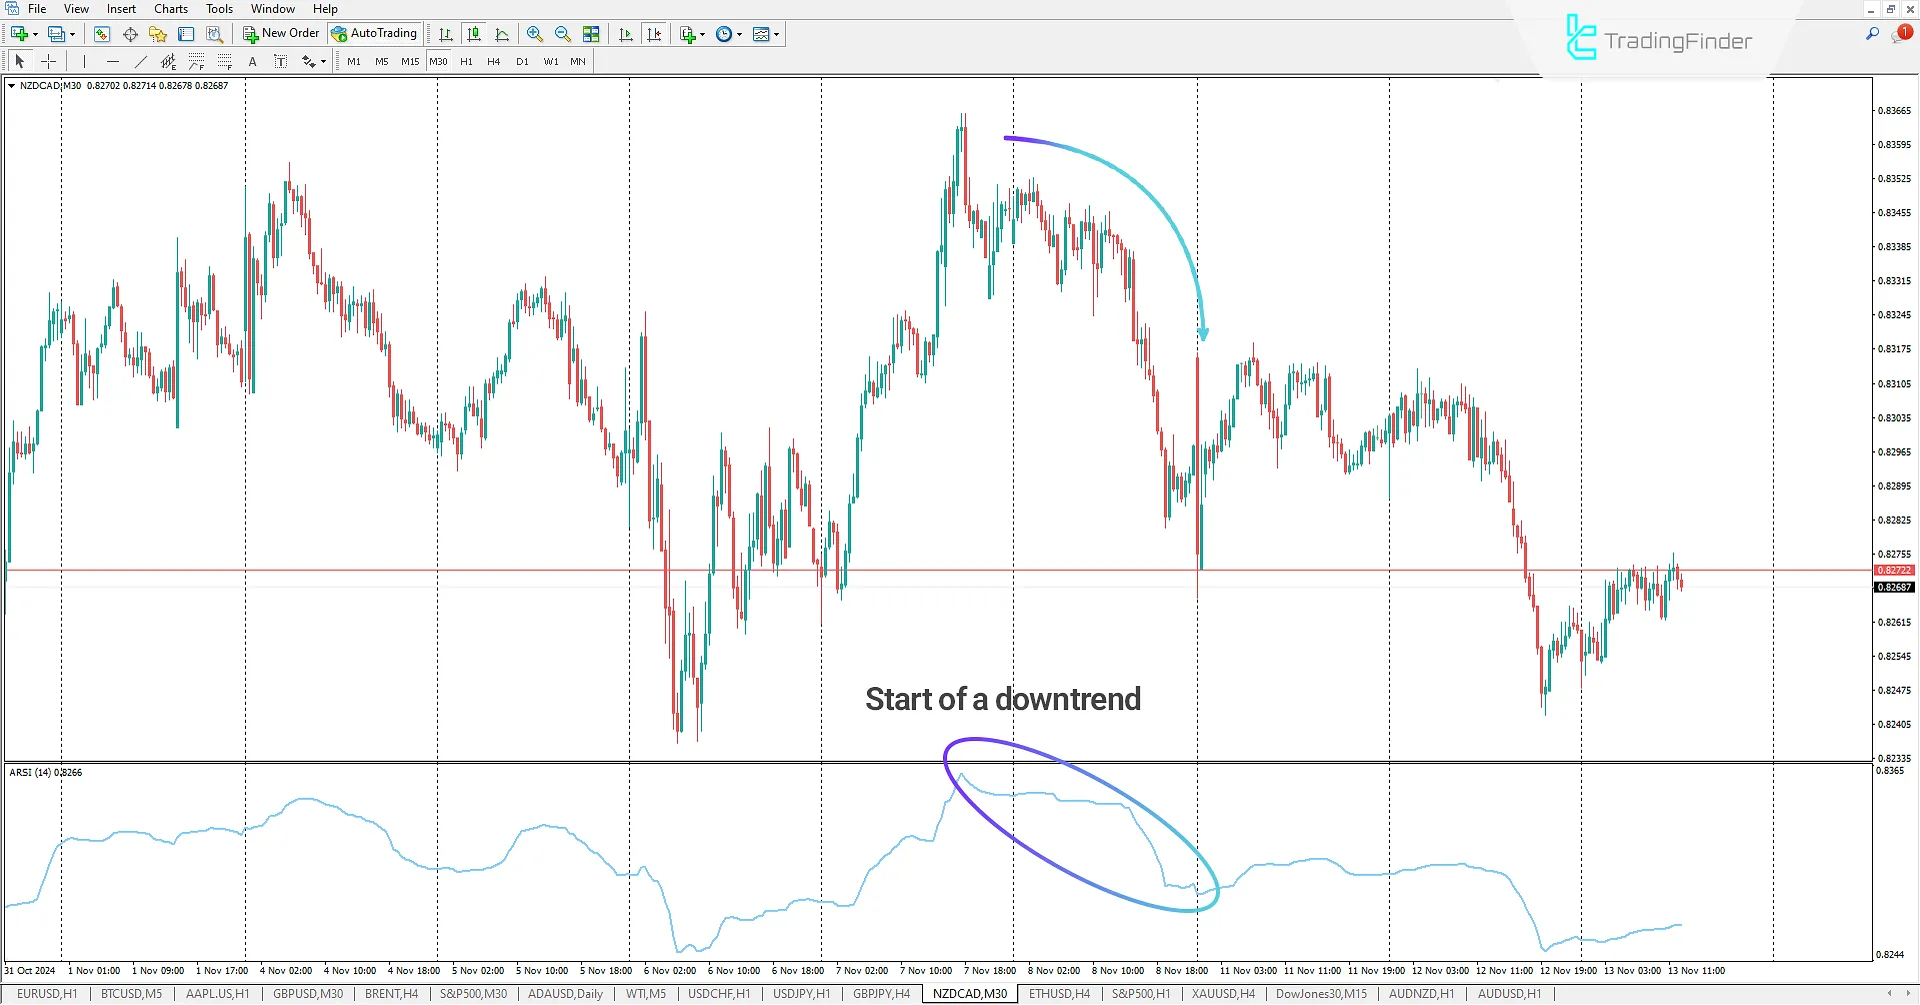
In the 30-minute NZD/CAD chart, the Adaptive RSI indicator enters the overbought zone after an upward trend. This situation indicates strong demand and a potential price reversal.
As the RSI reaches its maximum overbought level, the price begins to change direction, entering a downtrend. The indicator confirms this price movement and provides traders with a sell signal.
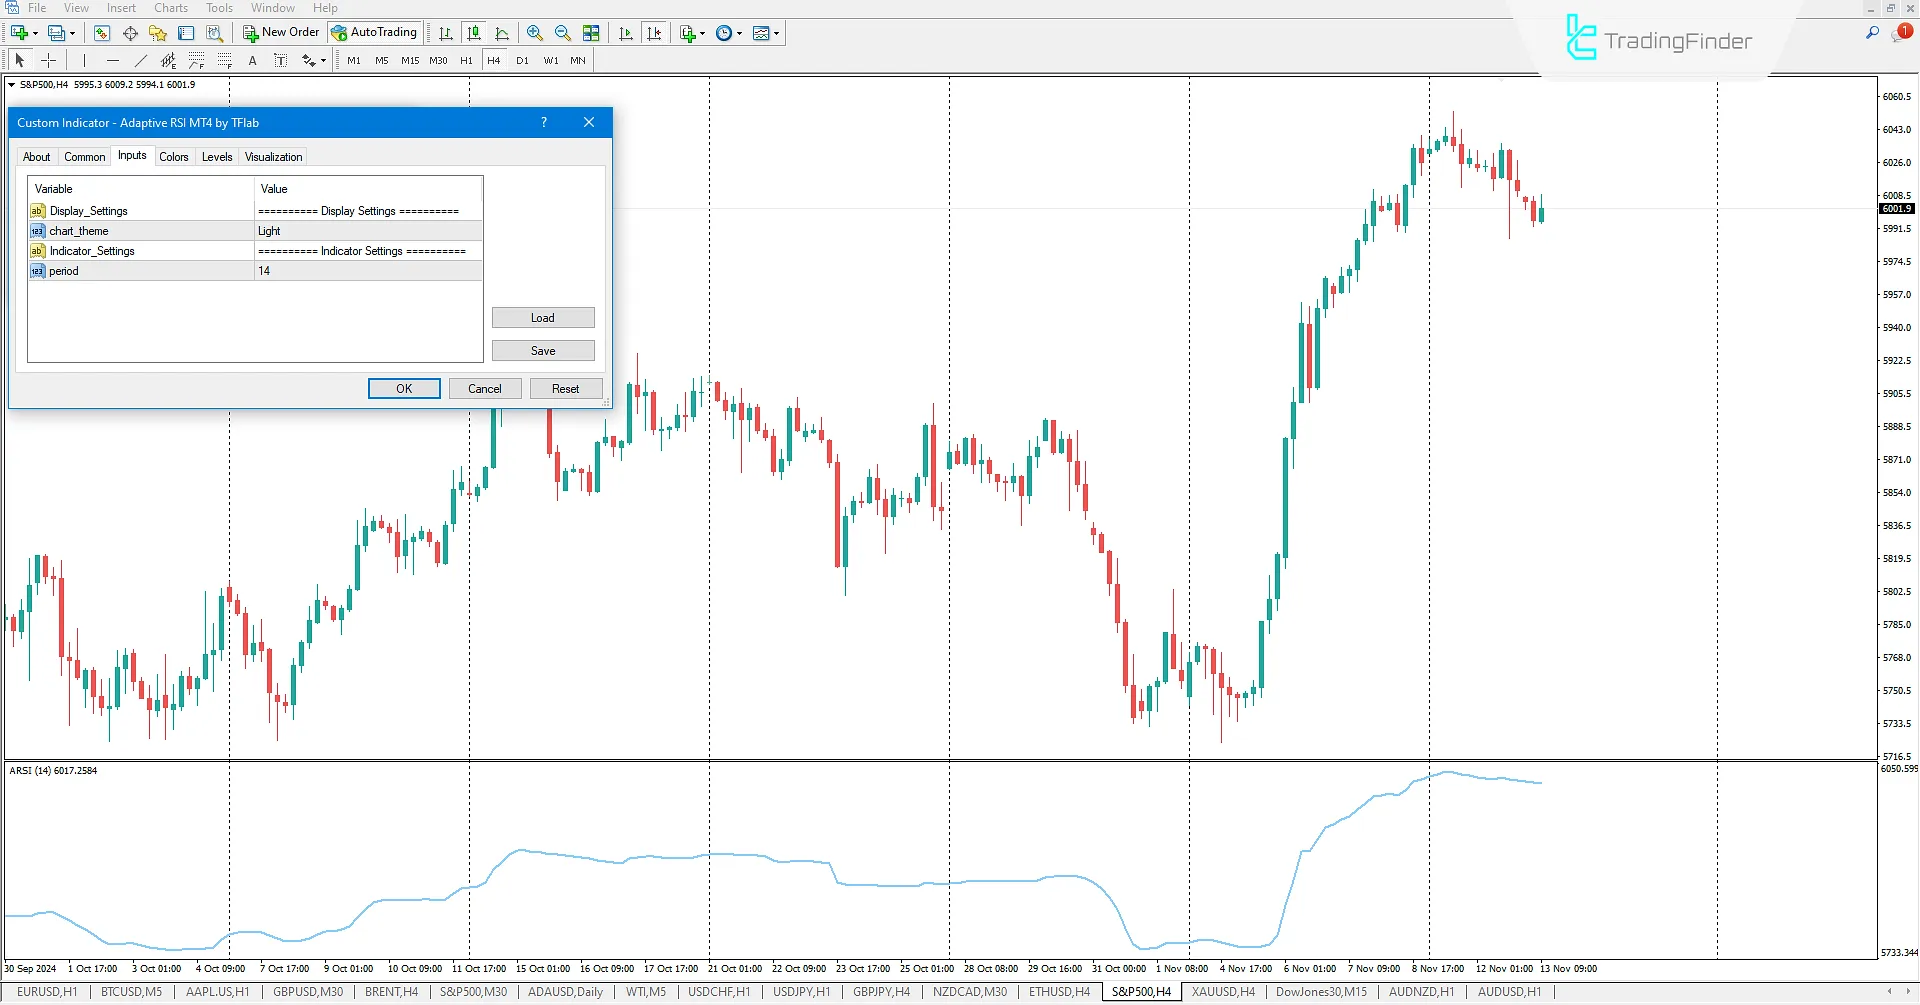
Oscillator Settings

Display_Settings
- Chart_theme: Customize the indicator's theme
Indicator_Settings
- Period: Set the RSI period
Conclusion
The Adaptive RSI indicator is an advanced and improved version of the Relative Strength Index (RSI) that elevates the accuracy and efficiency of this MT4 Trading Assist Indicators tool to a new level using a unique algorithm.
By reducing unnecessary fluctuations and providing more precise analysis, this indicator helps traders confidently identify price trends.
A vital feature of the Adaptive RSI is its ability to detect overbought and oversold levels. Traders can combine these signals with their trading strategies to make better entry or exit decisions.
This capability makes the Adaptive RSI an essential and practical tool for technical analysts.
Adaptive RSI indicator MT4 PDF
Adaptive RSI indicator MT4 PDF
Click to download Adaptive RSI indicator MT4 PDFWhat is the Adaptive RSI Indicator?
The Adaptive RSI indicator is an advanced version of the Relative Strength Index (RSI) that uses unique algorithms to increase analysis accuracy and reduce unnecessary fluctuations. This tool is designed to analyze price trends better and identify reversal points.
How does this indicator differ from the classic RSI?
The Adaptive RSI uses a unique algorithm to reduce noise and provide more accurate signals. Compared to the classic RSI, this indicator performs better and responds more effectively to rapid or gradual changes in market trends.


